

The real climate and transformative impact of ICT: A critique of estimates, trends, and regulations
- PMID: 34553177
- PMCID: PMC8441580
- DOI: 10.1016/j.patter.2021.100340
The real climate and transformative impact of ICT: A critique of estimates, trends, and regulations
Erratum in
-
Erratum: The real climate and transformative impact of ICT: A critique of estimates, trends, and regulations.Patterns (N Y). 2022 Aug 12;3(8):100576. doi: 10.1016/j.patter.2022.100576. eCollection 2022 Aug 12. Patterns (N Y). 2022. PMID: 36033584 Free PMC article.
Abstract
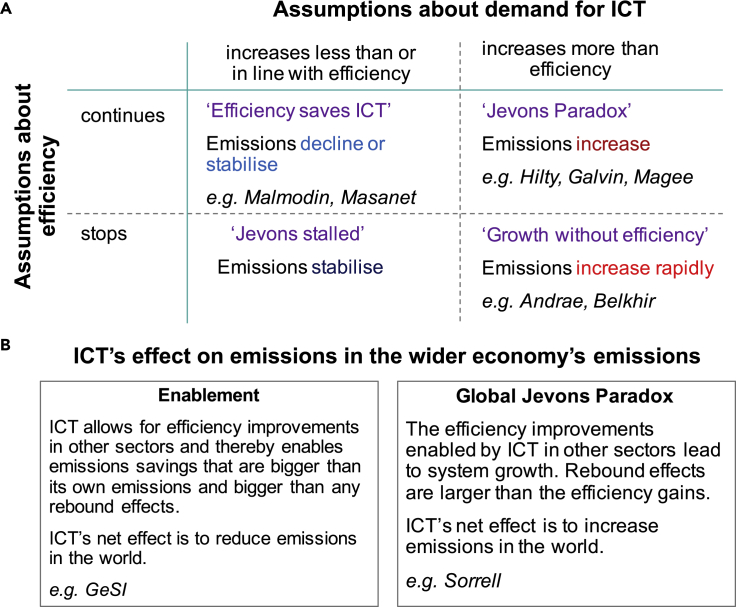
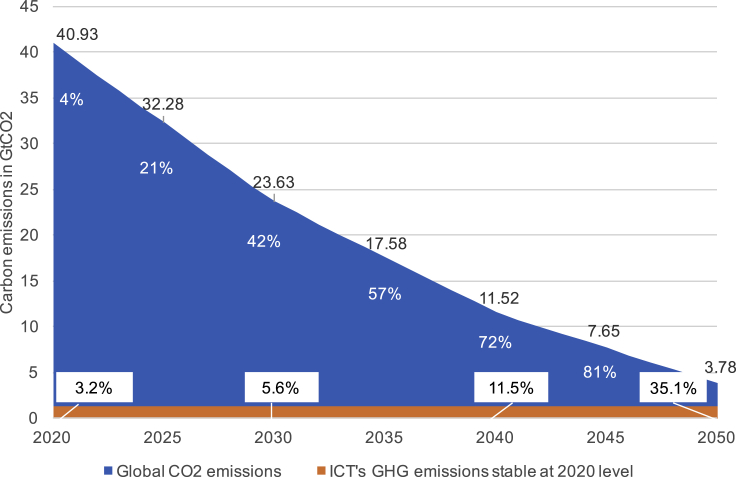
In this paper, we critique ICT's current and projected climate impacts. Peer-reviewed studies estimate ICT's current share of global greenhouse gas (GHG) emissions at 1.8%-2.8% of global GHG emissions; adjusting for truncation of supply chain pathways, we find that this share could actually be between 2.1% and 3.9%. For ICT's future emissions, we explore assumptions underlying analysts' projections to understand the reasons for their variability. All analysts agree that ICT emissions will not reduce without major concerted efforts involving broad political and industrial action. We provide three reasons to believe ICT emissions are going to increase barring intervention and find that not all carbon pledges in the ICT sector are ambitious enough to meet climate targets. We explore the underdevelopment of policy mechanisms for enforcing sector-wide compliance, and contend that, without a global carbon constraint, a new regulatory framework is required to keep the ICT sector's footprint aligned with the Paris Agreement.
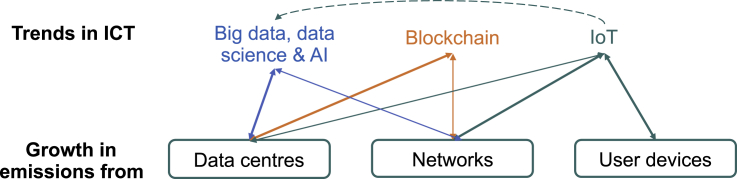
Keywords: AI; ICT; IoT; big data; blockchain; carbon footprint; data science; policy; regulations; trends.
© 2021 The Authors.
Conflict of interest statement
Charlotte Freitag is an employee at Evenlode Investment Ltd. Mike Berners-Lee is the founder and principle consultant of Small World Consulting. Bran Knowles is a member of the ACM Europe Council, and the ACM Europe Technology Policy Committee, where she leads the standing group on climate change. Gordon Blair is a Research Fellow in the UK Center for Ecology and Hydrology (UKCEH) and is a member of the Patterns advisory board.
Figures
References
-
- Ritchie H., Roser M. Our World in Data; 2019. How Have Global CO2 Emissions Changed over Time?https://ourworldindata.org/co2-and-other-greenhouse-gas-emissions#how-ha...
-
- Jarvis A.J., Leedal D.T., Hewitt C.N. Climate–society feedbacks and the avoidance of dangerous climate change. Nat. Clim. Change. 2012;2:668–671.
-
- Anders S.G.A., Edler T. On global electricity usage of communication technology: trends to 2030. Challenges. 2015;6:117–157.
-
- Anders S.G.A. Prediction studies of electricity use of global computing in 2030. Int. J. Sci. Eng. Invest. 2019;8:27–33.
-
- Anders S.G.A. Comparison of several simplistic high-level approaches for estimating the global energy and electricity use of ICT networks and data centers. Int. J. 2019;5:51.
Publication types
LinkOut - more resources
Full Text Sources
