

Regional trends and drivers of the global methane budget
- PMID: 34553464
- PMCID: PMC9298116
- DOI: 10.1111/gcb.15901
Regional trends and drivers of the global methane budget
Abstract
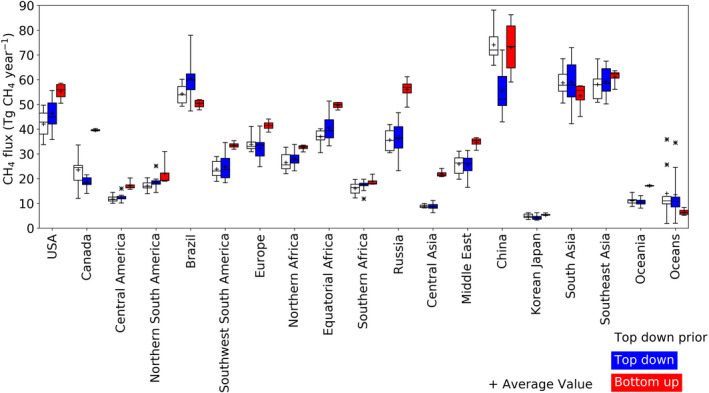
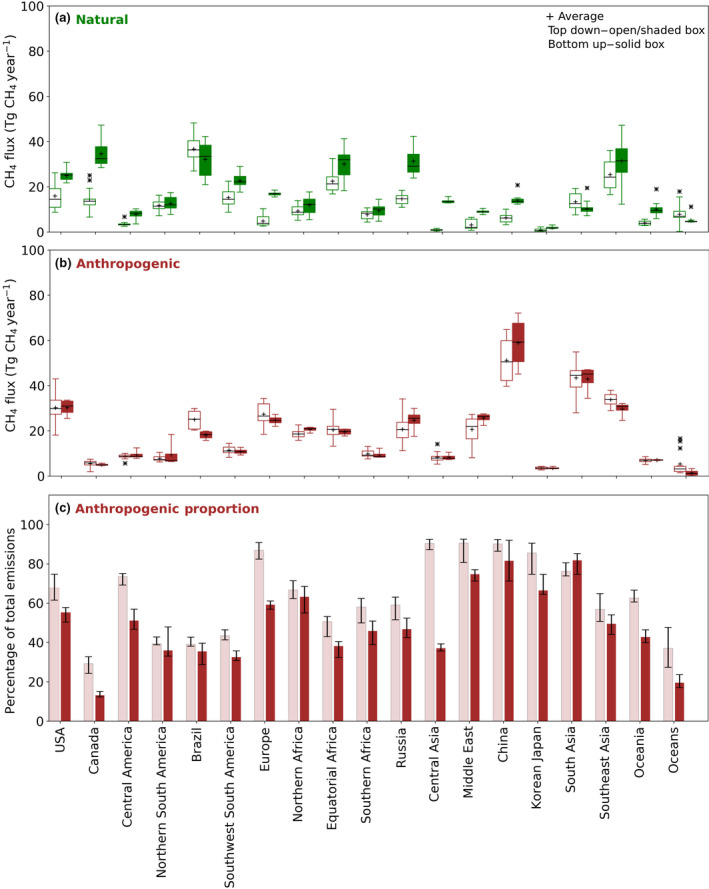
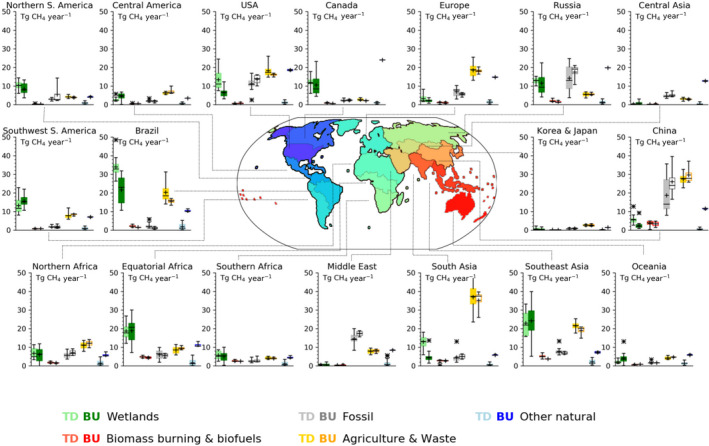
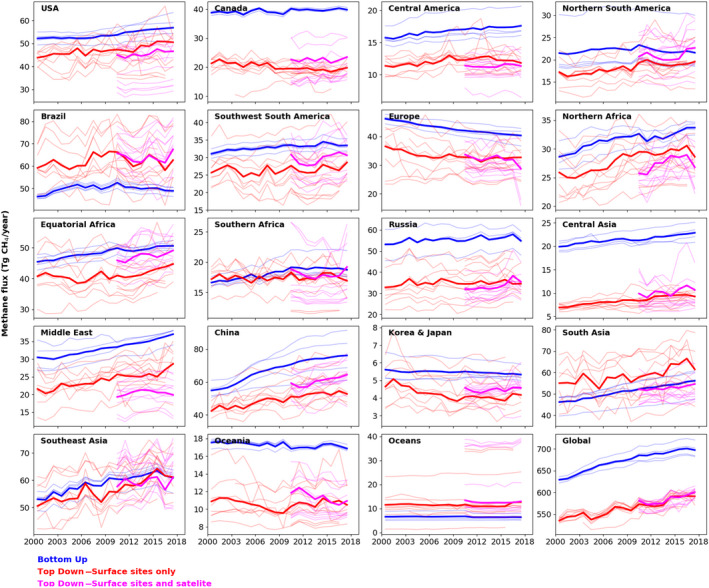
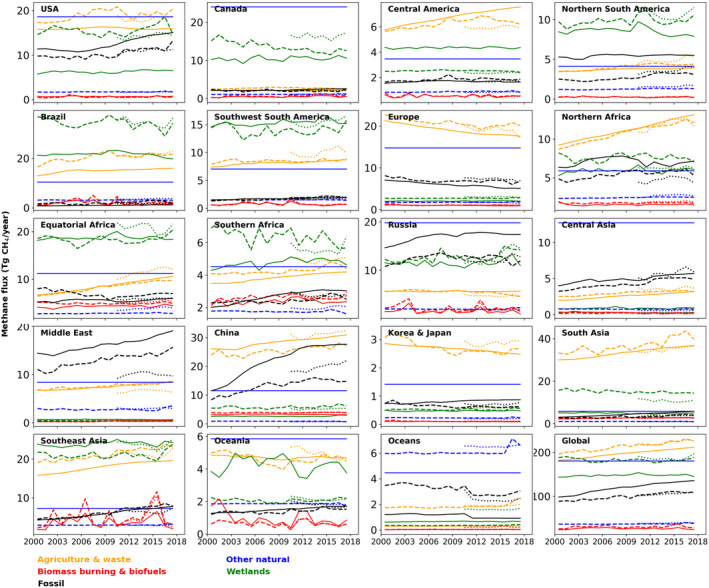
The ongoing development of the Global Carbon Project (GCP) global methane (CH4 ) budget shows a continuation of increasing CH4 emissions and CH4 accumulation in the atmosphere during 2000-2017. Here, we decompose the global budget into 19 regions (18 land and 1 oceanic) and five key source sectors to spatially attribute the observed global trends. A comparison of top-down (TD) (atmospheric and transport model-based) and bottom-up (BU) (inventory- and process model-based) CH4 emission estimates demonstrates robust temporal trends with CH4 emissions increasing in 16 of the 19 regions. Five regions-China, Southeast Asia, USA, South Asia, and Brazil-account for >40% of the global total emissions (their anthropogenic and natural sources together totaling >270 Tg CH4 yr-1 in 2008-2017). Two of these regions, China and South Asia, emit predominantly anthropogenic emissions (>75%) and together emit more than 25% of global anthropogenic emissions. China and the Middle East show the largest increases in total emission rates over the 2000 to 2017 period with regional emissions increasing by >20%. In contrast, Europe and Korea and Japan show a steady decline in CH4 emission rates, with total emissions decreasing by ~10% between 2000 and 2017. Coal mining, waste (predominantly solid waste disposal) and livestock (especially enteric fermentation) are dominant drivers of observed emissions increases while declines appear driven by a combination of waste and fossil emission reductions. As such, together these sectors present the greatest risks of further increasing the atmospheric CH4 burden and the greatest opportunities for greenhouse gas abatement.
Keywords: anthropogenic emissions; bottom-up; methane emissions; natural emissions; regional; source sectors; top-down.
© 2021 The Authors. Global Change Biology published by John Wiley & Sons Ltd. This article has been contributed to by US Government employees and their work is in the public domain in the USA.
Conflict of interest statement
The authors declare that there are no competing financial interests.
Figures
References
-
- Andela, N. , & van der Werf, G. R. (2014). Recent trends in African fires driven by cropland expansion and El Niño to La Niña transition. Nature Climate Change, 4(9), 791–795. 10.1038/nclimate2313 - DOI
-
- Anderson, D. C. , Duncan, B. N. , Fiore, A. M. , Baublitz, C. B. , Follette‐Cook, M. B. , Nicely, J. M. , & Wolfe, G. M. (2021). Spatial and temporal variability in the hydroxyl (OH) radical: Understanding the role of large‐scale climate features and their influence on OH through its dynamical and photochemical drivers. Atmospheric Chemistry and Physics, 21(8), 6481–6508. 10.5194/acp-21-6481-2021 - DOI
-
- Aragão, L. E. O. C. , Anderson, L. O. , Fonseca, M. G. , Rosan, T. M. , Vedovato, L. B. , Wagner, F. H. , Silva, C. V. J. , Silva Junior, C. H. L. , Arai, E. , Aguiar, A. P. , Barlow, J. , Berenguer, E. , Deeter, M. N. , Domingues, L. G. , Gatti, L. , Gloor, M. , Malhi, Y. , Marengo, J. A. , Miller, J. B. , … Saatchi, S. (2018). 21st Century drought‐related fires counteract the decline of Amazon deforestation carbon emissions. Nature Communications, 9(1), 536. 10.1038/s41467-017-02771-y - DOI - PMC - PubMed
-
- Bergamaschi, P. , Houweling, S. , Segers, A. , Krol, M. , Frankenberg, C. , Scheepmaker, R. A. , & Gerbig, C. (2013). Atmospheric CH4 in the first decade of the 21st century: Inverse modeling analysis using SCIAMACHY satellite retrievals and NOAA surface measurements. Journal of Geophysical Research: Atmospheres, 118(13), 7350–7369. 10.1002/jgrd.50480 - DOI
MeSH terms
Substances
LinkOut - more resources
Full Text Sources
Research Materials
Miscellaneous
