. 2021 Nov 1;218(11):e20201656.
doi: 10.1084/jem.20201656. Epub 2021 Sep 23.

BTK operates a phospho-tyrosine switch to regulate NLRP3 inflammasome activity

Affiliations

BTK operates a phospho-tyrosine switch to regulate NLRP3 inflammasome activity

Zsófia Agnes Bittner et al. J Exp Med. .

Abstract

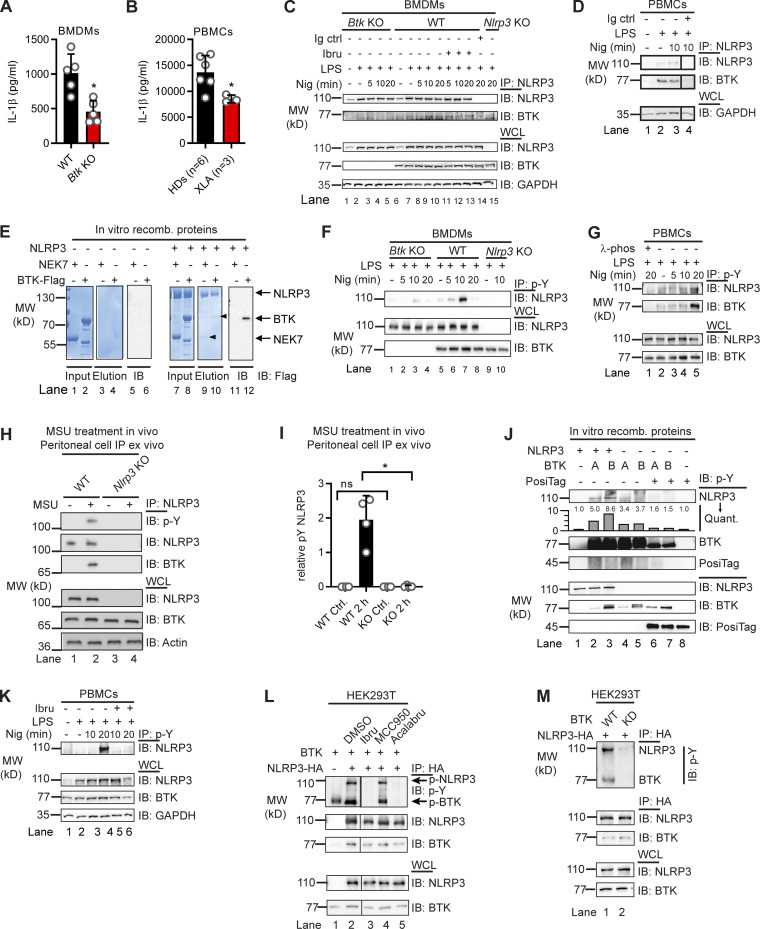
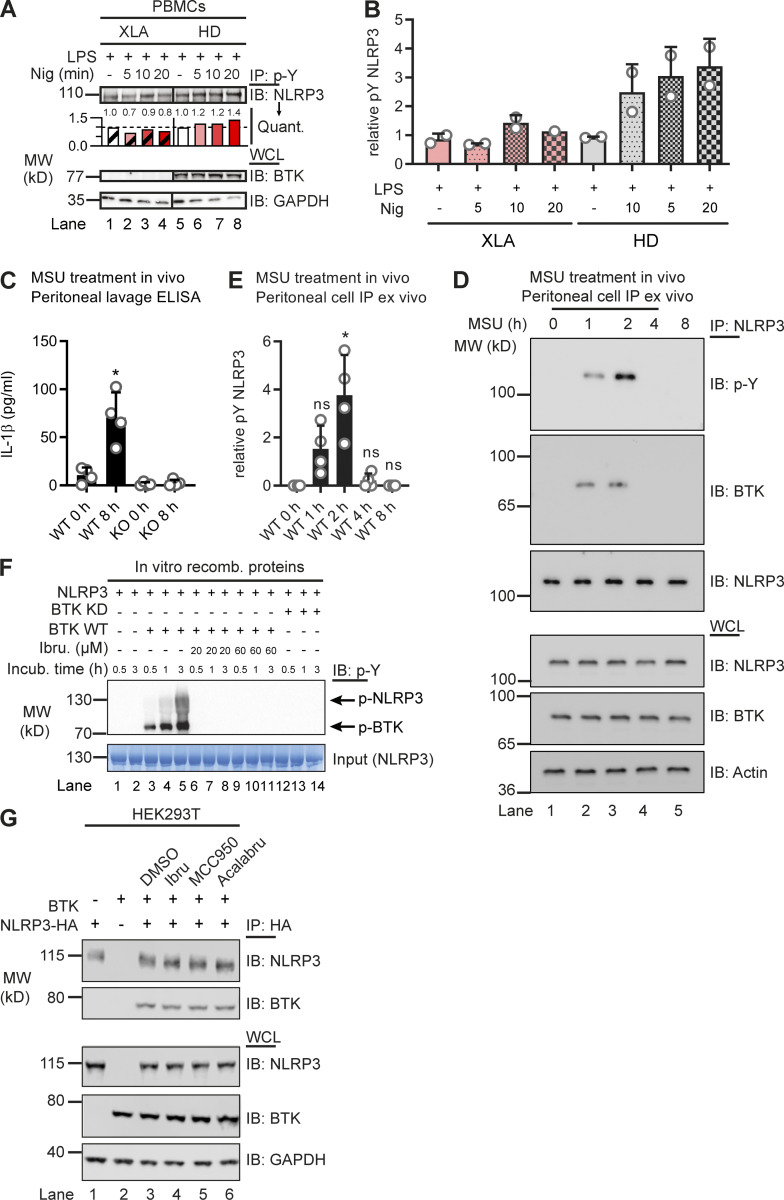
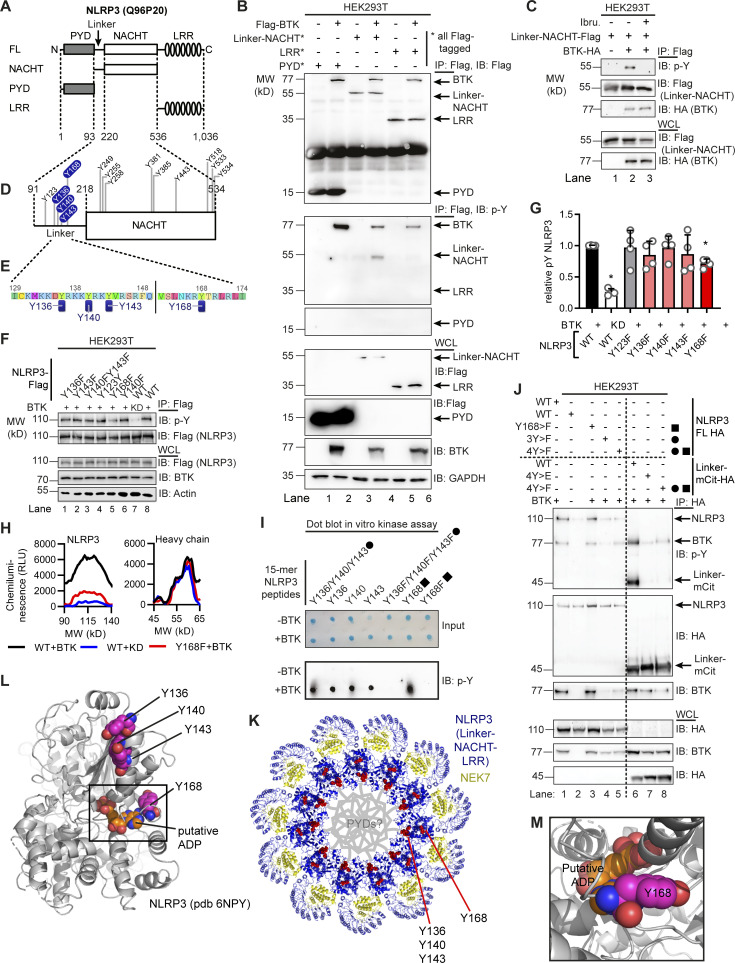
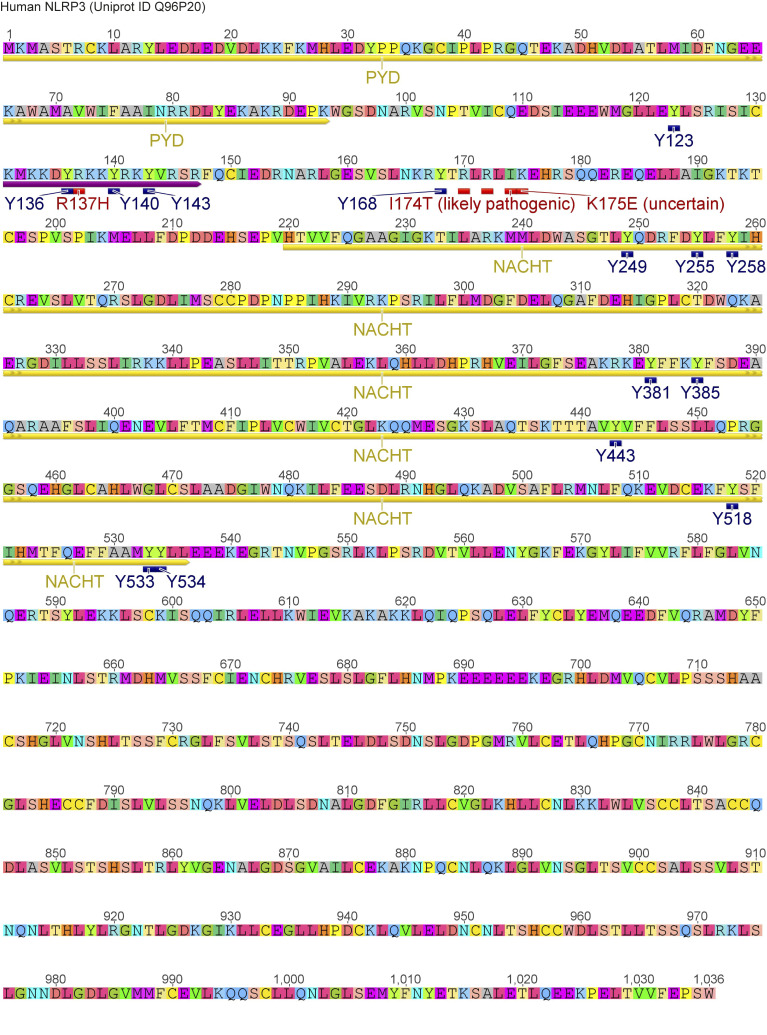
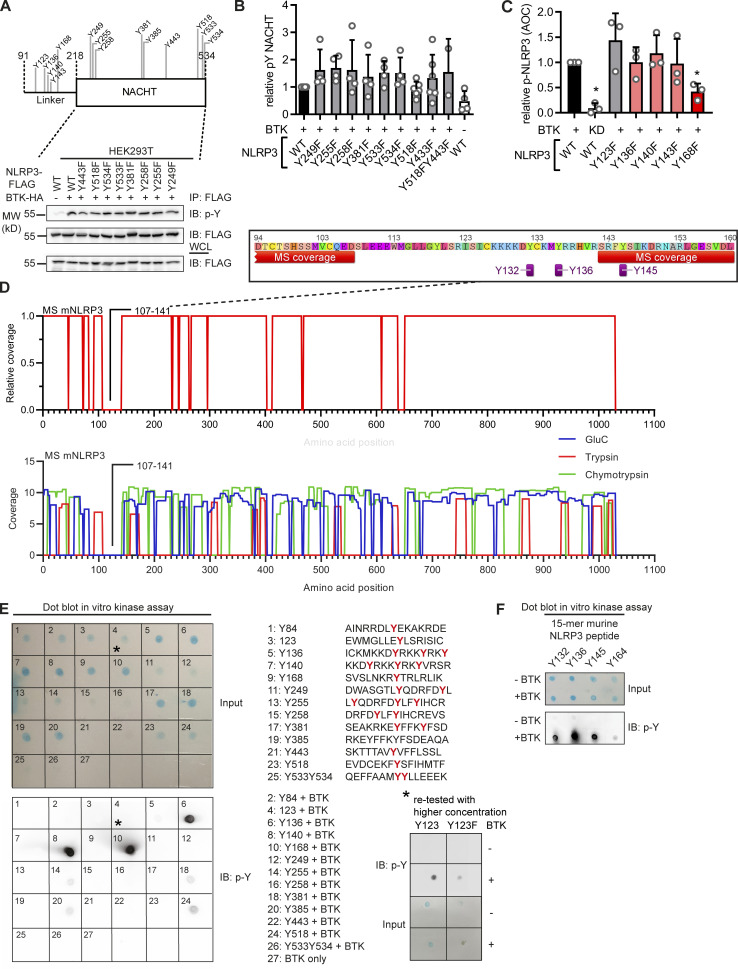
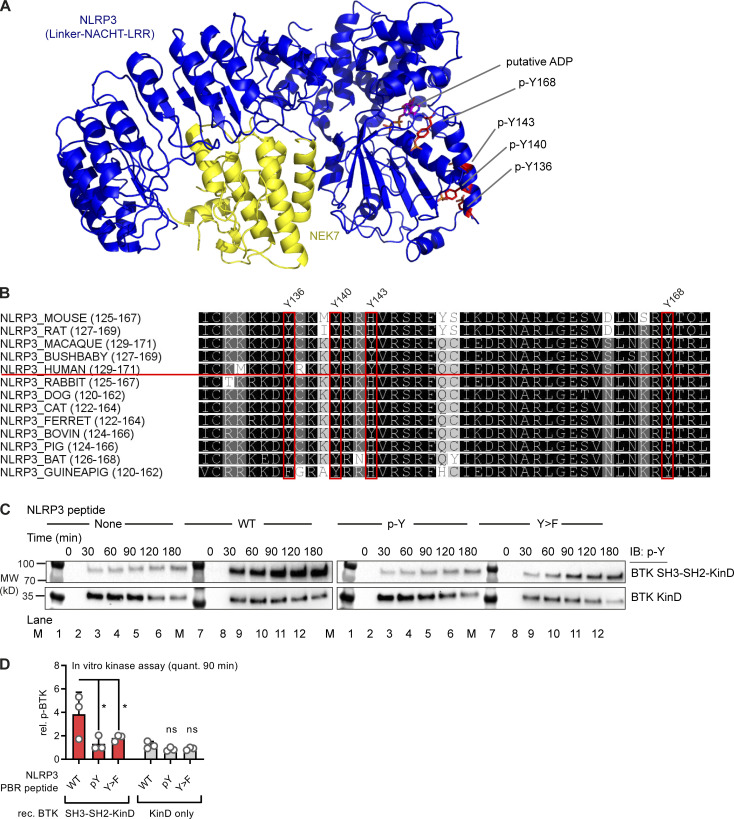
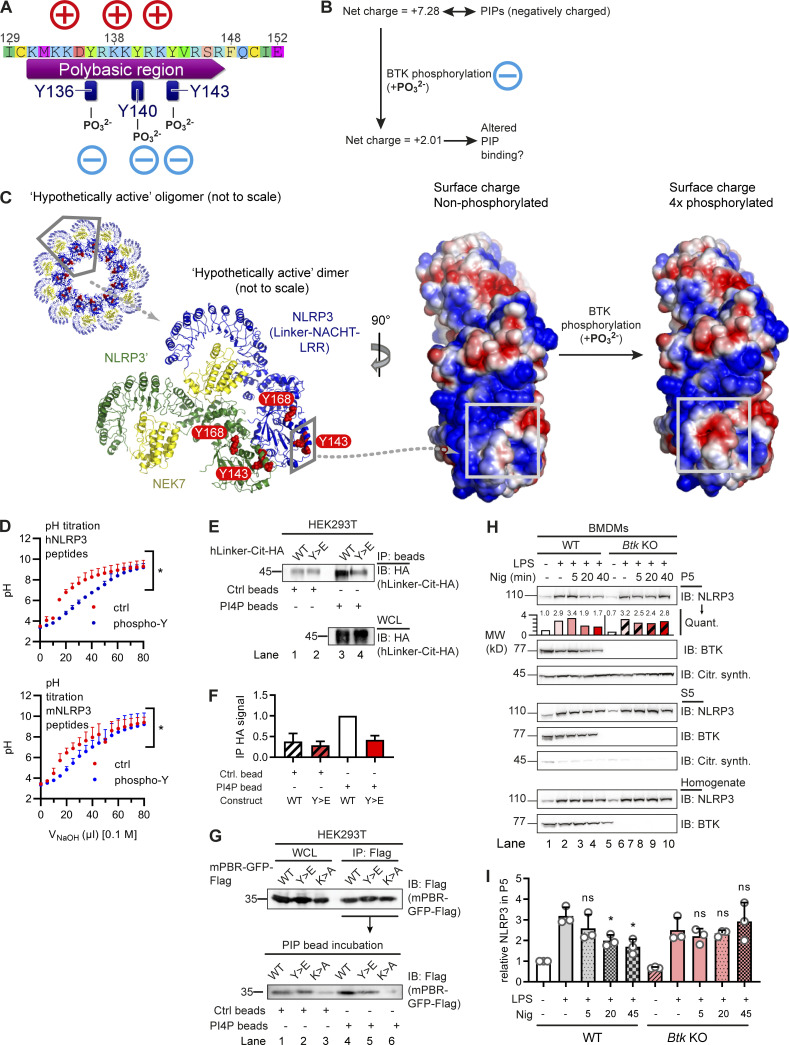
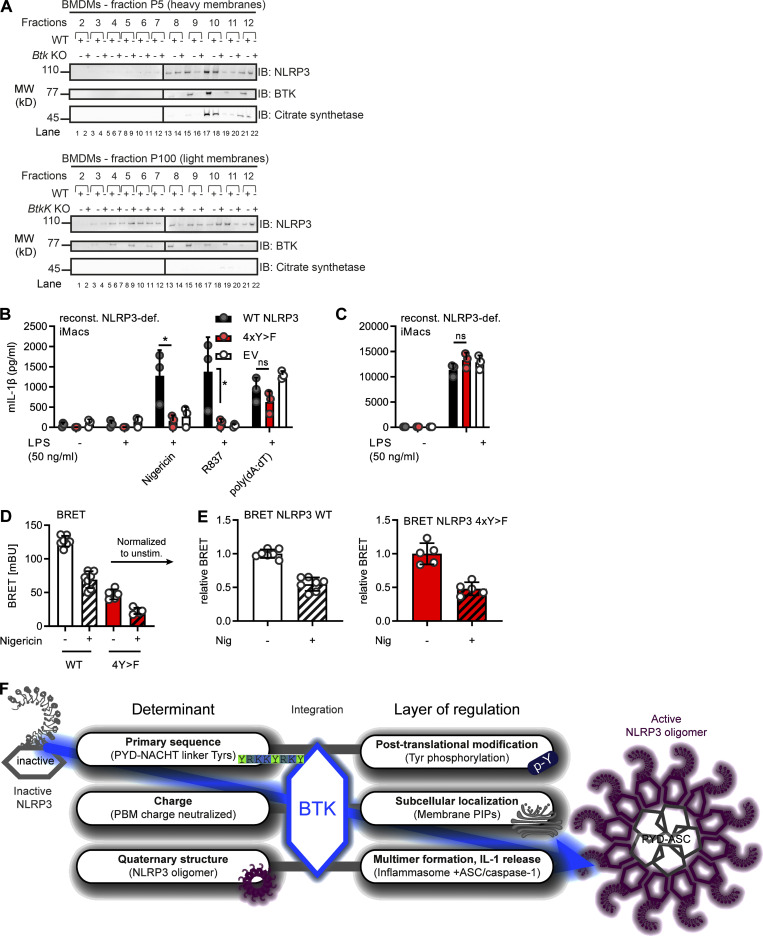
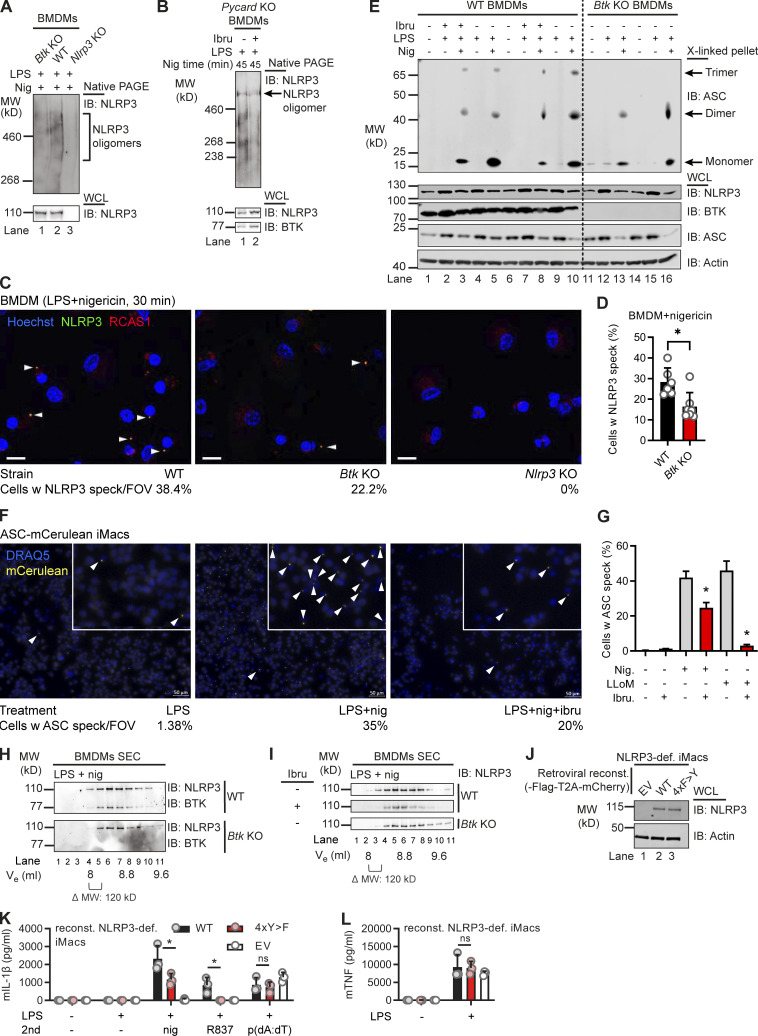
Activity of the NLRP3 inflammasome, a critical mediator of inflammation, is controlled by accessory proteins, posttranslational modifications, cellular localization, and oligomerization. How these factors relate is unclear. We show that a well-established drug target, Bruton's tyrosine kinase (BTK), affects several levels of NLRP3 regulation. BTK directly interacts with NLRP3 in immune cells and phosphorylates four conserved tyrosine residues upon inflammasome activation, in vitro and in vivo. Furthermore, BTK promotes NLRP3 relocalization, oligomerization, ASC polymerization, and full inflammasome assembly, probably by charge neutralization, upon modification of a polybasic linker known to direct NLRP3 Golgi association and inflammasome nucleation. As NLRP3 tyrosine modification by BTK also positively regulates IL-1β release, we propose BTK as a multifunctional positive regulator of NLRP3 regulation and BTK phosphorylation of NLRP3 as a novel and therapeutically tractable step in the control of inflammation.


Conflict of interest statement

Disclosures: J.B. Kümmerle-Deschner reported grants from Novartis, personal fees from Novartis, grants from SOBI, and personal fees from SOBI outside the submitted work. B. Grimbacher reported grants from BMBF, grants from DFG, grants from several pharmaceutical companies, personal fees from several pharmaceutical companies, and grants from foundations outside the submitted work. E. Latz is co-founder and consultant to IFM Therapeutics. No other disclosures were reported.

Figures

Figure 1.
Figure 1.
NLRP3 directly interacts with and is tyrosine phosphorylated by BTK. (A and B) IL-1β release (triplicate ELISA) from WT versus Btk KO BMDMs (A; n = 5 each) or XLA versus HD PBMCs (B; n = 3 or 6 per group). (C and D) Coimmunoprecipitation (Co-IP) of NLRP3 from WT, Btk KO, or Nlrp3 KO BMDM (C; n = 3) or ibrutinib-treated PBMC lysates (D; n = 2). Black lines indicate that intervening lanes have been spliced out. (E) In vitro pulldown of Flag-tagged BTK or His-SUMO–tagged NEK7 by MBP-tagged NLRP3 (n = 3). Arrowheads denote copurified NEK7 and BTK in the eluates. The BTK band was further confirmed by Flag-IP. (F) Co-IP from WT, Btk KO, or Nlrp3 KO BMDMs using anti–p-Y antibodies (n = 3). (G) Co-IP from PBMCs using anti–p-Y (n = 5). λ-Phosphatase was added as a dephosphorylation control where indicated (n = 2). (H and I) Co-IP from peritoneal lavage cells harvested 2 h after MSU i.p. injection (n = 4; quantified in I relative to background in lane 1). (J) In vitro kinase assay using two different commercial suppliers, A and B, of recombinant BTK. Posi-Tag = specificity control. Quantification relative to background in lane 1 (n = 2). (K) Co-IP from PBMCs using anti–p-Y antibodies with prior ibrutinib pretreatment (n = 3). (L and M) IPs from HEK293T cells transfected with NLRP3 and BTK WT or KD constructs or treated with inhibitors (n = 2 each). A, B, and I represent combined data (mean + SD) from n biological replicates (each dot represents one mouse or patient/HD). C–H and J–M are representative of n biological (HD or mouse) or technical replicates. *, P < 0.05 using Student’s t test (A), one-way ANOVA with Dunnett’s correction (B), or Mann–Whitney U test (I). Acalabru, acalabrutinib; ctrl, control; IB, immunoblot; Ibru, ibrutinib; Nig, nigericin; Quant., quantification.
Figure S1.
Figure S1.
BTK-dependence of NLRP3 tyrosine phosphorylation. (A and B) Coimmunoprecipitation (Co-IP) of NLRP3 from HD or XLA patient PBMC lysates (n = 2 each), quantified in A relative to lane 1 or 5, respectively, and in B, relative to GAPDH in the respective LPS-only control across experiments. Black lines indicate that intervening lanes have been spliced out. (C–E) In vivo MSU peritonitis model (n = 4 in each group). (C) IL-1β release by triplicate ELISA from peritoneal lavage supernatant 0 or 8 h after MSU-treatment in vivo. (D) Analysis of representative peritoneal lavage cell lysates at different times after MSU-treatment in vivo. (E) Quantification of p-Y–NLRP3 immunoblot (IB) relative to background in NLRP3 IPs from peritoneal lavage cells (n = 3). (F) pNLRP3 occurrence in the in vitro kinase assay with BTK or KD BTK upon incubation with ATP for the indicated time periods, with and without ibrutinib (n = 3). (G) HEK293T cells were transfected with the indicated NLRP3 and BTK WT or mutant constructs and treated with inhibitors, and lysates were subjected to HA-IP and IB (n = 3 each). In A, D, F, and G, one representative example of n biological replicates is shown. B, C, and E represent combined data (mean + SD) from n biological replicates (each dot represents one donor or mouse). *, P < 0.05 according to one-way ANOVA with Šidák (C) or Dunnett’s (E) correction. Acalabru, acalabrutinib; Ibru, ibrutinib; Incub., incubation; Nig, nigericin; recomb., recombinant.
Figure 2.
Figure 2.
BTK phosphorylates the PYD-NACHT linker. (A) NLRP3 domains (UniProt ID Q96P20). (B) Flag immunoprecipitation (Flag-IP) from HEK293T cells transfected with Flag-tagged NLRP3 truncation and/or Flag–BTK constructs (n = 3). (C) As in B but including ibrutinib (n = 3). (D) Positions of targeted tyrosine residues. (E) Linker region including polybasic motif. (F) As in B but using NLRP3 Y>F point mutants or WT NLRP3, with WT or KD BTK plasmids (n = 4). (G) Quantification of F (n = 4). (H) WES capillary electrophoresis of NLRP3 Flag-IP from HEK293T cells transfected with WT or mutant Flag-NLRP3 and WT or KD BTK (n = 3). (I) Dot blot of BTK assay with 15-mer NLRP3-derived WT or mutant synthetic peptides (n = 3). After BTK removal using anti-His beads, peptide mixtures were directly spotted and stained with a total peptide stain (input) or anti–p-Y. A circle denotes peptides containing the three PBR tyrosines, and a square denotes Y168-containing peptides. (J) As in F but also NLRP3 linker (WT or Y mutated) fused to mCitrine (mCit)-HA (n = 3). (K) Tyrosines (red) highlighted in the model of NLRP3 (blue)–NEK7 (yellow) complex (PDB: 6NPY). (L and M) Close-up view on dimer interface (L) and putative nucleotide binding site (M). G represents combined data (mean + SD) from n biological replicates (each dot represents one replicate). B, C, F, and H–J are representative of n technical replicates. *, P < 0.05 according to one-sample t test (G). IB, immunoblot; Ibru., ibrutinib; RLU, relative light unit.
Figure S2.
Figure S2.
Position of tyrosine residues and disease-associated mutations in the linker and/or NACHT domain of human NLRP3. Annotation of NLRP3 sequence (UniProt accession no. Q96P20).
Figure S3.
Figure S3.
Positional mapping of BTK-modified tyrosine residues in NLRP3. (A) Position of all mutated tyrosine residues in linker–NACHT construct and phosphorylation analysis of core-NACHT tyrosine NLRP3 mutants. HEK293T cells were transfected with the indicated NLRP3 mutant constructs and a BTK WT construct as indicated, and lysates were subjected to HA-immunoprecipitation (IP) and immunoblot (IB) as indicated (n = 4 each). (B) Quantification of A combined from n = 4 experiments as the ratio of p-Y–NLRP3 to total NLRP3 in the IP fraction normalized to transfection with WT NLRP3. (C) Quantification of WES capillary electrophoresis of NLRP3 p-Y IPs from HEK293T cells (Fig. 2 H) from n = 3 experiments. (D) Data from MS analysis of purified murine NLRP3 (mNLRP3), digested with different proteases, showing combined (top) and separate coverage (bottom) information extracted from Stutz et al. (2013) and replotted here. (E) Dot blot of in vitro kinase assay of His-BTK and 15-mer synthetic peptides derived from human NLRP3, containing the indicated tyrosines stained with a total protein stain (top grid; input) or anti–p-Y antibodies (bottom grid; n = 3). (F) As in E but with peptides derived from murine NLRP3 ((n = 3). B and C represent combined data (mean + SD) from n biological replicates. In E and F, one representative example of n biological replicates is shown. *, P < 0.05 according to one-sample t test (B and C). AOC, antioxidant capacity.
Figure S4.
Figure S4.
Structural positioning, sequence conservation of BTK-modified tyrosine residues in NLRP3, and effect of NLRP3 on BTK kinase activity. (A and B) Structural aspects and conservation of BTK-modified tyrosine residues in NLRP3. (A) NLRP3 model 6NPY showing NLRP3 linker-NACHT-LRR (blue) and NEK7 C-terminal lobe (yellow). A putative bound ADP molecule and selected tyrosines are highlighted. (B) ClustalW multiple sequence alignments of NLRP3 sequences from other species. Coloring according to similarity (black, conserved). BTK-modified tyrosines are highlighted (residue numbering according to human NLRP3). (C and D) Effect of NLRP3 peptides (WT Y sequence, p-Y sequence, or Y>F) on phosphorylation (assessed by p-Y blot) of the SH3-SH2-KinD or KinD-truncated BTK proteins purified from insect cells. BTK phosphorylation as investigated by immunoblot (IB) is indicative of BTK activation (n = 3). C shows one representative example of n technical replicates, combined in D. *, P < 0.05 according to two-way ANOVA (D). M, MW ladder; quant., quantification; rec., recombinant; rel. relative.
Figure 3.
Figure 3.
BTK phosphorylation of the NLRP3 polybasic motif enables Golgi/PI4P dissociation. (A and B) Charge distribution (A) and ProtPi net charge computation (B) of unmodified and 3× phosphopeptide human NLRP3 PBR. (C) CHARMM surface charge predictions of linker–NACHT–LRR structure in the putative nonphosphorylated (left) and 4× phosphorylated (right) form. Blue, positive charge; red, negative charge. Gray boxes indicate that the area of charge alterations in the monomers maps to a contact area in the hypothetical dimer (center, rotated by 90°; see relative position in oligomer below). (D) pH titration of peptides encompassing the polybasic motifs of human or murine NLRP3 as phospho (blue) or non-phosphorylated control (ctrl; red) peptide (n = 3). (E and F) Human NLRP3 linker-Cit-HA constructs precipitated with PI4P beads (n = 2; quantified in F relative to immunoprecipitation [IP] HA signal in WT transfection [lane 1]). (G) As in E but murine NLRP3 PBR fused to GFP-Flag (mPBR-GFP-Flag; n = 2). (H and I) Subcellular fractionation of nigericin-treated WT or Btk KO BMDM lysates into P5 (heavy membranes) and S5 (light membranes and cytosol; n = 3; quantified relative to untreated [lane 1] in the experiment shown in H or across experiments in I). D, F, and I represent combined data (mean + SD) from n biological replicates. In E, G, and H, one representative example of n technical replicates is shown. *, P < 0.05 according to one-way ANOVA with Šidák correction (I; relative to respective LPS only) or two-way ANOVA (D). Citr. synth., citrate synthetase; Ctrl, control; IB, immunoblot; Nig, nigericin; Quant., quantification.
Figure S5.
Figure S5.
Subcellular fractionation of NLRP3 and BTK, effect of tyrosine mutation on NLRP3 activity and conformation and graphical abstract. (A) Sucrose gradient fractionation of WT and Btk KO BMDM lysates upon LPS + nigericin treatment for 5 min. Fractions were analyzed by SDS-PAGE and immunoblot (IB) as indicated (n = 1; pilot fractionation experiment). (B and C) Low concentration (50 ng/ml) LPS priming, nigericin stimulation, and subsequent IL-1β (B) or TNF (C) release from WT or 4xY>F human NLRP3-expressing reconstituted Nlrp3 KO iMacs, measured by ELISA (n = 3). (D and E) Response of NLRP3 BRET sensors to nigericin in HEK293T cells treated 24 h after transfection with 10 μM nigericin for 30 min or left mock treated before subsequent BRET measurement. BRET signals (D) were also normalized to the mean obtained for each construct mock treated (E; both n = 6–8). (F) Graphical summary illustrating multiple roles of BTK as NLRP3 regulator. B–E represent combined data (mean + SD) from n biological replicates. In A, one representative example of n biological replicates is shown. *, P < 0.05 according to one-way ANOVA with (B) or without (C) Šidák correction. def., deficient; EV, empty vector; Nig, nigericin; PBM, polybasic motif; reconst., reconstituted; unstim., unstimulated.
Figure 4.
Figure 4.
BTK modification affects NLRP3 oligomerization and IL-1β release. (A and B) WT, Btk KO, Nlrp3 KO, or Pycard (ASC) KO BMDMs stimulated (45 min nigericin) and respective lysates analyzed directly by native PAGE (A, n = 2; B, n = 4). (C) Representative fluorescence microscopy images of NLRP3 specks in WT, Btk KO, and Nlrp3 KO primed with LPS, stimulated (30 min nigericin), and stained as indicated (n = 2). Blue, nuclei (Hoechst); green, NLRP3; red, Golgi (RCAS1). Scale bar = 10 μm; arrowheads mark NLRP3 specks. (D) Quantification from multiple 3 × 3 tiles per strain per experiment. (E) As in A or B but ASC in WCLs was cross-linked upon stimulation, with or without ibrutinib pretreatment (n = 4). (F) Representative fluorescence microscopy images of ASC specks in Nlrp3 KO iMacs reconstituted with NLRP3-Flag ASC-mCerulean and stimulated as indicated. Blue, nuclei (DRAQ5); yellow, ASC (mCerulean). Scale bar = 50 μm; arrowheads mark only one ASC speck per overview image for the sake of clarity, but in the insets, all specks are marked. (G) Quantification from multiple images per treatment per experiment (n = 2). (H) As in A but lysates were applied to size-exclusion chromatography (SEC) before fractions were analyzed (n = 3). (I) As in H comparing inhibitor-treated WT BMDM or Btk KO BMDM lysates (n = 3). (J–L) NLRP3 expression levels determined by immunoblot (IB), IL-1β, or TNF release quantified by triplicate ELISA in/from WT or 4xY>F NLRP3-reconstituted NLRP3-deficient iMacs (n = 3). D, G, K, and L represent combined data (mean + SD) from n technical replicates. A–C, E, F, H, and I are representative of n biological (mice) or technical replicates. *, P < 0.05 according to Mann–Whitney U test (D), Student’s t test (G), and one-way ANOVA with (K) or without (L) Šidák correction. def., deficient; EV, empty vector; FOV, field of view; Ibru, ibrutinib; Nig, nigericin; reconst., reconstituted; Ve, elution volume; w, with.

References

    1. Banoth, B., and Cassel S.L.. 2017. Bruton tyrosine kinase inhibition: Clinical relevance beyond B cells. J. Allergy Clin. Immunol. 140:985–987. 10.1016/j.jaci.2017.03.041 - DOI - PubMed
    1. Broderick, L., De Nardo D., Franklin B.S., Hoffman H.M., and Latz E.. 2015. The inflammasomes and autoinflammatory syndromes. Annu. Rev. Pathol. 10:395–424. 10.1146/annurev-pathol-012414-040431 - DOI - PubMed
    1. Byrd, J.C., Furman R.R., Coutre S.E., Flinn I.W., Burger J.A., Blum K.A., Grant B., Sharman J.P., Coleman M., Wierda W.G., et al. . 2013. Targeting BTK with ibrutinib in relapsed chronic lymphocytic leukemia. N. Engl. J. Med. 369:32–42. 10.1056/NEJMoa1215637 - DOI - PMC - PubMed
    1. Carpenter, A.E., Jones T.R., Lamprecht M.R., Clarke C., Kang I.H., Friman O., Guertin D.A., Chang J.H., Lindquist R.A., Moffat J., et al. . 2006. CellProfiler: image analysis software for identifying and quantifying cell phenotypes. Genome Biol. 7:R100. 10.1186/gb-2006-7-10-r100 - DOI - PMC - PubMed
    1. Chen, J., and Chen Z.J.. 2018. PtdIns4P on dispersed trans-Golgi network mediates NLRP3 inflammasome activation. Nature. 564:71–76. 10.1038/s41586-018-0761-3 - DOI - PMC - PubMed

Publication types

MeSH terms