

Epidemiologic Trends of and Factors Associated With Overall Survival for Patients With Gastroenteropancreatic Neuroendocrine Tumors in the United States
- PMID: 34554237
- PMCID: PMC8461504
- DOI: 10.1001/jamanetworkopen.2021.24750
Epidemiologic Trends of and Factors Associated With Overall Survival for Patients With Gastroenteropancreatic Neuroendocrine Tumors in the United States
Abstract
Importance: Although the incidence and prevalence of gastroenteropancreatic neuroendocrine tumors (GEP-NETs) have been thought to have increased during the past decades, updated epidemiologic and survival data are lacking.
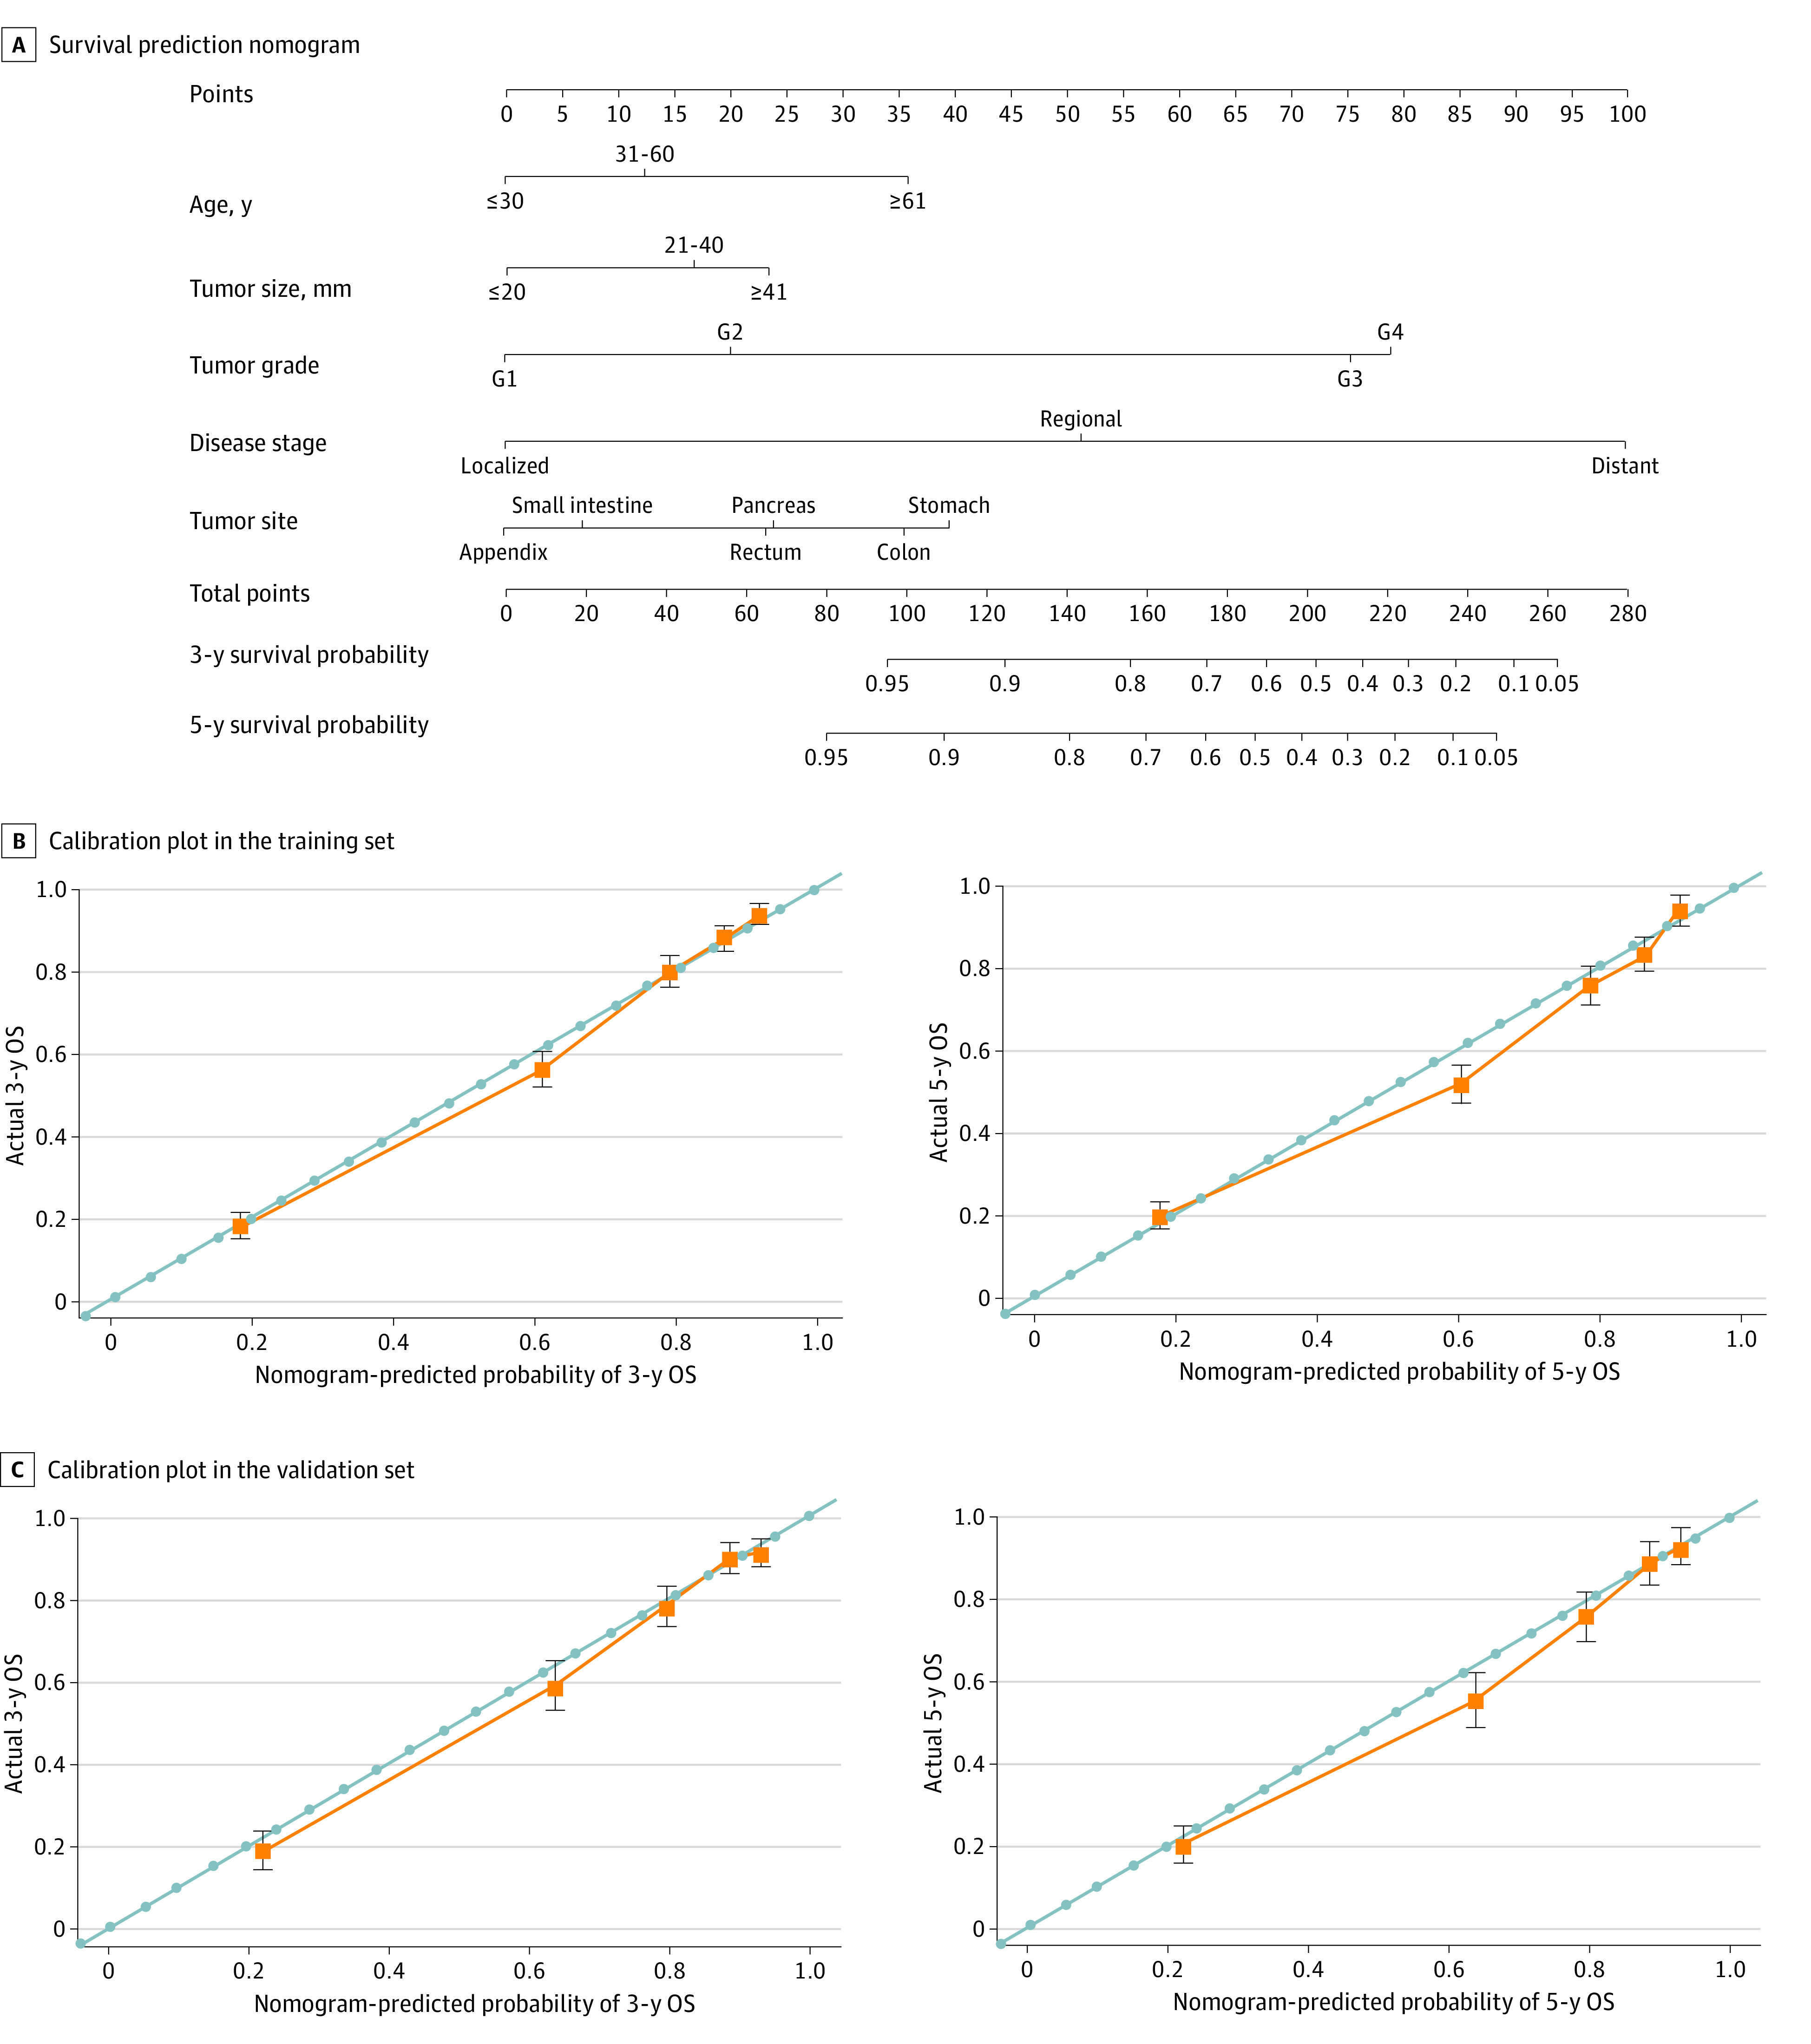
Objectives: To conduct an epidemiologic and survival analysis of the largest cohort of patients with GEP-NETs using the latest data and to establish a novel nomogram to predict the survival probability of individual patients with GEP-NETs.
Design, setting, and participants: In this cohort study, 43 751 patients with GEP-NETs diagnosed from January 1, 1975, to December 31, 2015, were identified from the Surveillance, Epidemiology, and End Results Program. Associated data were used for epidemiologic and survival analysis, as well as the establishment and validation of a nomogram to predict the survival probability of individual patients with GEP-NETs. The study cutoff date was December 31, 2018. Statistical analysis was performed from February 1 to April 30, 2020.
Main outcomes and measures: Incidence, factors associated with overall survival, and a nomogram model for patients with GEP-NETs.
Results: A total of 43 751 patients received a diagnosis of GEP-NETs from 1975 to 2015 (22 398 women [51.2%], 31 976 White patients [73.1%], 7097 Black patients [16.2%], 3207 Asian and Pacific Islander patients [7.3%], 270 American Indian and Alaska Native patients [0.6%], and 4546 patients of unknown race [10.4%]; mean [SD] age at diagnosis, 58 [15] years). The age-adjusted incidence rate of GEP-NETs increased 6.4-fold from 1975 to 2015 (annual percentage change [APC], 4.98; 95% CI, 4.75-5.20; P < .001). Furthermore, among site groups, the incidence of GEP-NETs in the rectum increased most significantly (APC, 6.43; 95% CI, 5.65-7.23; P < .001). As for stage and grade, the incidence increased the most in localized GEP-NETs (APC, 6.53; 95% CI, 6.08-6.97; P < .001) and G1 GEP-NETs (APC, 18.93; 95% CI, 17.44-20.43; P < .001). During the study period, the mean age at diagnosis for localized disease increased by 9.0 years (95% CI, 3.3-14.7 years; P = .002), which remained unchanged for regional and distant cases. On multivariable analyses, age, sex, marital status, and tumor size, grade, stage, and site were significantly associated with overall survival for patients with GEP-NETs (eg, patients with distant vs localized disease: hazard ratio, 10.32; 95% CI, 8.56-12.43; G4 vs G1 GEP-NET: hazard ratio, 6.37; 95% CI, 5.39-7.53). Furthermore, a nomogram comprising age, size, grade, stage, and site was established to predict the 3-year and 5-year survival probability, with the concordance indexes of 0.893 (95% CI, 0.883-0.903) for the internal validations and 0.880 (95% CI, 0.866-0.894) for the external validations. The receiver operating characteristic curve demonstrated that the nomogram exhibited better discrimination power than TNM classification (area under the curve for 3-year overall survival, 0.908 vs 0.795; for 5-year overall survival, 0.893 vs 0.791).
Conclusions and relevance: In this study, the incidence and prevalence of GEP-NETs have continued to increase over 40 years, especially among patients with rectal GEP-NETs. In addition, this study suggests that a nomogram with 5 prognostic parameters may accurately quantify the risk of death among patients with GEP-NETs, indicating that it has satisfactory clinical practicality.
Conflict of interest statement
Figures


References
Publication types
MeSH terms
Supplementary concepts
LinkOut - more resources
Full Text Sources
Other Literature Sources
Medical
Research Materials
Miscellaneous
