Clinical Trial
. 2022 Mar;62(3):385-396.
doi: 10.1002/jcph.1972. Epub 2021 Oct 25.

Prediction of Moxifloxacin Concentrations in Tuberculosis Patient Populations by Physiologically Based Pharmacokinetic Modeling

Affiliations
Clinical Trial

Prediction of Moxifloxacin Concentrations in Tuberculosis Patient Populations by Physiologically Based Pharmacokinetic Modeling

Carlijn H C Litjens et al. J Clin Pharmacol. 2022 Mar.

Abstract

Moxifloxacin has an important role in the treatment of tuberculosis (TB). Unfortunately, coadministration with the cornerstone TB drug rifampicin results in suboptimal plasma exposure. We aimed to gain insight into the moxifloxacin pharmacokinetics and the interaction with rifampicin. Moreover, we provided a mechanistic framework to understand moxifloxacin pharmacokinetics. We developed a physiologically based pharmacokinetic model in Simcyp version 19, with available and newly generated in vitro and in vivo data, to estimate pharmacokinetic parameters of moxifloxacin alone and when administered with rifampicin. By combining these strategies, we illustrate that the role of P-glycoprotein in moxifloxacin transport is limited and implicate MRP2 as transporter of moxifloxacin-glucuronide followed by rapid hydrolysis in the gut. Simulations of multiple dose area under the plasma concentration-time curve (AUC) of moxifloxacin (400 mg once daily) with and without rifampicin (600 mg once daily) were in accordance with clinically observed data (predicted/observed [P/O] ratio of 0.87 and 0.80, respectively). Importantly, increasing the moxifloxacin dose to 600 mg restored the plasma exposure both in actual patients with TB as well as in our simulations. Furthermore, we extrapolated the single dose model to pediatric populations (P/O AUC ratios, 1.04-1.52) and the multiple dose model to children with TB (P/O AUC ratio, 1.51). In conclusion, our combined approach resulted in new insights into moxifloxacin pharmacokinetics and accurate simulations of moxifloxacin exposure with and without rifampicin. Finally, various knowledge gaps were identified, which may be considered as avenues for further physiologically based pharmacokinetic refinement.

Keywords: drug-drug interactions; modeling; moxifloxacin; physiologically based pharmacokinetics; tuberculosis.


Conflict of interest statement

The authors declare no conflicts of interest.

Figures

Figure 1
Figure 1
Work flow of the different validation steps of the moxifloxacin PBPK model in adult and pediatric populations. The type of the different data sources for the development and the human data to which the simulations were validated are described at the right of the figure. IV, intravenous; PBPK, physiologically based pharmacokinetic; TDM, therapeutic drug monitoring.
Figure 2
Figure 2
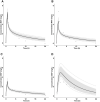
Pharmacokinetic curves of moxifloxacin with and without rifampicin coadministration of in‐house collected therapeutic drug monitoring (TDM) data for 400 mg of moxifloxacin only (A), 400 mg moxifloxacin with any dose of rifampicin (B), and 600 mg of moxifloxacin with any dose of rifampicin (C); median rifampicin dose for both group B and C was 1200 mg once daily (range, 450‐2000 mg). The x‐axis indicates time after last dose. Open circles and crosses indicate measured individual data from in‐house TDM data of patients with Mycobacterium tuberculosis or nontuberculous mycobacteria infections, respectively; the solid black lines indicate the fitted plasma concentration‐time curve using locally estimated scatterplot smoothing regression; and the gray area represents the 95% confidence interval around the regression. AUC0‐24, area under the plasma concentration–time curve from time 0 to 24 hours; Cmax, maximum plasma concentration.
Figure 3
Figure 3
Simulation of moxifloxacin concentration‐time profile after a 400‐mg single oral dose in healthy volunteers. Solid black lines indicate simulation of the mean profile, the gray area represents the 90% confidence interval for interindividual variability, and the dotted lines indicate the minimum and maximum values after simulation. Dots indicate (geometric) mean observed data derived from clinical studies., , , Log‐transformed concentration‐time data are depicted in the right upper corner (0 values were discarded). MXF, moxifloxacin.
Figure 4
Figure 4
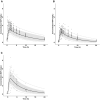
Simulations of moxifloxacin concentration‐time profiles in patients with tuberculosis after multiple doses. The results relate to oral administration of 400 mg of moxifloxacin once daily for 5 days (A), 400 mg of moxifloxacin with 600 mg of rifampicin once daily for 10 days (B), and 600 mg moxifloxacin with 600 mg rifampicin once daily for 10 days (C). The x‐axis indicates time after last dose. Solid black lines indicate simulation of the mean profile, the gray areas represent the 90% confidence interval for interindividual variability, and the dotted lines indicate the minimum and maximum simulation. Open circles and crosses indicate measured individual data from in‐house therapeutic drug monitoring data of patients with Mycobacterium tuberculosis or nontuberculous mycobacteria infections, respectively, and closed circles indicate literature individual data. MXF, moxifloxacin.
Figure 5
Figure 5
Simulations of moxifloxacin concentration‐time profiles in patients with tuberculosis during the first 2 days of combined treatment. The results relate to oral administration of once‐daily 400 mg of moxifloxacin with 600 mg of rifampicin (A), and 800 mg of moxifloxacin with 600 mg of rifampicin (B) during the first 2 days of treatment. The x‐axis indicates time after the last dose. Solid black lines indicate simulation of the mean profile, the gray areas represent the 90% confidence interval for interindividual variability, and the dotted lines indicate the minimum and maximum simulation. Dots indicate measured individual data derived from literature. MXF, moxifloxacin.
Figure 6
Figure 6
Simulations of moxifloxacin concentration‐time profiles in children. Single‐dose 9 mg/kg intravenous (IV) in children between 3 months and <2 years (A), single dose 7 mg/kg IV in children between ≥2 and <6 years (B), single dose 5 mg/kg IV in children between ≥6 and ≤14 years (C), and multiple doses of 10 mg/kg once daily oral in children with multidrug‐resistant tuberculosis between 7 and 15 years for 5 days (D). The x‐axis indicates time after last dose. Solid black lines indicate simulation of the mean profile, the gray area represents the 90% confidence interval for interindividual variability, and the dotted lines indicate the minimum and maximum simulation. Dots indicate measured data (geometric mean [A‐C] and mean [D]) derived from literature., MXF, moxifloxacin.
Figure 7
Figure 7
Overview of ratios between the predicted and observed area under the concentration‐time curve (left) and the maximum concentration (right). Results are presented as mean ratios with range in case of multiple observed values., , , , , , , The solid line at the x‐axis represents no difference between the predicted and observed PK parameters AUC or Cmax (ratio 1.0), the dotted lines represent the bioequivalence range between 0.8 and 1.25 and the dashed lines the range between 0.5 and 2. The y‐axis represents the various dosing regimens in the different (age) groups. AUC, area under the plasma concentration–time curve; AUC0‐∞, area under the plasma concentration–time curve from time 0 to 24 hours; or AUC0‐8, area under the plasma concentration–time curve from time 0 to 8 hours; Cmax, maximum concentration, Rif, rifampicin, TB, tuberculosis, TBM, tuberculous meningitis.
Figure 8
Figure 8
Conceptual overview of moxifloxacin routes of elimination. *Calculated based on considerations and assumptions on the role of UGT1A1. MXF, moxifloxacin; M1, sulfated metabolite; M2, glucuronidated metabolite; UGT1A1, uridine diphosphate‐glucuronosyltransferase 1A1.

References

    1. WHO . Global tuberculosis report 2019. https://www.who.int/tb/publications/global_report/en/. Accessed December 11, 2019.
    1. Tulkens PM, Arvis P, Kruesmann F. Moxifloxacin safety: an analysis of 14 years of clinical data. Drugs R D. 2012;12(2):71‐100. - PMC - PubMed
    1. Soman A, Honeybourne D, Andrews J, Jevons G, Wise R. Concentrations of moxifloxacin in serum and pulmonary compartments following a single 400 mg oral dose in patients undergoing fibre‐optic bronchoscopy. J Antimicrob Chemother. 1999;44(6):835‐838. - PubMed
    1. WHO consolidated guidelines on drug‐resistant tuberculosis treatment. Geneva: World Health Organization; 2019. Licence: CC BY‐NC‐SA 3.0 IGO. - PubMed
    1. Ruslami R, Ganiem AR, Dian S, et al. Intensified regimen containing rifampicin and moxifloxacin for tuberculous meningitis: an open‐label, randomised controlled phase 2 trial. Lancet Infect Dis. 2013;13(1):27‐35. - PubMed

Publication types

MeSH terms