. 2021 Nov 15;131(22):e147849.
doi: 10.1172/JCI147849.

RAF1 amplification drives a subset of bladder tumors and confers sensitivity to MAPK-directed therapeutics

Affiliations

RAF1 amplification drives a subset of bladder tumors and confers sensitivity to MAPK-directed therapeutics

Raie T Bekele et al. J Clin Invest. .

Abstract

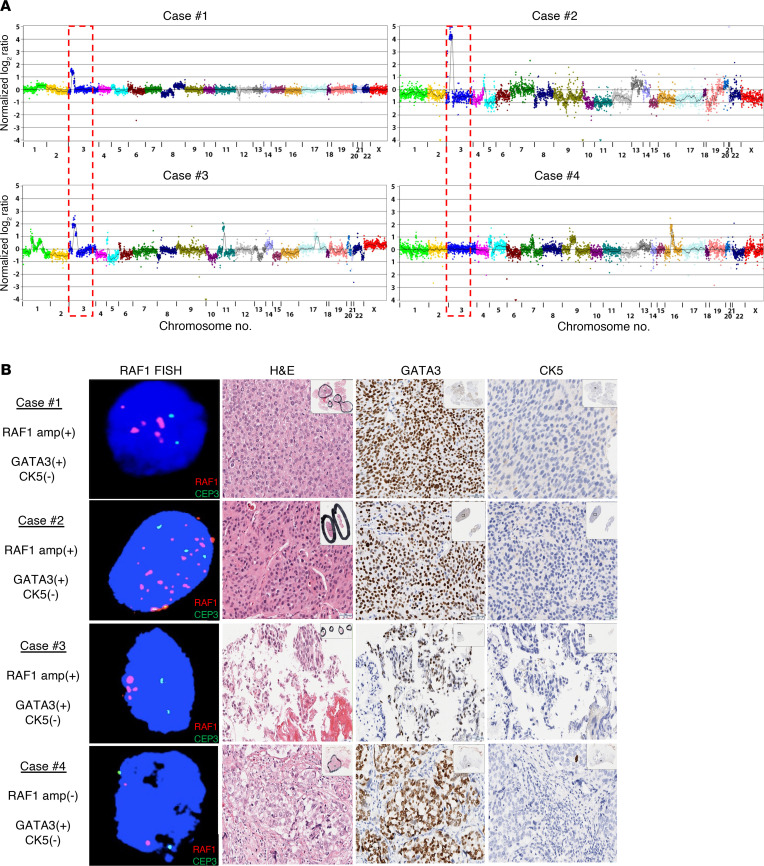
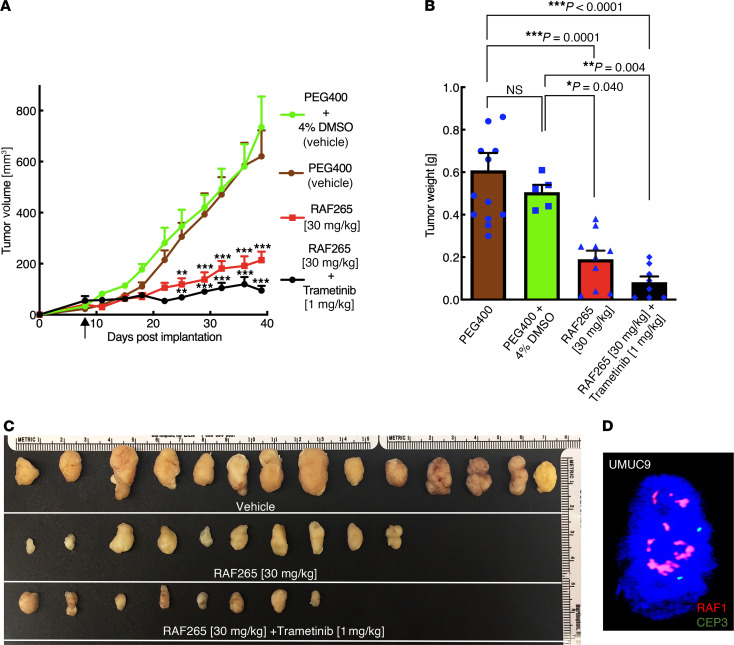
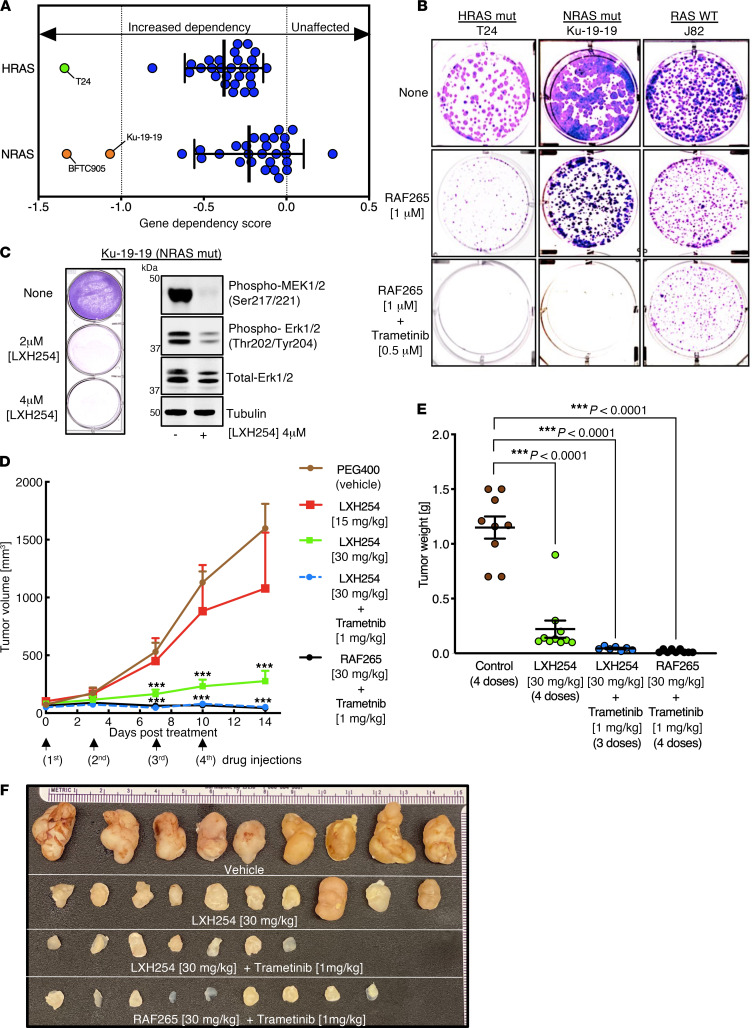
Bladder cancer is a genetically heterogeneous disease, and novel therapeutic strategies are needed to expand treatment options and improve clinical outcomes. Here, we identified a unique subset of urothelial tumors with focal amplification of the RAF1 (CRAF) kinase gene. RAF1-amplified tumors had activation of the RAF/MEK/ERK signaling pathway and exhibited a luminal gene expression pattern. Genetic studies demonstrated that RAF1-amplified tumors were dependent upon RAF1 activity for survival, and RAF1-activated cell lines and patient-derived models were sensitive to available and emerging RAF inhibitors as well as combined RAF plus MEK inhibition. Furthermore, we found that bladder tumors with HRAS- or NRAS-activating mutations were dependent on RAF1-mediated signaling and were sensitive to RAF1-targeted therapy. Together, these data identified RAF1 activation as a dependency in a subset making up nearly 20% of urothelial tumors and suggested that targeting RAF1-mediated signaling represents a rational therapeutic strategy.

Keywords: Cancer; Drug therapy; Oncogenes; Oncology.


Conflict of interest statement

Conflict of interest: J Bellmunt reports stock ownership of Rainier; honoraria from UpToDate; consulting/advising with Pierre Fabre, Astellas, Pfizer, Merck, Genentech (Roche), Novartis, AstraZeneca, MedImmune, and Bristol Myers Squibb; research funding from Millennium, Sanofi, Pfizer, and EMD Serono; and travel reimbursement from Pfizer, MSD Oncology, and Ipsen. DJK reports advising/consulting with Novartis, AADi, and Genentech (Roche) and research support from Genentech (Roche) and Revolution Medicines. GPS reports advising/consulting with Bristol Myers Squibb, Genentech (Roche), EMD Serono, Merck, Sanofi, Seattle Genetics/Astellas, AstraZeneca, Exelixis, Janssen, Bicycle Therapeutics, Pfizer, and Immunomedics; research support from Sanofi, AstraZeneca, and Immunomedics; travel reimbursement from Bristol Myers Squibb and AstraZeneca; speaking fees from Physicians Education Resource, OncLive, Research to Practice, and Medscape; writing fees from UpToDate and Elsevier (editor of Practice Update Bladder Cancer Center of Excellence); and steering committee membership of trials/studies with Bristol Myers Squibb, Bavarian Nordic, Seattle Genetics, and QED (all unpaid) and AstraZeneca, EMD Serono, and Debiopharm (all paid). EMVA reports advising/consulting from Tango Therapeutics, Genome Medical, Invitae, Enara Bio, Janssen, Manifold Bio, and Monte Rosa; research support from Novartis and Bristol Myers Squibb; equity in Tango Therapeutics, Genome Medical, Syapse, Enara Bio, Manifold Bio, Microsoft, and Monte Rosa; travel reimbursement from Genentech (Roche); and institutional patents filed on “Genomic biomarker of response to immunotherapy” (US Patent Application US20170115291A1) and “Methods, systems apparatus, and optimization for effective clinical analysis of cancer genomic data” (US Patent Application WO2015013191A1). KWM reports advising/consulting with Pfizer and EMD Serono and research support from Pfizer.

Figures

Figure 1
Figure 1. RAF1 is focally amplified in a subset of MIBCs.
(A) Frequency of RAF1 amplification across the TCGA pan-cancer cohort. (B) Copy number analysis by GISTIC2 shows recurrent amplifications in the TCGA BLCA cohort. The RAF1 gene is located on chromosome 3p25.2 (q = 7.6031 × 10–36). (C) RAF1 gene expression by RAF1 copy number status in the TCGA BLCA cohort. (D) RAF1 protein expression z score by RAF1 copy number status in the TCGA BLCA cohort. ***P < 0.001, ANOVA with Bonferroni’s post hoc test. (E) Percentages of RAF1-amplified and RAF1 nonamplified tumors from the TCGA BLCA cohort belonging to each of the 6 consensus transcriptional subtypes. (F) Copy number, mutation status, and mRNA expression of select genes from the RAF1-amplified tumors from the TCGA BLCA cohort (n = 52).
Figure 2
Figure 2. Focal amplification and luminal differentiation in RAF1-amplified bladder tumors.
Representative RAF1-amplified (cases 1–3) and RAF1 nonamplified (case 4) bladder tumors from the Dana-Farber Cancer Institute/Brigham and Women’s Cancer Center. (A) For the RAF1-amplified cases, copy number analysis from targeted next-generation sequencing shows focal amplification of the RAF1 locus on chromosome 3 (denoted by red hatched box). (B) FISH analysis using a RAF1-specific probe (red) shows more than 2 RAF1 foci per cell (chromosome 3 centromeric probe [CEP3] shown in green). Tumor H&E and immunohistochemical staining for the luminal marker GATA3 and basal marker CK5 show a staining pattern consistent with luminal differentiation in RAF1-amplified tumors. Original magnification, ×20; insets, ×1 (unmagnified).
Figure 3
Figure 3. RAF1-amplified cell lines are dependent on RAF1 signaling.
(A) RAF1 mRNA expression (x axis) and DNA copy number (y axis) across 36 bladder cancer cell lines from the DepMap identify 2 cell lines (5637 and UMUC9) with high RAF1 levels. (B) RAF1 immunoblot in bladder epithelial and tumor cell lines confirms high levels of RAF1 protein expression in 5637 and UMUC9. (C) RAF1 depletion by siRNA kills RAF1-amplified cell lines, but has minimal effect on bladder cancer cell lines without RAF1 amplification. Unmagnified. NTC, nontargeting control siRNA. (D) Quantification of the relative signal intensity from the viability assay in C. ***P < 0.0001, ANOVA with Bonferroni’s post hoc test. (E) RAF1 depletion by siRNA abrogates RAF/MEK/ERK signaling in RAF1-amplified bladder cancer cell lines, as shown by immunoblot (blots were run in parallel from the same sample). (F) RAF1 gene-dependency scores for bladder cancer cell lines from CRISPR-Cas9 essentiality screens from DepMap (33). A low score indicates a higher likelihood that the gene is essential in a given cell line. RAF1-amplified cell lines (UMUC and 5637) are shown in red, an HRAS mutant cell line (T24) in green, NRAS mutant cell lines (Ku-19-19 and BFTC905) in orange, and a MEK2 mutant cell line (JMSU1) in yellow. Cell lines without alterations in any of these 4 genes are shown in blue. The bottom panel shows the distribution of RAF1 dependency scores across the 29 bladder cancer cell lines analyzed.
Figure 4
Figure 4. RAF1-amplified cell lines are sensitive to RAF and MEK inhibition.
(A) IC50 values for bladder cancer cell lines from the DepMap data set treated with the pan-RAF inhibitor RAF265 (left) or the BRAFV600E inhibitor PLX4720 (right). The RAF1-amplified bladder cancer cell line (5637) is denoted by red arrows. T24 (green) has an HRAS mutation, JMSU1 (yellow) has a MEK2 mutation, and HT-1197 has an NRAS mutation. Sensitivity data for the RAF1-amplified UMUC9 line were not available. (B) Relative cell viability measured by luminescence assay following 3-day treatment with 4 μM RAF265. ***P < 0.0001, ANOVA with Bonferroni’s post hoc test. (C) Heatmap showing viability of UMUC9 (RAF1 amplified) and J82 (RAF1 nonamplified) cells following 3-day treatment with combinations of the pan-RAF inhibitor RAF265 and the MEK inhibitor trametinib. (D) Unmagnified colony-formation assays following treatment of RAF1-amplified cell lines (UMUC9 and 5637) with RAF265 and trametinib show increased sensitivity to combination treatment. (E) Immunoblot shows complete ERK inhibition following treatment with the combination of RAF265 and trametinib in UMUC9 cells.
Figure 5
Figure 5. RAF1-amplified tumors are sensitive to RAF and MEK inhibition in vivo.
(A) Tumor volumes of UMUC9-engrafted mice treated twice weekly with PEG400 vehicle (n = 9 mice), PEG400 with 4% DMSO vehicle (n = 5), RAF265 (n = 10), or RAF265 plus trametinib (n = 8). The black arrow denotes the day of first treatment. Significant differences in average tumor size are denoted by asterisks. **P < 0.005; ***P < 0.0005, ANOVA with Bonferroni’s post hoc test. (B) Mice treated with RAF265 alone or with RAF265 plus trametinib had significantly lower end-of-experiment tumor weights than vehicle-treated mice. Significant differences were calculated by ANOVA with Bonferroni’s post hoc test and are denoted by asterisks. *P < 0.05; **P < 0.005; ***P < 0.0005. (C) Photographs of excised tumors across treatment arms. (D) FISH assay showing RAF1 amplification (red) in UMUC9 tumor xenografts. CEP3 (green) is a chromosome 3 centromeric marker.
Figure 6
Figure 6. A RAF1-amplified PDX is sensitive to RAF plus MEK inhibition.
(A) H&E and IHC staining for RAF1, the luminal differentiation marker GATA3, and the basal differentiation marker CK5 in a RAF1-amplified PDX tumor show strong RAF1 staining in tumor cells as well as GATA3 staining consistent with a luminal phenotype. Original magnification, ×20 ((H&E, GATA3 and CK5); ×40 (RAF1). (B) Tumor volume measurements for RAF1-amplified PDX-bearing mice randomized to RAF265 plus trametinib versus no treatment. Significant differences in average tumor size between treated and untreated arms are denoted with asterisks.*P < 0.05; **P < 0.005; ***P < 0.0005, unpaired 2-tailed Student’s t test. (C) Kaplan-Meier survival curves showing percentage of surviving mice in the RAF265 plus trametinib versus untreated arms. Asterisks denote statistical significance by log-rank (Mantel-Cox) test. (D) Photographs of excised tumors from all mice in both arms. (E) The average end-of-experiment tumor weight was significantly lower in the RAF265 plus trametinib–treated mice compared with the untreated mice. Asterisks denote statistical significance by unpaired 2-tailed Student’s t test.
Figure 7
Figure 7. HRAS and NRAS mutant bladder cancer cell lines are sensitive to RAF-targeted therapies.
(A) HRAS and NRAS gene-dependency scores from DepMap CRISPR-Cas9 essentiality screens confirm that the HRAS (G12V) mutant T24 bladder cancer cell line shown in green and the NRAS mutant Ku-19-19 (NRAS Q61R) and BFTC905 (NRAS Q61L) bladder cancer cell lines shown in orange are dependent on the mutant RAS mutation for survival. (B) Unmagnified colony-formation assays demonstrate increased sensitivity to RAF265 and RAF265 plus trametinib in HRAS-mutant T24 cells and NRAS-mutant Ku-19-19 cells compared with the RAS WT J82 cell line. (C) Crystal violet staining of Ku-19-19 cells 3 days following treatment with LXH254 (left) and immunoblot (blots were run in parallel from the same sample) showing LXH254-induced inhibition of RAF/MEK/ERK signaling (right). (D) Tumor volumes of Ku-19-19–engrafted mice treated twice weekly with PEG400 vehicle (n = 9 mice), 15 mg/kg LXH256 (n = 5), 30 mg/kg LXH256 (n = 10), 30 mg/kg LXH254 plus 1 mg/kg trametinib (n = 7), or 30 mg/kg RAF265 plus 1 mg/kg trametinib (n = 9). (E) Average end-of-experiment tumor weights for mice treated with vehicle, 30 mg/kg LXH254, 30 mg/kg LXH254 plus 1 mg/kg trametinib, or 30 mg/kg RAF265 plus 1 mg/kg trametinib. Average tumor weights were significantly lower in all treatment arms compared with those of vehicle-treated tumors. Significant differences in average tumor size and weight in the treatment groups compared with vehicle are denoted with asterisks. ***P < 0.0001, ANOVA with Bonferroni’s post hoc test. (F) Photographs of excised tumors.

Comment in

References

    1. Siegel RL, et al. Cancer statistics, 2020. CA Cancer J Clin. 2020;70(1):7–30. doi: 10.3322/caac.21590. - DOI - PubMed
    1. Robertson AG, et al. Comprehensive molecular characterization of muscle-invasive bladder cancer. Cell. 2017;171(3):540–556. doi: 10.1016/j.cell.2017.09.007. - DOI - PMC - PubMed
    1. Kamoun A, et al. A consensus molecular classification of muscle-invasive bladder cancer. Eur Urol. 2020;77(4):420–433. doi: 10.1016/j.eururo.2019.09.006. - DOI - PMC - PubMed
    1. Powles T, et al. Avelumab maintenance therapy for advanced or metastatic urothelial carcinoma. N Engl J Med. 2020;383(13):1218–1230. doi: 10.1056/NEJMoa2002788. - DOI - PubMed
    1. Bellmunt J, et al. Pembrolizumab as second-line therapy for advanced urothelial carcinoma. N Engl J Med. 2017;376(11):1015–1026. doi: 10.1056/NEJMoa1613683. - DOI - PMC - PubMed

Publication types

MeSH terms

LinkOut - more resources