

Looking for more reliable biomarkers in breast cancer: Comparison between routine methods and RT-qPCR
- PMID: 34555047
- PMCID: PMC8460001
- DOI: 10.1371/journal.pone.0255580
Looking for more reliable biomarkers in breast cancer: Comparison between routine methods and RT-qPCR
Abstract
Purpose: Decades of quality control efforts have raised the standards of immunohistochemistry (IHC), the principle method used for biomarker testing in breast cancer; however, computational pathology and reverse transcription quantitative PCR (RT-qPCR) may also hold promise for additional substantial improvements.
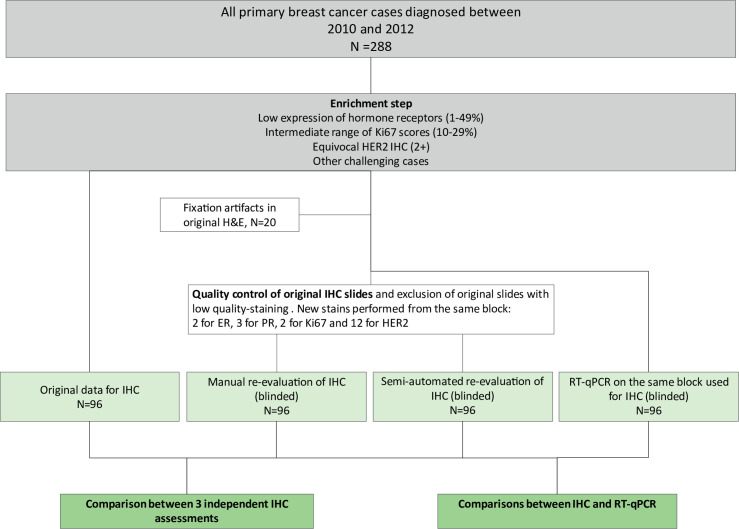
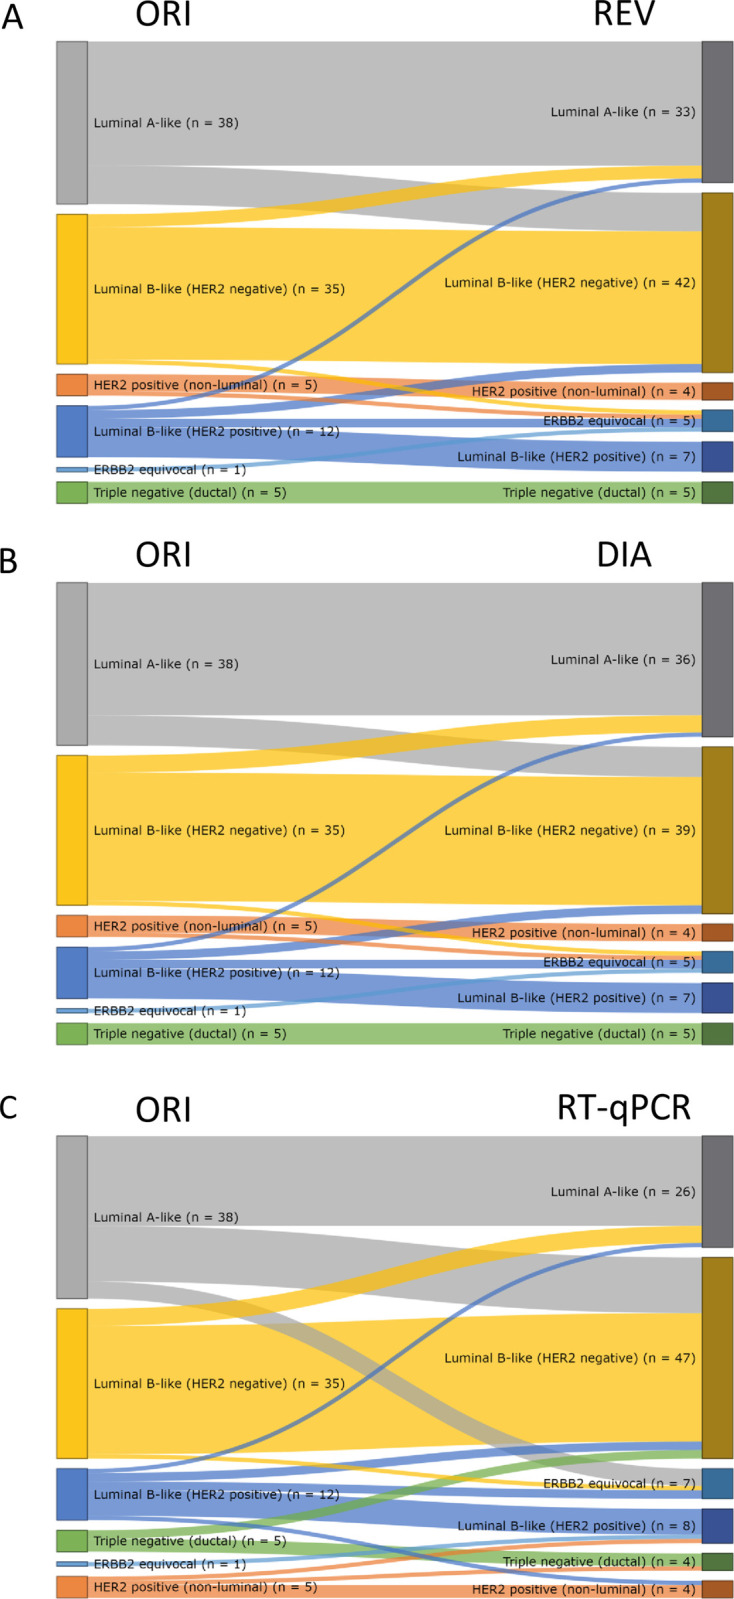
Methods: Herein, we investigated discrepancies in the assessment of estrogen receptor (ER), progesterone receptor (PR), human epidermal growth factor receptor 2 (HER2) and marker of proliferation Ki67 comparing routinely obtained IHC (and FISH) data (ORI) with the results of manual (REV) and semi-automated (DIA) re-evaluation of the original IHC slides and then with RNA expression data from the same tissue block using the MammaTyper® (MT) gene expression assay.
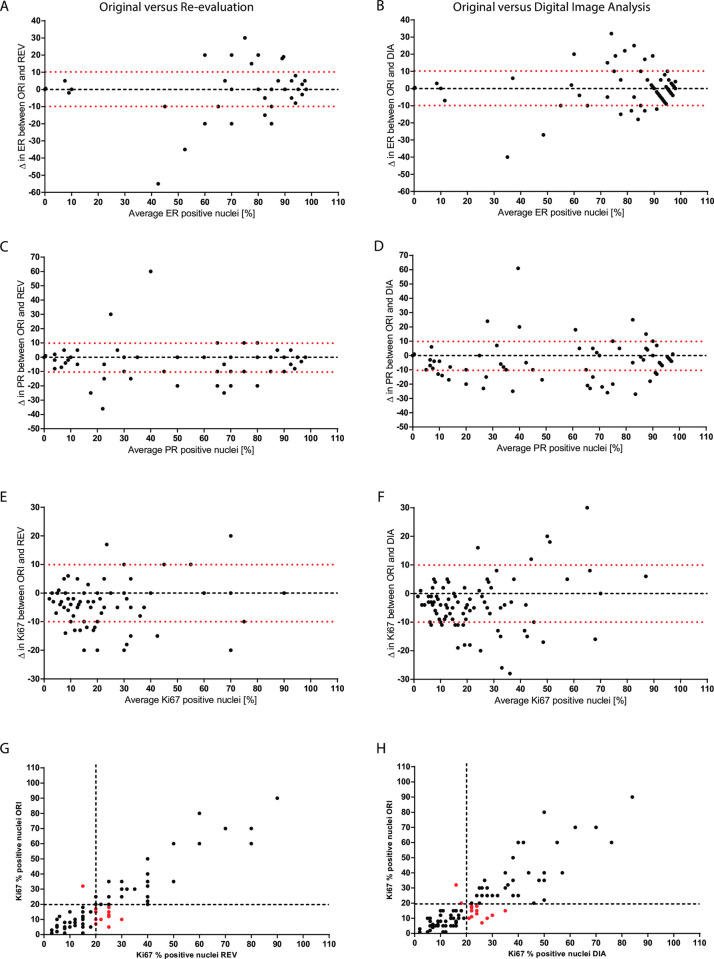
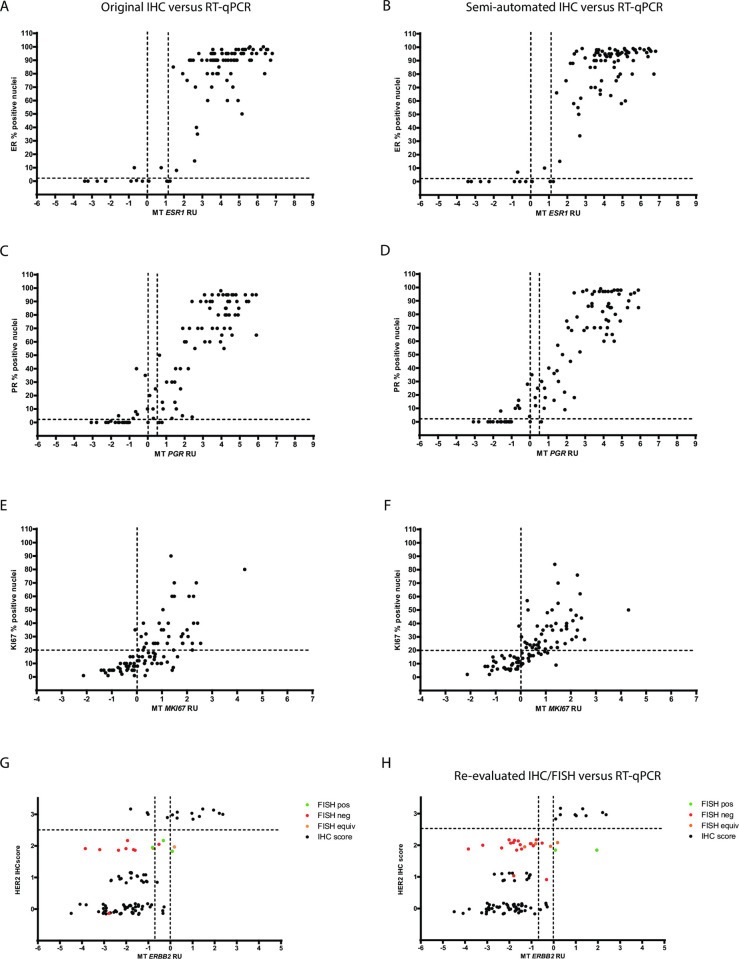
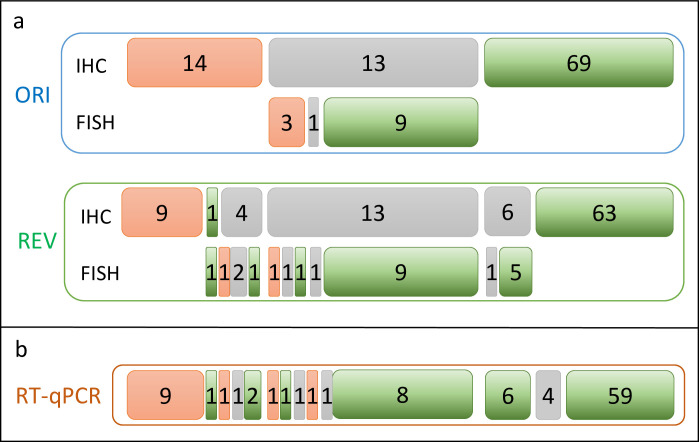
Results: Correlation for ER and PR was high between ORI IHC and the other three study methods (REV, DIA and RT-qPCR). For HER2, 10 out of 96 discrepant cases can be detected between ORI and REV that involved at least one call in the equivocal category (except for one case). For Ki67, 22 (29.1%) cases were categorized differently by either REV alone (n = 17), DIA alone (n = 15) or both (n = 10) and 28 cases (29.2%) for RT-qPCR. Most of the discrepant Ki67 cases changed from low to high between the original and following assessment and belonged to the intermediate Ki67 expression range (between 9 and 30%).
Conclusions: Determination of the breast cancer biomarkers ER, PR, HER2 and Ki67 at the mRNA level shows high degree of correlation with IHC and compares well with correlations between original with subsequent independent manual or semi-automated IHC assessments. The use of methods with wider dynamic range and higher reproducibility such as RT-qPCR may offer more precise assessment of endocrine responsiveness, improve Ki67 standardization and help resolve HER2 cases that remain equivocal or ambiguous by IHC/FISH. In summary, our findings seem to configure RT-qPCR as a complementary method to be used in cases of either equivocal results or presenting, at the traditional determination assays, biomarkers expressions close to the cut-off values.
Conflict of interest statement
Kerstin Hartmann, Mark Laible, Ugur Sahin: Salary and stock ownership BioNTech Diagnostics GmbH / BioNTech AG. These commercial affiliations do not alter our adherence to PLOS ONE policies on sharing data and materials. Mark Laible: Patent ownership of WO 2015/024942, Commercialized as MammaTyper (TM) Kit. The other authors declare that they have no conflict of interest.
Figures
References
-
- Wolff AC, Hammond ME, Schwartz JN, Hagerty KL, Allred DC, Cote RJ, et al.. American Society of Clinical Oncology/College of American Pathologists guideline recommendations for human epidermal growth factor receptor 2 testing in breast cancer. J Clin Oncol. 2007;25(1):118–45. doi: 10.1200/JCO.2006.09.2775 - DOI - PubMed
-
- Wolff AC, Hammond ME, Hicks DG, Dowsett M, McShane LM, Allison KH, et al.. Recommendations for human epidermal growth factor receptor 2 testing in breast cancer: American Society of Clinical Oncology/College of American Pathologists clinical practice guideline update. J Clin Oncol. 2013;31(31):3997–4013. doi: 10.1200/JCO.2013.50.9984 - DOI - PubMed
-
- Wolff AC, Hammond MEH, Allison KH, Harvey BE, Mangu PB, Bartlett JMS, et al.. Human Epidermal Growth Factor Receptor 2 Testing in Breast Cancer: American Society of Clinical Oncology/College of American Pathologists Clinical Practice Guideline Focused Update. J Clin Oncol. 2018;36(20):2105–22. doi: 10.1200/JCO.2018.77.8738 - DOI - PubMed
Publication types
MeSH terms
Substances
LinkOut - more resources
Full Text Sources
Medical
Research Materials
Miscellaneous
