

Severe acute respiratory syndrome coronavirus 2 (SARS-CoV-2) seroprevalence: Navigating the absence of a gold standard
- PMID: 34555095
- PMCID: PMC8459951
- DOI: 10.1371/journal.pone.0257743
Severe acute respiratory syndrome coronavirus 2 (SARS-CoV-2) seroprevalence: Navigating the absence of a gold standard
Abstract
Background: Severe acute respiratory syndrome coronavirus 2 (SARS-CoV-2) seroprevalence studies bridge the gap left from case detection, to estimate the true burden of the COVID-19 pandemic. While multiple anti-SARS-CoV-2 immunoassays are available, no gold standard exists.
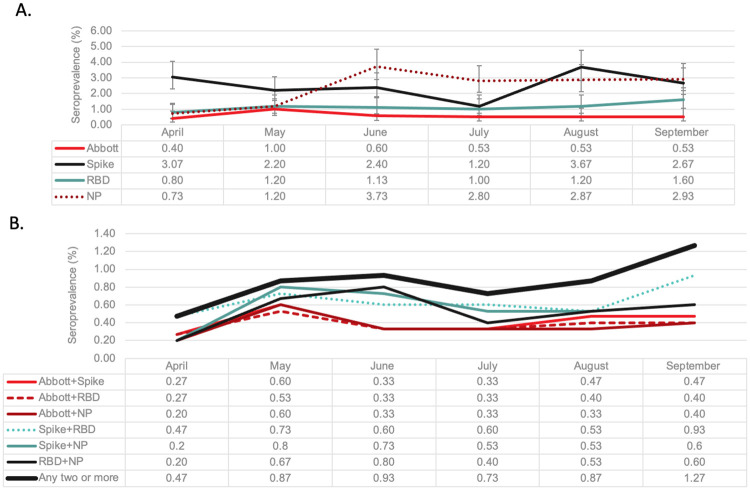
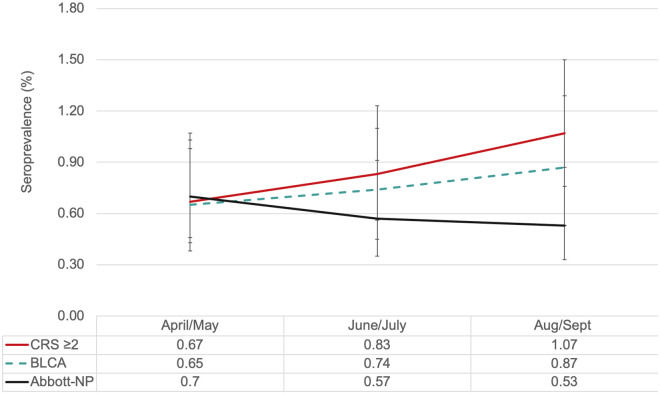
Methods: This serial cross-sectional study was conducted using plasma samples from 8999 healthy blood donors between April-September 2020. Each sample was tested by four assays: Abbott SARS-Cov-2 IgG assay, targeting nucleocapsid (Abbott-NP) and three in-house IgG ELISA assays (targeting spike glycoprotein, receptor binding domain, and nucleocapsid). Seroprevalence rates were compared using multiple composite reference standards and by a series of Bayesian Latent Class Models.
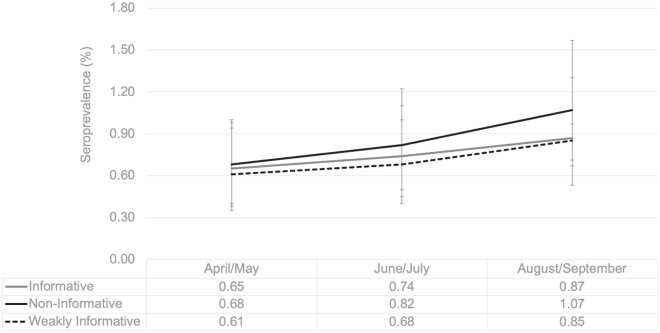
Result: We found 13 unique diagnostic phenotypes; only 32 samples (0.4%) were positive by all assays. None of the individual assays resulted in seroprevalence increasing monotonically over time. In contrast, by using the results from all assays, the Bayesian Latent Class Model with informative priors predicted seroprevalence increased from 0.7% (95% credible interval (95% CrI); 0.4, 1.0%) in April/May to 0.7% (95% CrI 0.5, 1.1%) in June/July to 0.9% (95% CrI 0.5, 1.3) in August/September. Assay characteristics varied over time. Overall Spike had the highest sensitivity (93.5% (95% CrI 88.7, 97.3%), while the sensitivity of the Abbott-NP assay waned from 77.3% (95% CrI 58.7, 92.5%) in April/May to 64.4% (95% CrI 45.6, 83.0) by August/September.
Discussion: Our results confirmed very low seroprevalence after the first wave in Canada. Given the dynamic nature of this pandemic, Bayesian Latent Class Models can be used to correct for imperfect test characteristics and waning IgG antibody signals.
Conflict of interest statement
Steven J Drews has acted as a content expert for respiratory viruses for Johnson & Johnson (Janssen). Anne-Claude Gingras receives funds from a research contract with Providence Therapeutics Holdings, Inc. The remaining authors have no conflicts of interest to disclose. This does not alter our adherence to PLOS ONE policies on sharing data and materials.
Figures
References
-
- World Health Organization. Coronavirus (COVID-19) Dashboard | WHO Coronavirus (COVID-19) Dashboard with Vaccination Data. [Cited 2021 May 7] https://covid19.who.int.
-
- Ward MD, Mullins KE, Pickett E, Merrill V, Ruiz M, Rebuck H, et al. Performance of four automated SARS-CoV-2 serology assay platforms in a large cohort including susceptible COVID-19 negative and COVID-19 positive patients. J Appl Lab Med. 2021; 6(4) 942–952. doi: 10.1093/jalm/jfab014 - DOI - PMC - PubMed
Publication types
MeSH terms
Substances
LinkOut - more resources
Full Text Sources
Medical
Miscellaneous
