. 2022 Apr 1;24(4):571-581.
doi: 10.1093/neuonc/noab227.

Impact of the methylation classifier and ancillary methods on CNS tumor diagnostics

Affiliations

Impact of the methylation classifier and ancillary methods on CNS tumor diagnostics

Zhichao Wu et al. Neuro Oncol. .

Abstract

Background: Accurate CNS tumor diagnosis can be challenging, and methylation profiling can serve as an adjunct to classify diagnostically difficult cases.

Methods: An integrated diagnostic approach was employed for a consecutive series of 1258 surgical neuropathology samples obtained primarily in a consultation practice over 2-year period. DNA methylation profiling and classification using the DKFZ/Heidelberg CNS tumor classifier was performed, as well as unsupervised analyses of methylation data. Ancillary testing, where relevant, was performed.

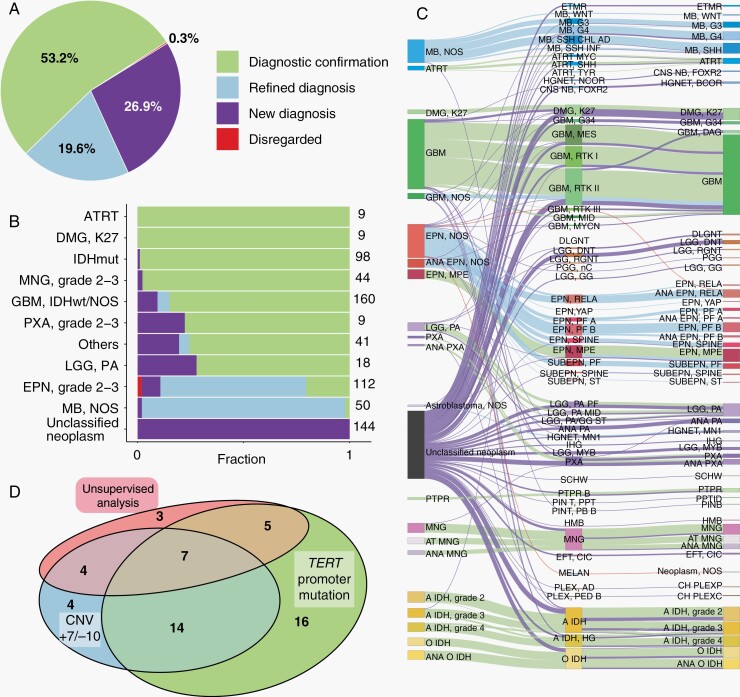
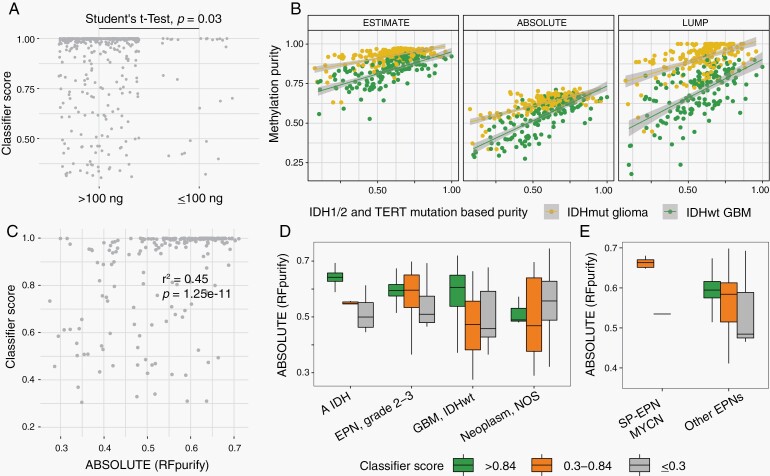
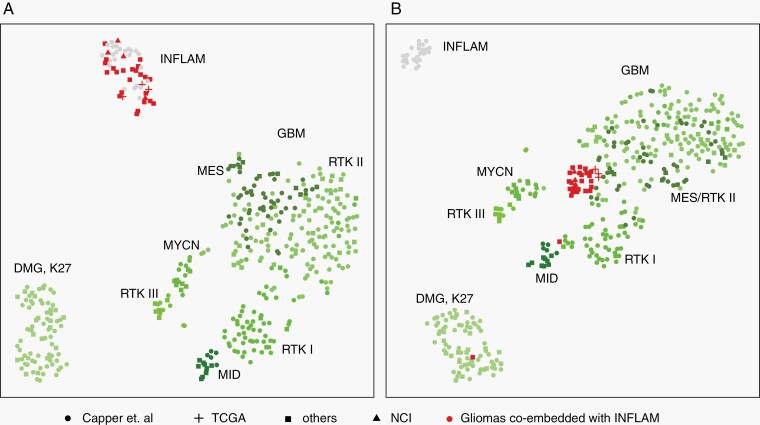
Results: Among the received cases in consultation, a high-confidence methylation classifier score (>0.84) was reached in 66.4% of cases. The classifier impacted the diagnosis in 46.7% of these high-confidence classifier score cases, including a substantially new diagnosis in 26.9% cases. Among the 289 cases received with only a descriptive diagnosis, methylation was able to resolve approximately half (144, 49.8%) with high-confidence scores. Additional methods were able to resolve diagnostic uncertainty in 41.6% of the low-score cases. Tumor purity was significantly associated with classifier score (P = 1.15e-11). Deconvolution demonstrated that suspected glioblastomas (GBMs) matching as control/inflammatory brain tissue could be resolved into GBM methylation profiles, which provided a proof-of-concept approach to resolve tumor classification in the setting of low tumor purity.

Conclusions: This work assesses the impact of a methylation classifier and additional methods in a consultative practice by defining the proportions with concordant vs change in diagnosis in a set of diagnostically challenging CNS tumors. We address approaches to low-confidence scores and confounding issues of low tumor purity.

Keywords: DNA methylation profile; brain tumor classification; deconvolution; neuropathology; tumor purity.


Figures

Fig. 1
Fig. 1
Impact of methylation classifier on CNS tumor diagnosis. (a) The impact of methylation profiling on 694 high-score referral cases is shown proportionally as: Diagnostic confirmation (light green); Refined diagnosis (light blue); New diagnosis (purple); and Disregarded (red). (b) Impact of the classifier across different histopathologically diagnosed tumor types. From top to bottom: 9 atypical teratoid/rhabdoid tumors (ATRT), 9 K27M mutated diffuse midline gliomas (DMG-K27), 98 IDH-mutant gliomas (IDHmut), 44 meningiomas (MNG), 160 glioblastomas (GBM) or GBM-NOS, 9 pleomorphic xanthoastrocytomas (PXA), 41 less common tumors (Others, other tumors with <6 samples in this cohort), 18 pilocytic astrocytomas (LGG-PA), 112 WHO grade 2-3 ependymomas (EPN, grade 2-3), 50 medulloblastoma-NOS (MB-NOS), and 144 unclassified neoplasm. (c) Sankey diagram illustrating the diagnosis of the high-score cases. From left to right are pre-classifier diagnosis, methylation classification, and final integrated diagnosis. Lines are colored by classifier impact. (d) Venn diagram showing the utilization of additional methods used for GBM diagnosis.
Fig. 2
Fig. 2
Nearest-neighbor assisted unsupervised interrogation of the current cohort cases. (a) T-distributed stochastic neighbor embedding (t-SNE) analysis of in-house 1258 cases together projected on Capper et al. 2801 samples (reference set). Reference tumors are shown in gray dots, the 1258 consultative cases are colored by final integrated diagnosis of tumor entities and shaped by their classifier scores: high-confidence scores >0.84 (square), suggestive scores between 0.3 and 0.84 (triangle), and not contributary scores <0.3 (cross). (b–d) Case study of low classification score cases Q727 (b) and P644 (c) as well as tumor of a class that is absent from the classifier: spinal ependymoma with MYCN amplification (SP-EPN-MYCN) (d).
Fig. 3
Fig. 3
Unsupervised analysis of the methylation-profiled cohort. (a) t-SNE analysis of 1258 methylation-profiled tumor cases colored by final diagnosis and shaped by classification scores as indicated in Figure 2a. (b) The classifier scores of the cases diagnosed as DMG-K27 tumors in 2 groups: classic DMG-K27 and AP-like DMG-K27. (c) Cluster heatmap of in-house 18 ANA-PA and 31 DMG-K27 tumors indicating 2 groups of DMG-K27. Tumor types are colored on the top of heatmap, light green: DMG-K27, purple: ANA-PA. (d) H&E stains of Y132, Y217, and Y129 with 25 µm scale bars on bottom left (e) CNV plots on chromosome 13 revealing the common RB1 loss in Y132, Y217, and Y129.
Fig. 4
Fig. 4
Tumor purity is significantly associated with classifier classification confidence score. (a) Comparison of the classifier classification score with the DNA input amount used for methylation profiling. (b) Comparison of IDH1/2 and TERT mutation allele/variant frequency-based tumor purity with 3 methylation-based tumor purity estimation methods from RF_purity in IDH-mutated gliomas and TERT-mutated glioblastomas. (c) Correlation of the tumor purity and the classifier classification score in pre-classifier GBMs. Tumor purity is estimated using RF_purity-ABSOLUTE method. (d) Tumor purity in different classification score groups across different tumor entities. (e) Tumor purity and classifier score groups of the recently discovered spinal ependymoma with MYCN amplification subtype (SP-EPN-MYCN), which is unrepresented in the classifier, compared with other ependymoma subtypes represented in the classifier.
Fig. 5
Fig. 5
Tumor purity adjustment for inflammatory infiltrated gliomas improved tumor classification. (a) t-SNE plot of GBM, DMG-K27, control inflammatory tissue (INFLAM, gray dots), and a collection of gliomas co-embedded with inflammatory tissue (red) before (a) and after (b) tumor purity adjustment. Tumor purity was adjusted using the InfiniumPurify R package. Circle dot, cross, square, and triangle represent samples from Capper et al, TCGA, other public resources and our in-house samples (Supplementary Table S3).

Comment in

References

    1. Byun HM, Siegmund KD, Pan F, et al. Epigenetic profiling of somatic tissues from human autopsy specimens identifies tissue- and individual-specific DNA methylation patterns. Hum Mol Genet. 2009;18(24):4808–4817. - PMC - PubMed
    1. Nagae G, Isagawa T, Shiraki N, et al. Tissue-specific demethylation in CpG-poor promoters during cellular differentiation. Hum Mol Genet. 2011;20(14):2710–2721. - PubMed
    1. Yuen RK, Neumann SM, Fok AK, et al. Extensive epigenetic reprogramming in human somatic tissues between fetus and adult. Epigenetics Chromatin. 2011;4:7. - PMC - PubMed
    1. Fernandez AF, Assenov Y, Martin-Subero JI, et al. A DNA methylation fingerprint of 1628 human samples. Genome Res. 2012;22(2):407–419. - PMC - PubMed
    1. Noushmehr H, Weisenberger DJ, Diefes K, et al. ; Cancer Genome Atlas Research Network . Identification of a CpG island methylator phenotype that defines a distinct subgroup of glioma. Cancer Cell. 2010;17(5):510–522. - PMC - PubMed

Publication types

MeSH terms