. 2021 Oct 12;54(10):2256-2272.e6.
doi: 10.1016/j.immuni.2021.08.028. Epub 2021 Sep 22.

Follicular dendritic cells restrict interleukin-4 availability in germinal centers and foster memory B cell generation

Affiliations

Follicular dendritic cells restrict interleukin-4 availability in germinal centers and foster memory B cell generation

Lihui Duan et al. Immunity. .

Abstract

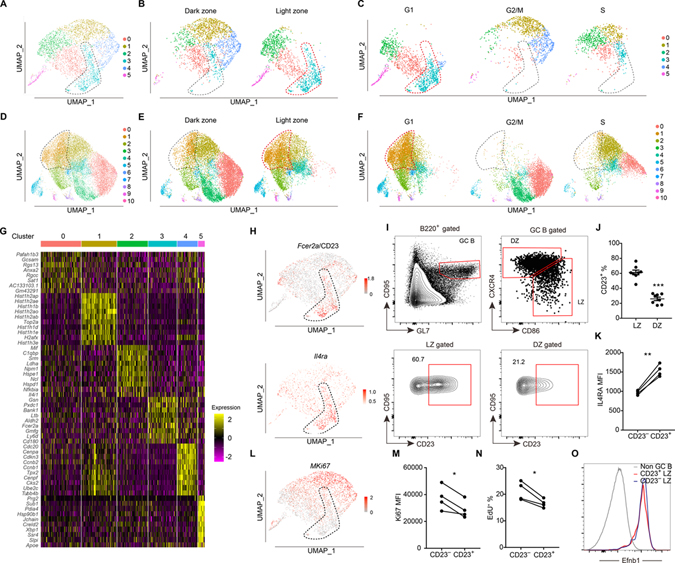
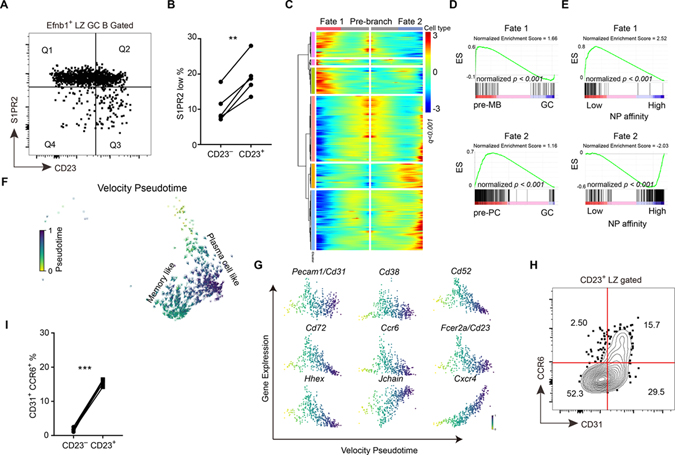
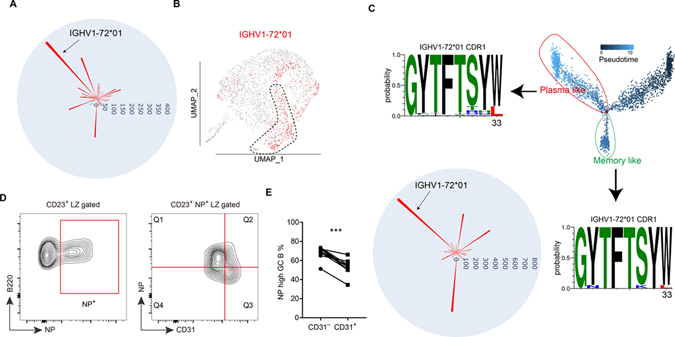
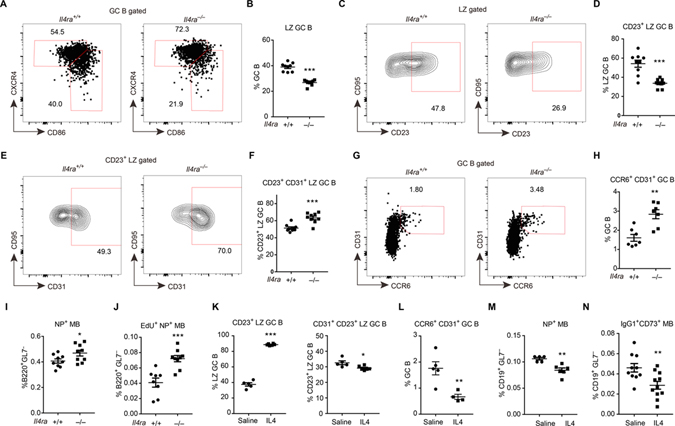
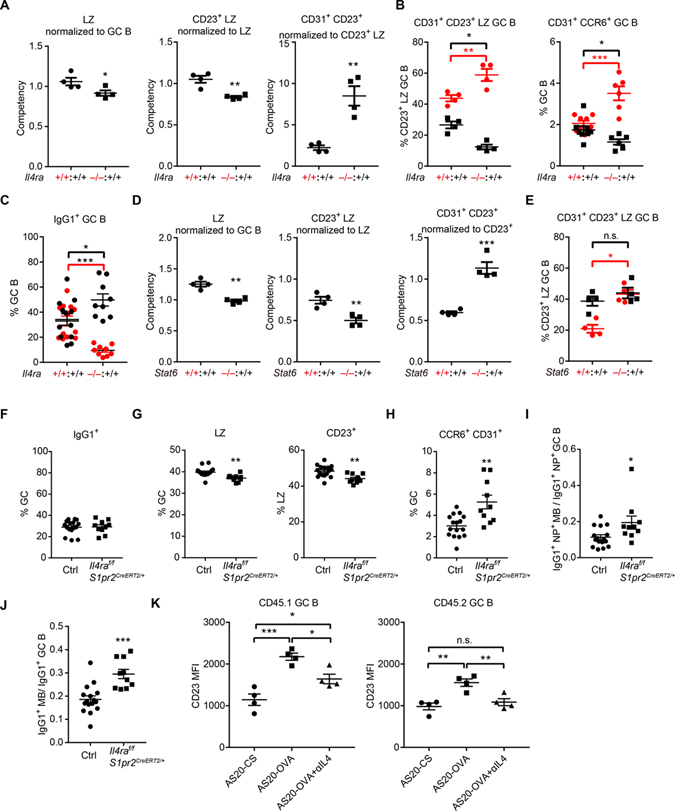
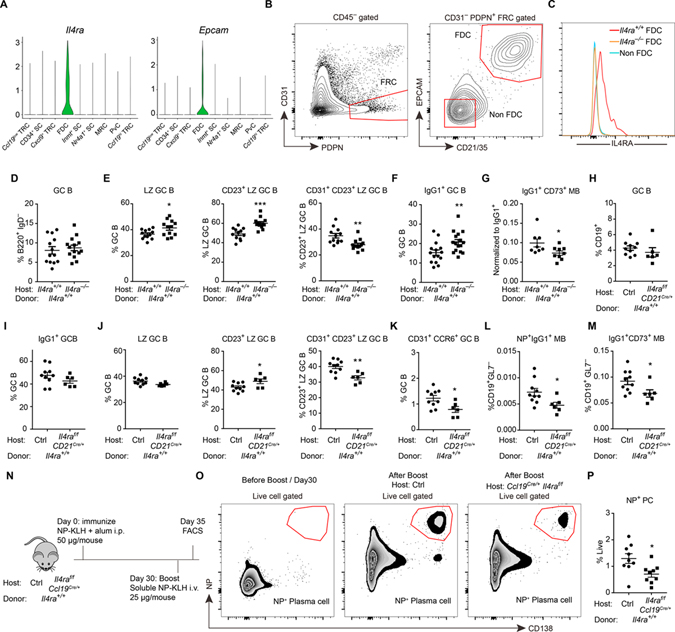
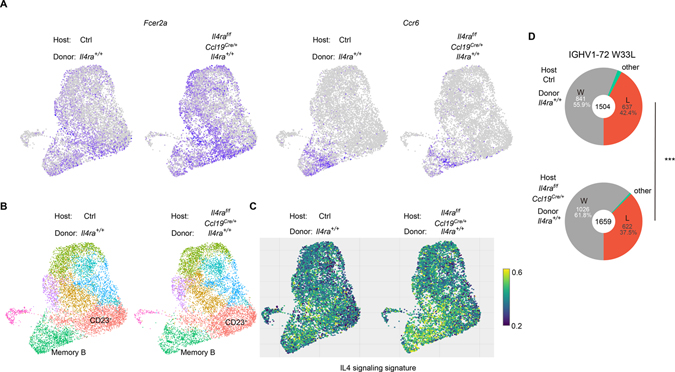
B cells within germinal centers (GCs) enter cycles of antibody affinity maturation or exit the GC as memory cells or plasma cells. Here, we examined the contribution of interleukin (IL)-4 on B cell fate decisions in the GC. Single-cell RNA-sequencing identified a subset of light zone GC B cells expressing high IL-4 receptor-a (IL4Ra) and CD23 and lacking a Myc-associated signature. These cells could differentiate into pre-memory cells. B cell-specific deletion of IL4Ra or STAT6 favored the pre-memory cell trajectory, and provision of exogenous IL-4 in a wild-type context reduced pre-memory cell frequencies. IL-4 acted during antigen-specific interactions but also influenced bystander cells. Deletion of IL4Ra from follicular dendritic cells (FDCs) increased the availability of IL-4 in the GC, impaired the selection of affinity-matured B cells, and reduced memory cell generation. We propose that GC FDCs establish a niche that limits bystander IL-4 activity, focusing IL-4 action on B cells undergoing selection and enhancing memory cell differentiation.

Keywords: IL-4; affinity maturation; follicular dendritic cells; germinal center; memory B cells; scRNA-seq; scVDJ-seq.


Conflict of interest statement

Declaration of interests J.G.C. is an Scientific Advisory Board member of Be Biopharma and MiroBio.

Figures

Figure 1.
Figure 1.. Identification of a CD23+ LZ GC B cell subset by scRNA-seq
(A-C) UMAP plots of sorted B220+ CD38 GL7hi IgD GC B cells at day 7 post-immunization (A), split between LZ and DZ (B) and split among different cell cycle phases (C). (D-F) UMAP plots of sorted B220+ CD95hi GL7hi IgD GC B cells at day 14 post-immunization (D), split between LZ and DZ (E) and split among different cell cycle phases (F). Each point is a single cell colored by cluster assignment. (G) Top 10 marker genes distinguishing the different clusters of GC cells detected at day 7. (H) Expression of Fcer2a (CD23) and Il4ra in the day 7 dataset projected onto UMAP plots. Color scaled for each gene with log normalized expression level. (I, J) Representative FACS profiles (I) and frequencies of CD23+ subset (J) in LZ (CXCR4lo CD86hi) and DZ (CXCR4hi CD86lo) GC B cells 12–14 days after immunization. Each symbol represents one mouse. Data are pooled from two experiments. (K) Geometric mean fluorescence intensity (MFI) of IL4Ra in CD23 and CD23+ LZ GC B cells at day 13 following NP-KLH immunization. (L) Expression of Mki67 from day 7 GC B cell dataset projected onto UMAP plots. (M) MFI of Ki67 in CD23 and CD23+ LZ GC B cells at day 13 following NP-KLH immunization. One of two experiments with similar result is shown. (N) Frequencies of EdU+ cells in CD23+ and CD23 LZ GC B cells after 1 hour EdU labeling. In K, M, N each symbol represents one mouse, each line represents the same mouse, and one of two experiments with similar results is shown. (O) Representative histograms of Efnb1 (Ephrin B1) in non-GC B cells (B220+ CD95lo GL7lo), CD23+ and CD23 LZ GC B cells 12–14 days after immunization. Data represent three experiments, with at least 3 mice per experiment. See also Figure S1 and Table S1. In this and all subsequent figures, data are presented as mean ± SEM; n.s., not significant, *P < 0.05, **P < 0.01, ***P < 0.001.
Figure 2.
Figure 2.. CD23+ LZ B cells can differentiate into pre-memory cells
(A, B) S1pr2Venus/+ reporter mice were immunized with NP-haptenated antigen. (A) Representative FACS profile displaying gates between CD23 and S1PR2 in EFNB1+ LZ GC B cells. (B) Percentages of S1PR2lo cells in CD23+ or CD23 amongst Efnb1+ LZ GC B cells. ** P<0.01. (C) Heatmap of differentially expressed genes between cell fate 1 and cell fate 2 within cluster 3 of day 7 LZ GC B cell dataset by RNA trajectory pseudotime analysis. Colored bars on side indicate groups of similarly expressed genes (all genes were listed in Table S3). (D) GSEA analysis of differentially expressed genes from the two cell fates compared to pre-memory B cell (Wang et al., 2017) and pre-plasma cell (Ise et al., 2018) RNA sequencing datasets. Enrichment profiles for cell fate 1 compared with pre-memory (upper) and cell fate 2 compared with pre-plasma cell (lower). (E) GSEA of differentially expressed genes from different cell fates compared to RNA sequencing dataset of different NP affinity GC B cells (Shinnakasu et al., 2016). Enrichment profiles for cell fate 1 compared with low-affinity (upper) and cell fate 2 compared with high-affinity (lower). ES represents enrichment score. (F) RNA velocity pseudotime analysis for CD23+ LZ GC B cells are embedded in a UMAP plot. Color represents the velocity pseudotime. (G) Expression level of genes of interest along the velocity pseudotime. Color represents the velocity pseudotime. Determined using scVelo. (H) Representative FACS profile displaying gates between CD31 and CCR6 in CD23+ LZ GC B cells 12–14 days after immunization. Data are representative of two experiments, with at least 3 mice per experiment. (I) Percentages of CD31+CCR6+ cells in CD23 and CD23+ LZ GC B cells on day 13 after immunization. In B and I each symbol represents one mouse, and each line represents the same mouse. *** P<0.001. See also Figure S2 and Table S3.
Figure 3.
Figure 3.. Single cell VDJ-seq analysis reveals selected heavy chain gene enrichment in CD23+ LZ cells
(A) Circular bar plot shows the cell number of each heavy chain gene detected by scVDJ-seq of day 7 GC B cells. (B) UMAP plot of the distribution of NP specific heavy chain (IGHV1-72*01) in different clusters of day 7 GC B cells. (C) Sequence logos of IGHV1-72*01 CDR1 of plasma like cells and memory like B cells divided by pseudotime analysis. Circular bar plot shows the cell number of each heavy chain gene detected by the scVDJ-seq of day 14 GC B cells. (D, E) Representative FACS profiles (D) and percentages of NPhi subset in CD31 cells and CD31+ cells amongst NP+ CD23+ LZ cells 12–14 days after immunization. Each symbol represents one mouse, and each line represents the same mouse. Data are pooled from two experiments. *** P<0.001. See also Figure S2.
Figure 4.
Figure 4.. IL4Ra signaling restrains memory B cell development at the CD23+ LZ stage
(A-I) Immunized Il4ra+/+ and Il4ra−/− mice were analyzed on day 13. (A, B) Representative FACS profiles (A) and frequencies of CXCR4lo CD86hi LZ cells (B) in GC B cells. (C, D) Representative FACS profiles (C) and frequencies of CD23+ cells (D) in LZ GC B cells. (E, F) Representative FACS profiles (E) and frequencies of CD31+ cells (F) in CD23+ LZ GC B cells. (G, H) Representative FACS profiles (G) and frequencies of CD31+ CCR6+ cells (H) in GC B cells. (I) Frequencies NP+ memory B cells in B220+ GL7 non-GC B cells. Data are pooled from two experiments. (J) Immunized Il4ra+/+ and Il4ra−/− mice were treated with EdU on day 11 post immunization and were analyzed on day 14. Frequencies of NP+ EdU+ memory B cells in B220+ GL7 non-GC B cells. Data are pooled from two experiments. (K-N) Immunized mice received IL4-αIL4 complex or saline on day 11, 12, 13 post immunization and were analyzed on day 14. (K, L) Frequencies of CD23+ cells in LZ GC B cells (K left), CD31+ cells in CD23+ LZ GC B cells (K right), and CD31+CCR6+ cells in GC B cells (L). (M, N) Frequencies of NP+ memory B cells (M) and IgG1+ CD73+ memory B cells (N) in CD19+ GL7 non-GC B cells. Each symbol represents one mouse. (K-M) One of three experiments with similar result is shown. (N) Data are pooled from three experiments. See also Figure S3.
Figure 5.
Figure 5.. IL4RA and STAT6 are intrinsically required for restraining memory B cell development
(A-C) Mixed BM chimeras were made with CD45.1 wild-type (Il4ra+/+) and CD45.2 Il4ra+/+ or Il4ra−/− BM cells. (A) Competency values of LZ (B220+ CD95hi GL7hi CXCR4lo CD86hi) (left), CD23+ LZ (middle), CD31+ CD23+ LZ (right) GC compartment at day 13 following immunization. (B) Frequencies of CD31+ cells in CD23+ LZ GC B cells (left) and CCR6+ CD31+ cells in GC B cells (right) in different compartments (black CD45.1+ and red CD45.2+) of mixed chimeras. (C) Frequencies of IgG1+ cells in GC B cells in different compartments (black CD45.1+ and red CD45.2+) of mixed chimeras. Gating strategy and equation for calculating differentiation ratios shown in Figure S4A–C. (A-B) One of three experiments with similar results is shown. (C) Data are pooled from three experiments. (D, E) Mixed (50:50) BM chimeras were made with CD45.1 wild-type (Stat6+/+) and CD45.2 Stat6+/+ or Stat6−/− BM cells. (D) Competency values of LZ (left), CD23+ LZ (middle), CD31+ CD23+ LZ (right) GC compartment at day 13 following immunization. (E) Frequencies of CD31+ cells in CD23+ LZ GC B cells in different compartments (black CD45.1+ and red CD45.2+) of mixed chimeras. One of two experiments with similar results is shown. (F-J) Control and S1pr2CreERT2/+ IL4raf/f mice were immunized with NP-KLH, treated with tamoxifen to induce Cre expression, and analyzed on day 13. (F) Frequencies of IgG1+ cells in GC B cells. (G, H) Frequencies of LZ cells in GC B cells (G left), CD23+ cells in LZ GC B cells (G right), CD31+CCR6+ cells in GC B cells (H). (I) Ratio of NP+ IgG1+ memory B cells to NP+IgG1+ GC B cells. (J) Ratio of CD38+IgG1+ memory B cells to CD38IgG1+ GC B cells. Data are pooled from three experiments. (K) Geometric mean fluorescence intensity (MFI) of CD23 in CD45.1+ (left) and CD45.2+ MD4 GC B cells with indicated treatment. One of two experiments with similar results is shown. In all plots each symbol represents one mouse. In K, one-way ANOVA with Sidak multiple comparisons test was used. See also Figure S5 and S6.
Figure 6.
Figure 6.. IL4RA expression by FDCs limits IL4 availability to GC B cells
(A) Violin plots of Il4ra and Epcam expression in different stromal cell subsets. (B, C) Representative FACS profiles (B) and histograms (C) of IL4RA in non-FDCs (CD45 PDPN+ CD31 CD21/35 EPCAM) and FDCs (CD45 PDPN+ CD31 CD21/35+ EPCAM+) isolated from mesenteric LNs in mice with indicated genotype. Data represent two experiments, with at least three mice per experiment. (D-G) Reverse chimaeras were made by reconstituting irradiated Il4ra+/+ and Il4ra−/− mice with WT BM. (D-F) Frequencies of CD95hi GL7hi GC B cells in B220+ IgD B cells (D), CXCR4lo CD86hi LZ cells in GC B cells (E left), CD23+ cells in LZ B cells (E middle), CD31+ cells in CD23+ LZ B cells (E right) and IgG1+ cells in GC B cells (F) 13 days after immunization. (G) Ratio of CD73+ IgG1+ memory B cells to IgG1+ cells. Data are pooled from three experiments. (H-M) Reverse chimeras were made by reconstituting irradiated control and Cd21Cre/+ Il4raf/f mice with wild-type (Il4ra+/+) BM. (H-K) Frequencies of CD95hi GL7hi GC B cells in CD19+ B cells (H), IgG1+ cells in GC B cells (I), LZ cells in GC B cells (J left), CD23+ cells in LZ B cells (J middle), CD31+ cells in CD23+ LZ B cells (J right) and CD31+ CCR6+ cells in GC B cells (K) 13 days after immunization. (L, M) Frequencies of NP+IgG1+ (L) and CD73+ IgG1+ (M) memory cells in non-GC B cells. (N-P) Scheme for testing memory response in Ccl19Cre/+ Il4raf/f mice that had been reconstituted with wild-type BM (N), flow cytometry plots from the indicated mice (O), and summary data (P) showing frequency of CD138+NP+ plasma cells in the spleen of boosted control or Ccl19Cre/+ Il4raf/f chimeric mice. Data are pooled from two of three experiments. In D-M and P, each symbol represents one mouse. See also Figure S6.
Figure 7.
Figure 7.. Single cell RNA-seq analysis of stromal cell IL4Ra deficient mice
(A-D) Reverse chimaeras were made by reconstituting irradiated Il4ra+/+ and Ccl19Cre/+ Il4raf/f mice with WT BM. Single cell RNA-seq and scVDJ-seq was performed on B220+ CD95hi GL7hi IgD cells sorted at 14 post NP-KLH immunization. Cells from 4 mice were pooled together in each condition. (A) UMAP plots of the expression of Fcer2a and Ccr6. Color scaled for each gene with log normalized expression level. (B) UMAP plots of different clusters. (C) Visualize signature scores of IL4 signaling in GC B cells. Color scaled for signature score. (D) Pie charts displaying the frequencies of W33L mutations in IGHV1-72*01 sequences. Chi-square test. See also Figure S7.

References

    1. Anderson SM, Tomayko MM, Ahuja A, Haberman AM, and Shlomchik MJ (2007). New markers for murine memory B cells that define mutated and unmutated subsets. J. Exp. Med. 204, 2103–2114. - PMC - PubMed
    1. Andoh A, Masuda A, Yamakawa M, Kumazawa Y, and Kasajima T (2000). Absence of interleukin-4 enhances germinal center reaction in secondary immune response. Immunol. Lett. 73, 35–41. - PubMed
    1. Bannard O, and Cyster JG (2017). Germinal centers: programmed for affinity maturation and antibody diversification. Curr. Opin. Immunol. 45, 21–30. - PubMed
    1. Bemark M, Hazanov H, Stromberg A, Komban R, Holmqvist J, Koster S, Mattsson J, Sikora P, Mehr R, and Lycke NY (2016). Limited clonal relatedness between gut IgA plasma cells and memory B cells after oral immunization. Nature communications 7, 12698. - PMC - PubMed
    1. Bergen V, Lange M, Peidli S, Wolf A, and Theis FJ (2020). Generalizing RNA velocity to transient cell states through dynamical modeling. bioRxiv 820936; doi: 10.1101/820936 - DOI - PubMed

Publication types

MeSH terms