. 2021 Nov 4;81(21):4481-4492.e9.
doi: 10.1016/j.molcel.2021.08.034. Epub 2021 Sep 22.

NSD2 dimethylation at H3K36 promotes lung adenocarcinoma pathogenesis

Affiliations

NSD2 dimethylation at H3K36 promotes lung adenocarcinoma pathogenesis

Deepanwita Sengupta et al. Mol Cell. .

Abstract

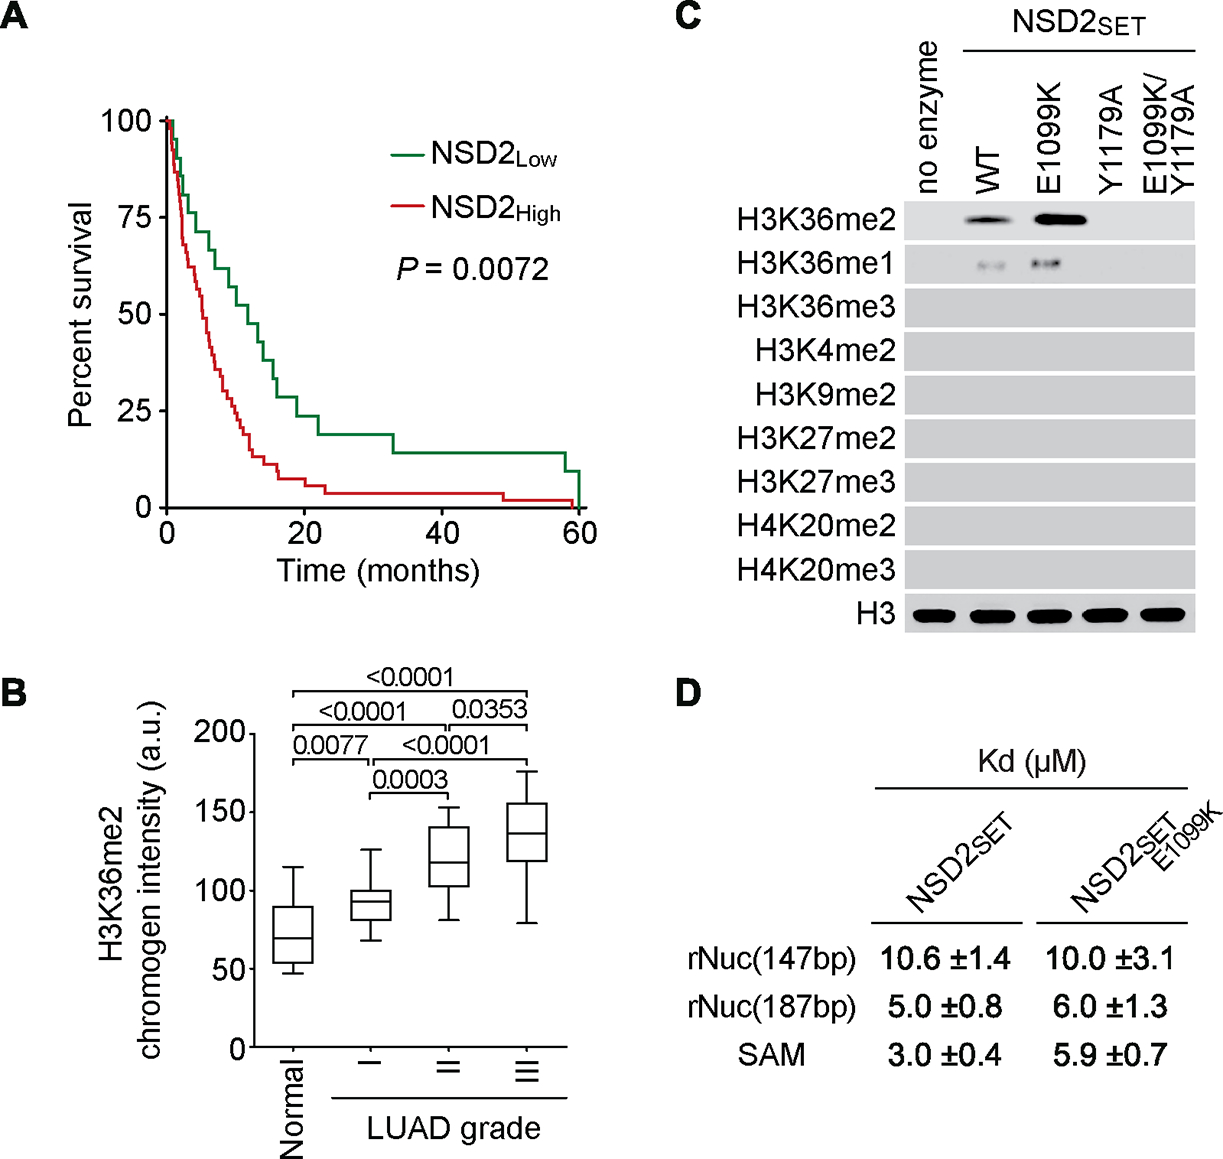
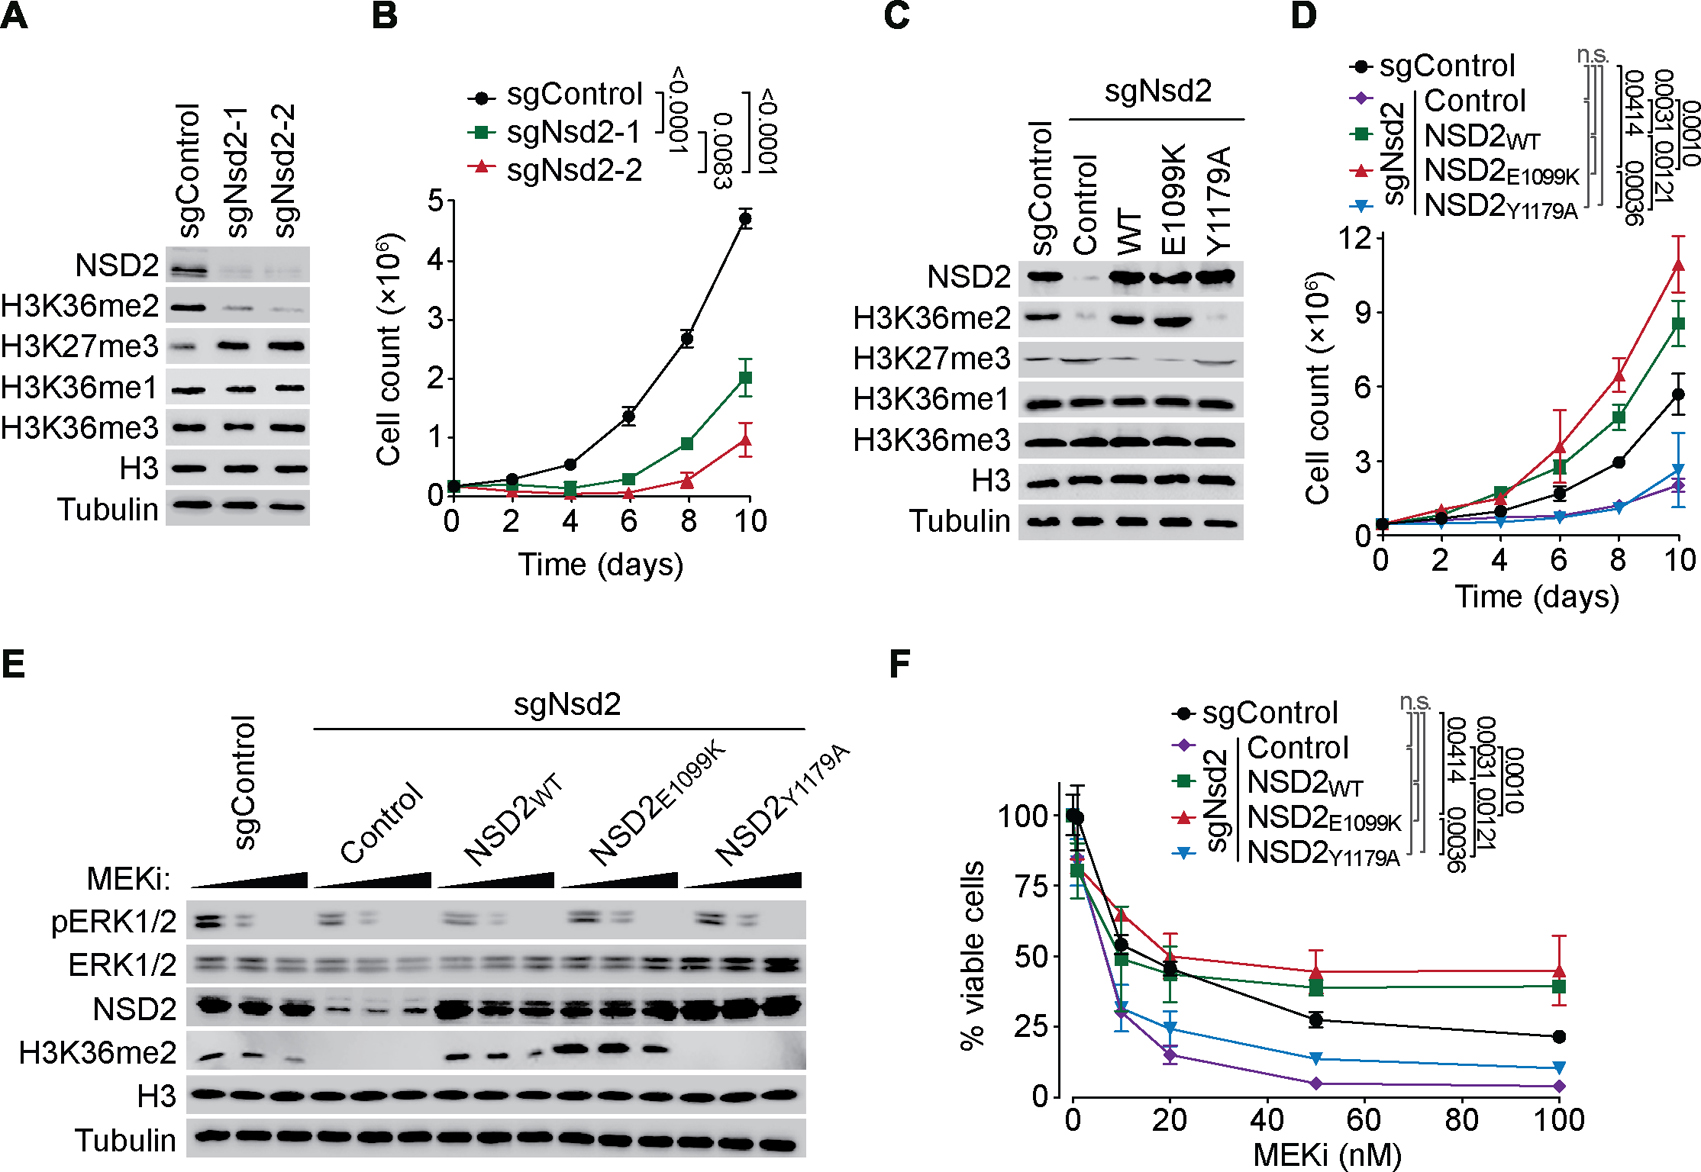
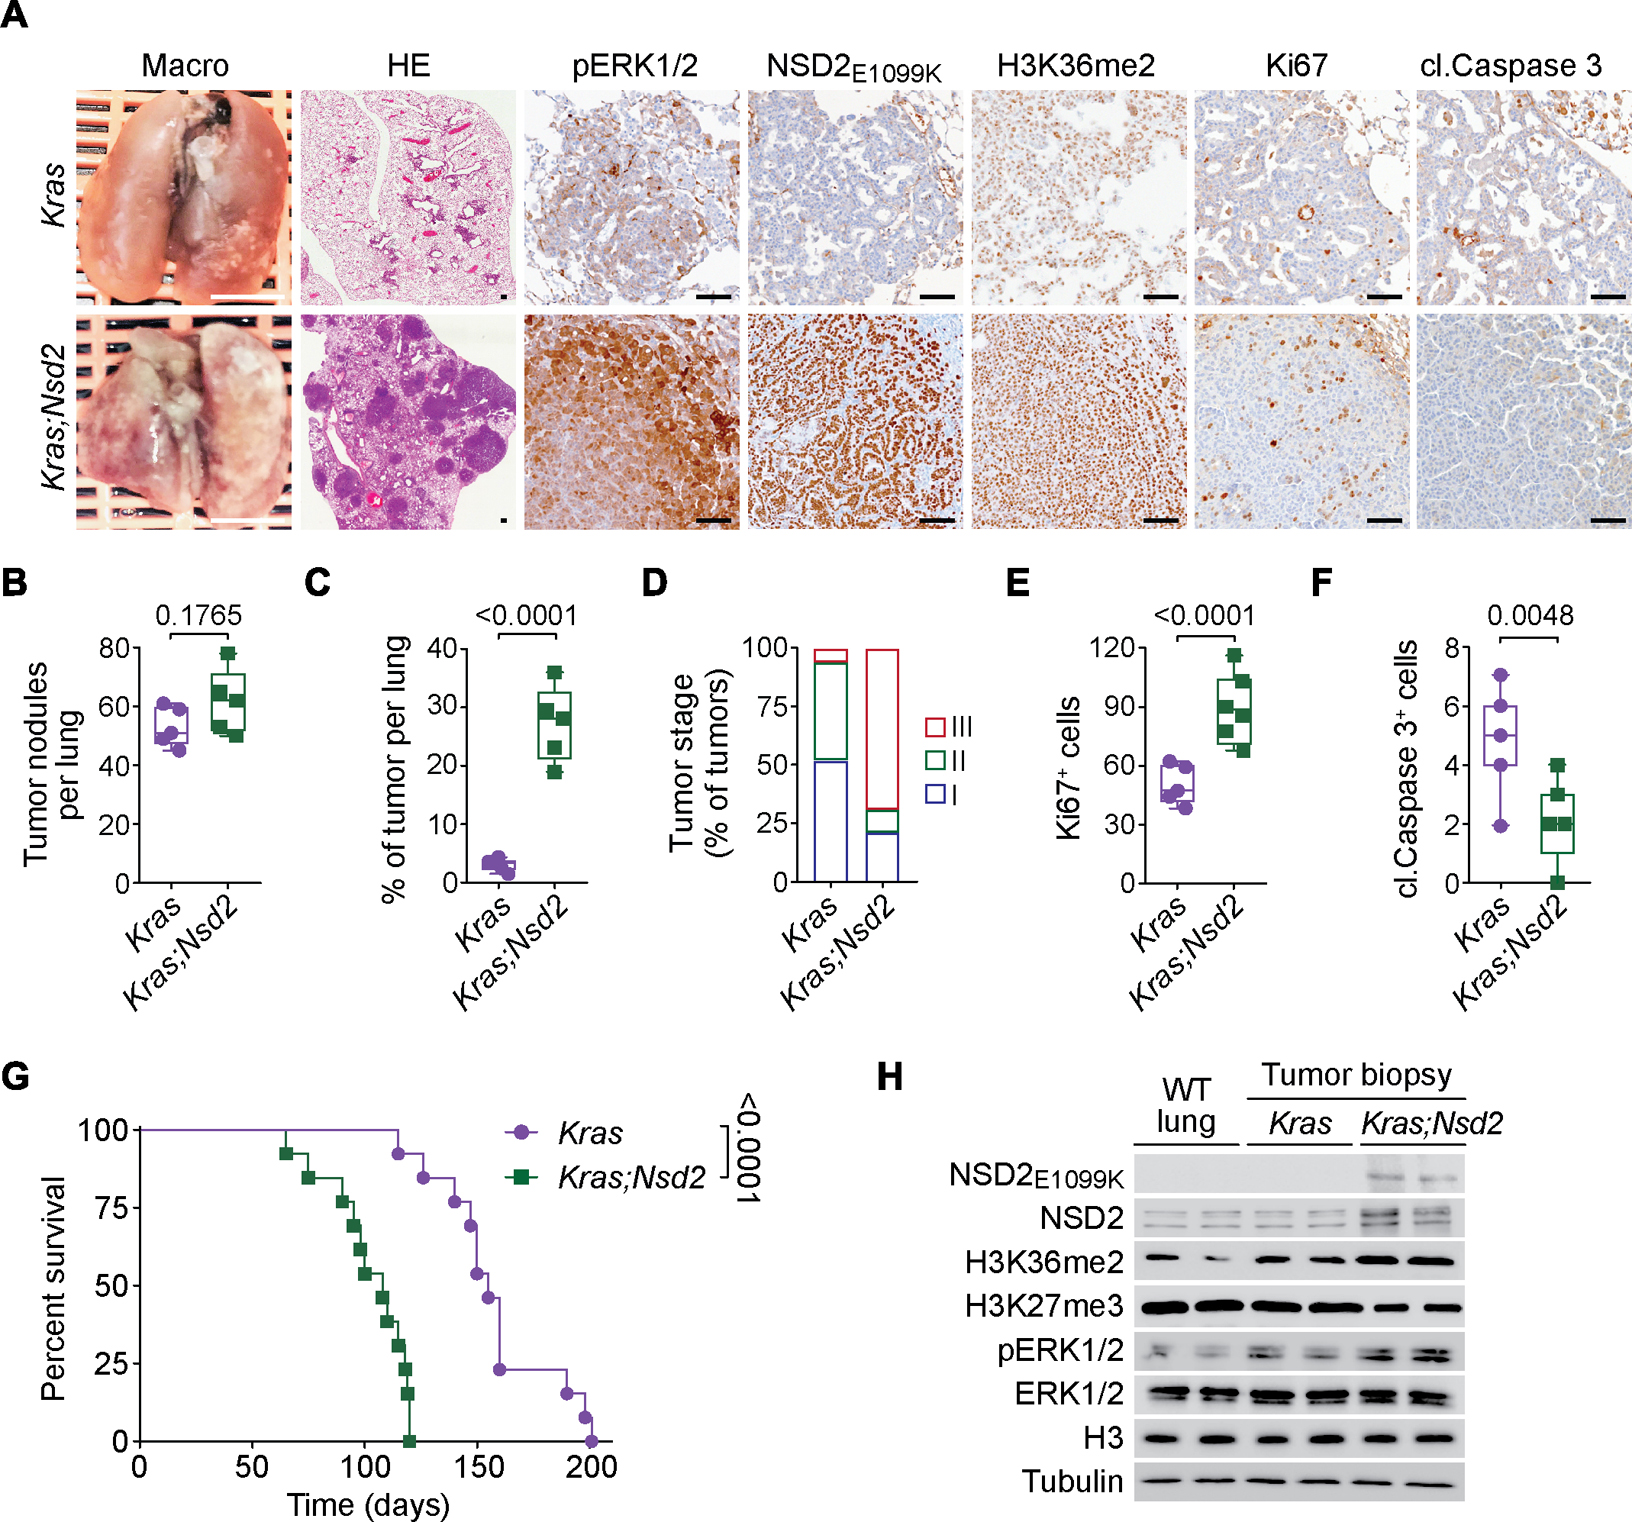
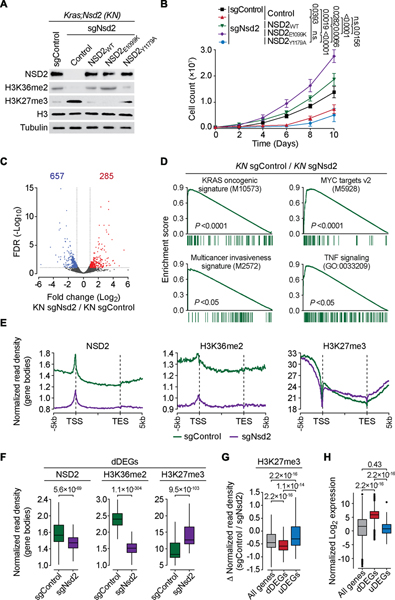
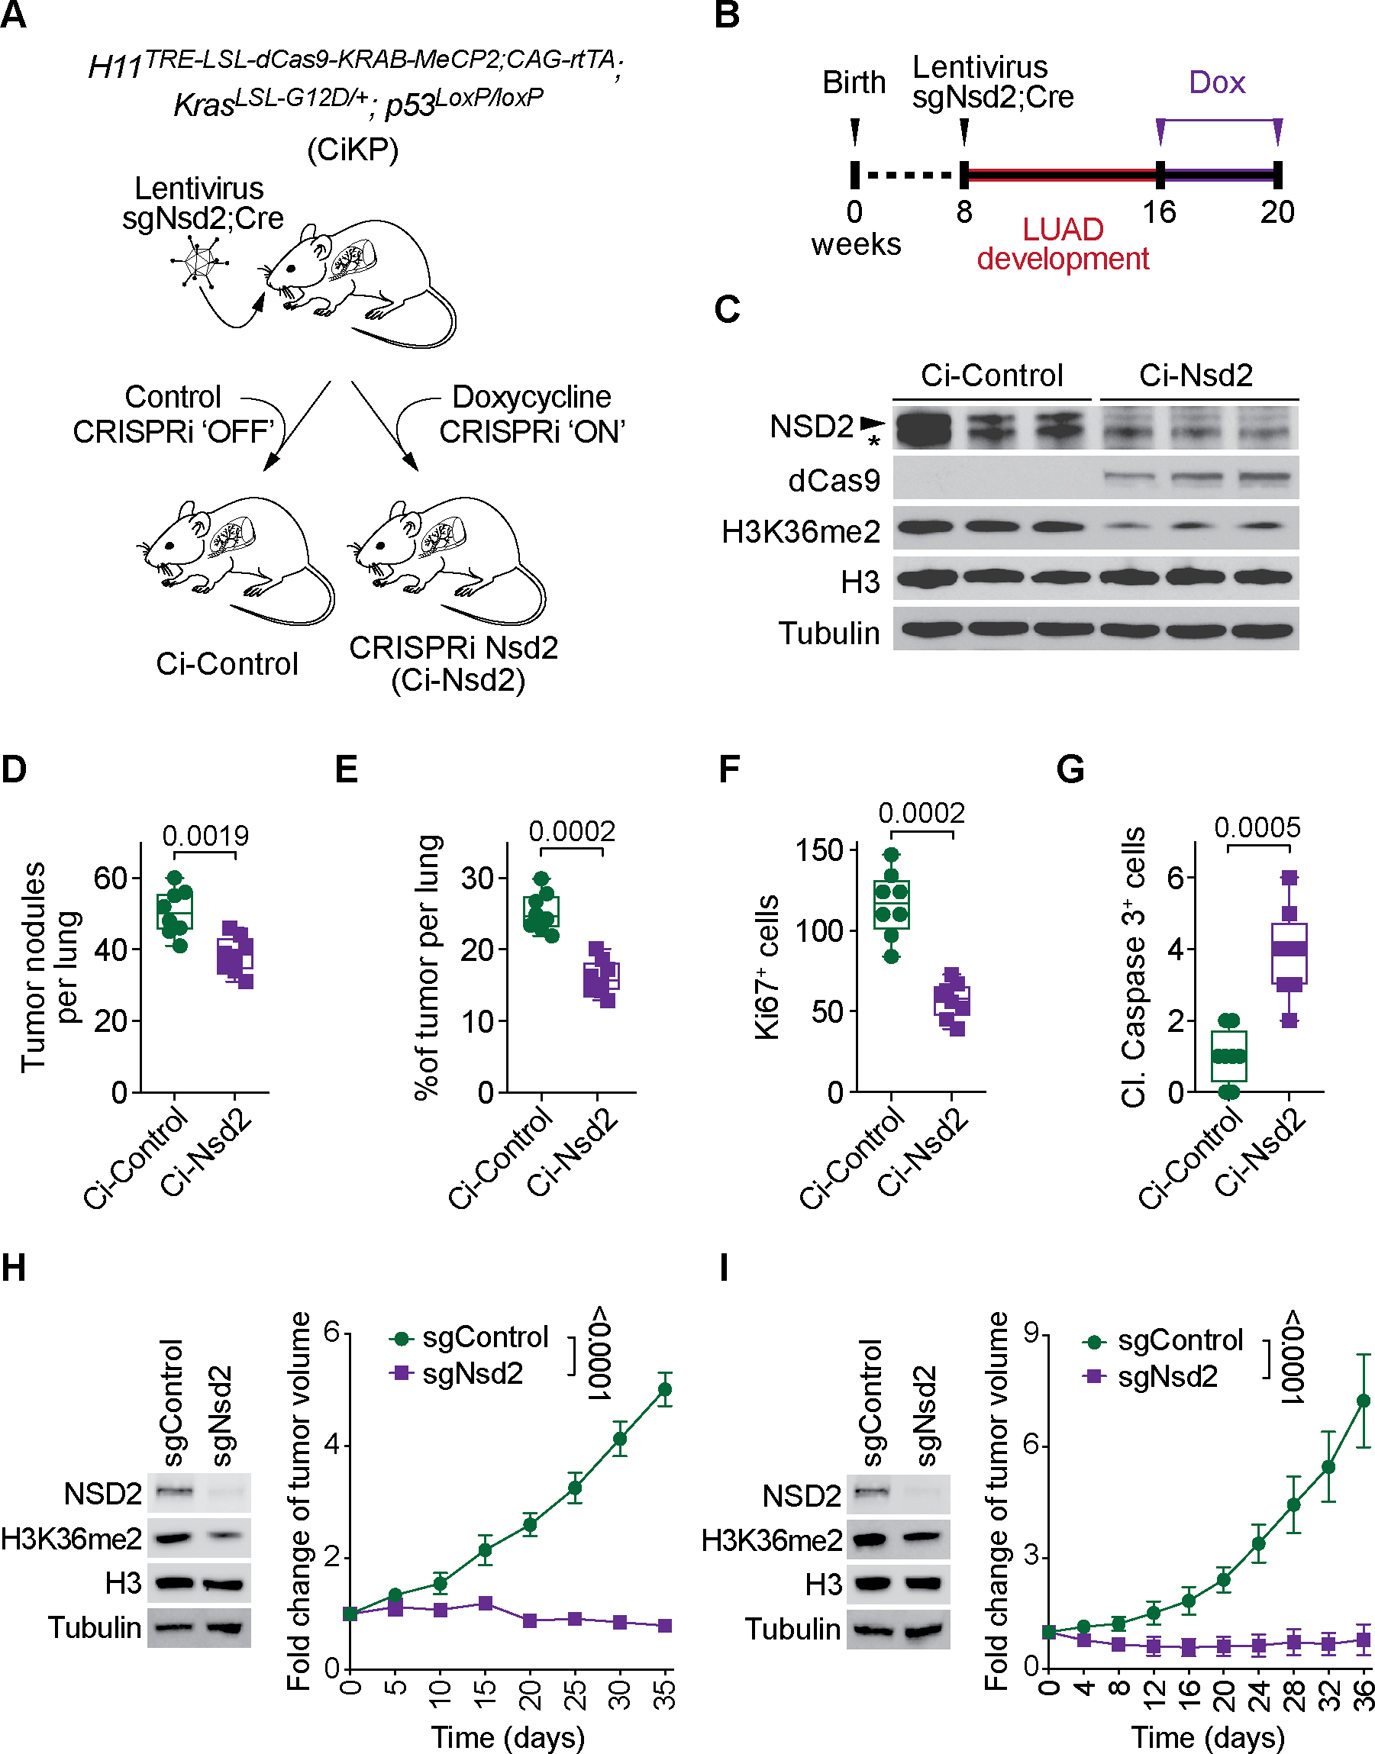
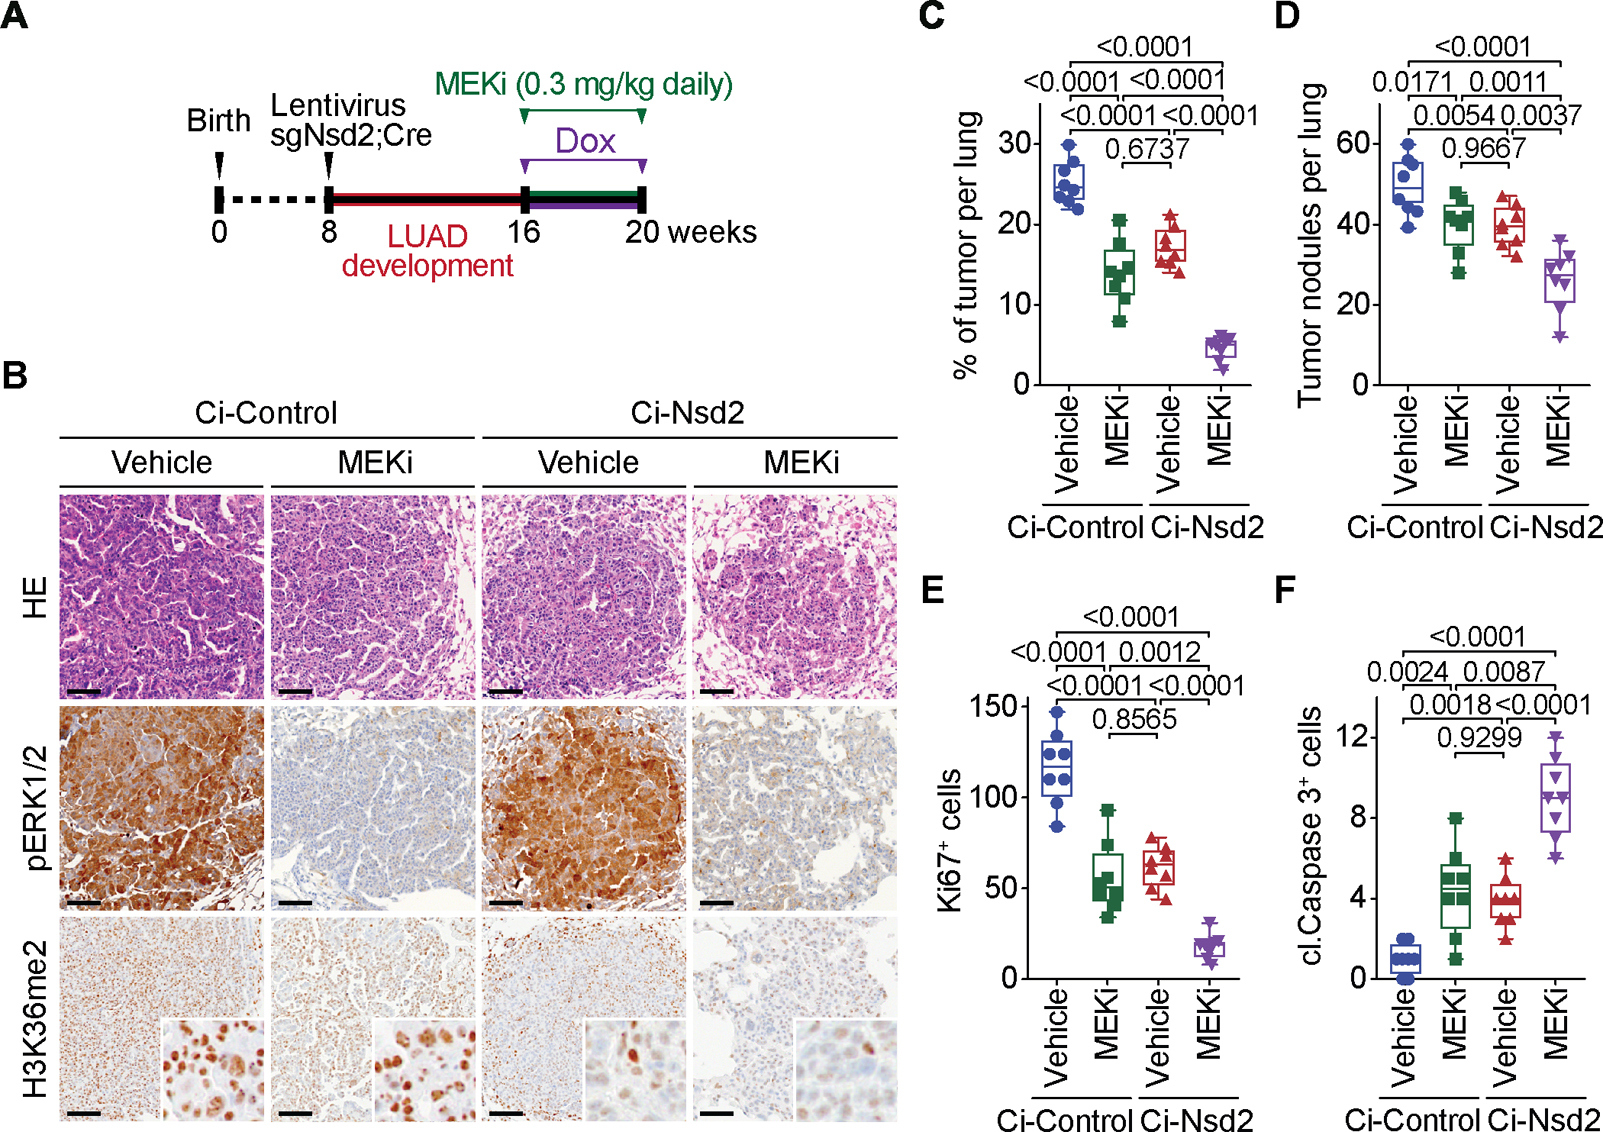
The etiological role of NSD2 enzymatic activity in solid tumors is unclear. Here we show that NSD2, via H3K36me2 catalysis, cooperates with oncogenic KRAS signaling to drive lung adenocarcinoma (LUAD) pathogenesis. In vivo expression of NSD2E1099K, a hyperactive variant detected in individuals with LUAD, rapidly accelerates malignant tumor progression while decreasing survival in KRAS-driven LUAD mouse models. Pathologic H3K36me2 generation by NSD2 amplifies transcriptional output of KRAS and several complementary oncogenic gene expression programs. We establish a versatile in vivo CRISPRi-based system to test gene functions in LUAD and find that NSD2 loss strongly attenuates tumor progression. NSD2 knockdown also blocks neoplastic growth of PDXs (patient-dervived xenografts) from primary LUAD. Finally, a treatment regimen combining NSD2 depletion with MEK1/2 inhibition causes nearly complete regression of LUAD tumors. Our work identifies NSD2 as a bona fide LUAD therapeutic target and suggests a pivotal epigenetic role of the NSD2-H3K36me2 axis in sustaining oncogenic signaling.

Keywords: CRISPR interference mouse model; H3K36; KRAS; MEK inhibition; NSD2; chromatin; epigenetics; histone methylation; lung adenocarcinoma; lung cancer.


Conflict of interest statement

Declaration of interests O.G. is a co-scientific founder, consultant, and stockholder of EpiCypher, Inc. and K36 Therapeutics, Inc. P.K.M. is a scientific co-founder, consultant, and stockholder of Amplified Medicines, Inc. and Ikena Oncology, Inc.

Figures

Figure 1.
Figure 1.. Increased NSD2 and H3K36me2 levels associated with poor LUAD prognosis.
(A) NSD2 protein expression levels in LUAD biopsy samples negatively correlate with LUAD patient survival. Analysis of correlation between NSD2 staining signal in tumor and LUAD patient survival assessed by immunohistochemistry (IHC). P values determined by log-rank test, 72 LUAD samples were stained in total. (B) Increased H3K36me2 levels in advancing grades of LUAD. Quantification of IHC chromogen stain intensity shows increasing levels of H3K36me2 from normal human lung (n = 24) to increasing histological grades of LUAD (n = 72). P values were determined by two-way ANOVA with Tukey’s testing for multiple comparisons. Box plots, the line indicates the median, the box marks the 75th and 25th percentiles and the whiskers indicate the minimum and maximum values. (C) NSD2E1099K hyperactive variant retains wild-type selectivity for H3K36me2. In vitro methylation reactions with wild-type (WT) NSD2 catalytic domain (NSD2SET), or NSD2SET harboring E1099K or E1099K combined with a catalytic inactivating mutation (E1099K/Y1179A) as indicated on recombinant nucleosome substrate. Western blots of the reaction products with the indicated antibodies. H3 is shown as a loading control. (d) The E1099K substitution decreases binding affinity for SAM but does not alter binding affinity for nucleosomes. Biochemical characterization of E1099K substitution on the NSD2SET domain. Kd values with corresponding s.d. errors (three independent experiments) are shown for binding studies of NSD2SET and NSD2SET-E1099K to recombinant nucleosomes (rNuc) reconstituted on 147bp and 187bp 601 Widom DNA as indicated (determined by microscale thermophoresis, MST) and the cofactor SAM (determined by ITC) (see Figures S1F–G).
Figure 2.
Figure 2.. NSD2 enzymatic activity promotes LUAD cell proliferation and resistance to MEKi.
(A-B) NSD2 depletion inhibits proliferation of A549 cells. Western blot analysis with the indicated antibodies (A) and proliferation rates (B) of A549 cells depleted of NSD2 using two independent sgRNAs (sgNsd2-1 and -2) or control (sgControl). Error bars represent mean ± s.e.m. from three independent experiments. P values were determined by two-tailed unpaired t-test. (C-D) NSD2 catalytic activity is required for NSD2-dependent proliferation of A549 LUAD cells. Western blot analysis with the indicated antibodies (C) and proliferation rate (D) of NSD2 depleted cells complemented with CRISPR-resistant wild-type or the indicated NSD2 variants, or control vector. Error bars represent mean ± s.e.m. from three independent experiments. P values were determined by two-tailed unpaired t-test. (E-F) NSD2 depletion renders A549 cells more sensitive to MEKi (Trametinib) treatment. Western blot analysis with the indicated antibodies (E) and percent cell viability (F) of A549 cells ± NSD2 complemented with CRISPR-resistant NSD2 as in (C), treated with DMSO (control) or 25 nM and 50 nM MEKi (E) or the indicated concentrations of MEKi (f) for 48 hours. Data represent mean ± s.e.m. of three technical replicates in two independent experiments. P values were determined by two-way ANOVA with Tukey’s testing for multiple comparisons.
Figure 3.
Figure 3.. NSD2E1099K-mediated H3K36me2 synthesis promotes KRAS-driven LUAD tumorigenesis in vivo.
(a) Representative macroscopic lung images, HE and IHC staining with indicated antibodies of lung tissue sections from KrasLSL-G12D/+ (Kras) and KrasLSL-G12D/+;Rosa26LSL-Nsd2(E1099K) (Kras;Nsd2) mutant mice at 14 weeks after tumor induction (representative of n = 6 mice for each group). Scale bars: 100 μm. (B-F) Quantification of total number of tumor nodules (B), tumor burden (tumor area per lung) (C), tumor grade (D), proliferation (Ki67 positive cells per tumor area) (E) and apoptotic cells (cleaved Caspase 3 positive cells per tumor area) (F) in samples as in (A). Data are represented as mean ± s.e.m. P values were determined by two-tailed unpaired t-test. Box plots, the line indicates the median, the box marks the 75th and 25th percentiles and the whiskers indicate the minimum and maximum values. (G) NSD2E1099K expression accelerates KRAS-driven LUAD lethality. Kaplan-Meier survival curves of Kras (n = 13, median survival = 155 days) and Kras;Nsd2 (n = 13, median survival = 108 days) mutant mice. P values were determined by log-rank test. (H) Western blots with the indicated antibodies of normal or tumor lung biopsy lysate as indicated from wild type, Kras and Kras;Nsd2 mutant mice. Two independent samples are shown for each genotype. H3 and Tubulin are shown as a loading control.
Figure 4.
Figure 4.. NSD2-H3K36me2 axis regulates oncogenic gene expression programming.
(A-B) NSD2 catalytic activity is required for NSD2-dependent proliferation of KN cells. (A) Western blot analysis with the indicated antibodies of whole cell lysates after reconstitution of NSD2 knockdown (sgNsd2) in KN cells with the indicated CRISPR-resistant NSD2 variants. Control knockdown (sgControl) KN cells are included as controls. H3 and tubulin are used as loading controls. (B) Proliferation assays of cells as in (a). Error bars represent mean ± s.e.m. from three independent experiments. P values were determined by two-tailed unpaired t-test. (C) NSD2 expression correlates with gene activation. Volcano plot of RNA-seq comparison between KN cells ± sgNsd2 (two independent biological replicates for each condition). NSD2 depletion results in decreased expression of 657 genes shown in blue (fold change log2 ≤ −0.8, false discovery rate (FDR) < 0.1 from DESeq2) and increased expression of 285 genes shown in red (fold change log2 ≥ 0.8, FDR < 0.1 from DESeq2). FDR values are provided. (D) NSD2 regulates multiple oncogenic programs. Examples of top gene sets enrichment analysis (GSEA) signatures associated with NSD2-dependent DEGs in KN cells. P values are provided (see Figure S4D for complete set; detailed statistics description in Methods). (E) CUT&RUN profiles of NSD2, H3K36me2 or H3K27me3 over averaged gene body for all genes in KN cells ± sgNsd2 as indicated. (F) Quantification of NSD2, H3K36me2 and H3K27me3 normalized read densities in KN cells ± sgNsd2 on the gene bodies of dDEGs as indicated. P values are provided (see detailed statistics description in the Methods section). (G) Quantification of the change in H3K27me3 normalized read density signal in KN cells upon NSD2 depletion within the indicated gene sets (all genes, dDEGs, and uDEGs), and the significance in the difference in change between the three gene sets as indicated. P values were calculated by Wilcoxon rank sum test. (H) Normalized gene expression levels of all genes, dDEGs, and uDEGs in KN cells. P values were determined by Wilcoxon rank sum test. The expression is shown as log2 of transcripts per kilobase of million mapped reads (TPM) values. In (G, H) box plots, the line indicates the median, the box marks the 75th and 25th percentiles and the whiskers indicate the minimum and maximum values.
Figure 5.
Figure 5.. CRISPRi mediated suppression of NSD2 attenuates LUAD in vivo.
(A) Schematic of generation of a Cre-dependent doxycycline-inducible H11dCas9-KRAB-MeCP2 (Ci) transgenic mouse for CRISPRi mediated suppression of NSD2 in KrasG12D; p53LoxP/LoxP (KP) driven LUAD model. In this model, Cre and sgNsd2 present in lentivirus are introduced by tracheal lavage. Subsequently, treatment of CiKP mice with doxycycline leads to expression of dCas9-KRAB-MeCP2 and NSD2 suppression (Ci-Nsd2). CiKP mice treated with vehicle are designated Ci-Control. (B) Treatment schedule for CiKP model of LUAD including induction via lentiviral intratracheal lavage and CRISPRi activation by doxycycline containing regular mouse chow (200 mg/kg). (C) Western blots with the indicated antibodies of lung biopsy lysates from Ci-Control and Ci-Nsd2 mutant mice. Three independent and representative samples are shown for each genotype. H3 and tubulin are shown as loading controls. Asterisk indicates a non-specific band detected in mouse tissue. (D-G) Quantification of total number of tumor nodules (D), tumor burden (tumor area per lung) (E), proliferation (Ki67 positive cells per tumor area) (F) and apoptotic cells (cleaved Caspase 3 positive cells per tumor area) (G) in Ci-Control and Ci-Nsd2 mutant mice. Data are represented as mean ± s.e.m. of n= 8 mice for each group. P values were determined by two-tailed unpaired t-test. Box plots, the line indicates the median, the box marks the 75th and 25th percentiles and the whiskers indicate the minimum and maximum values. (H-I) NSD2 depletion attenuates PDX LUAD growth. Genotype of PDXs used are KRASG13D, p53P128S (H) and KRASG12C, p53R273C (I); Full genotype description in Methods. (Left panels) Western blots of lysates from the indicated LUAD PDX samples ±sgNsd2 and using the indicated antibodies. H3 and Tubulin are loading controls. (Right panels) PDX tumor volume quantification. The statistical analysis of the tumor growth (n = 5 mice for each group) at the final time point was determined by a two-tailed t-test. Data are represented as mean ± s.e.m.
Figure 6.
Figure 6.. NSD2 depletion sensitizes LUAD to MEKi toxicity in vivo.
(a) Treatment schedule ± doxycycline to generate Ci-Control and Ci-Nsd2 mutant mice as described in (Figure 5A) and co-treatment with MEKi or placebo (vehicle). (B) Representative HE and IHC staining for phospho ERK1/2 (pERK1/2), a marker of MEK1/2 activity, and H3K36me2 a marker of NSD2 activity in Ci-Control and Ci-Nsd2 mutant mice ± MEKi. Scale bars, 50 μm. (C-F) Quantification of total number of tumor nodules (C), tumor burden (tumor area per lung) (D), proliferation (Ki67 positive cells per tumor area) (E) and apoptotic cells (cleaved Caspase 3 positive cells per tumor area) (F) in Ci-Control and Ci-Nsd2 mutant mice ± MEKi. Data are represented as mean ± s.e.m. of n= 8 mice for each group. Data for Ci-Control+Vehicle and Ci-NSD2+Vehicle are the same data presented in (Figure 5). P values were determined by two-way ANOVA with Tukey’s testing for multiple comparisons. Box plots, the line indicates the median, the box marks the 75th and 25th percentiles and the whiskers indicate the minimum and maximum values.

References

    1. Anders S, Pyl PT, and Huber W (2015). HTSeq--a Python framework to work with high-throughput sequencing data. Bioinformatics 31, 166–169. - PMC - PubMed
    1. Aytes A, Giacobbe A, Mitrofanova A, Ruggero K, Cyrta J, Arriaga J, Palomero L, Farran-Matas S, Rubin MA, Shen MM, et al. (2018). NSD2 is a conserved driver of metastatic prostate cancer progression. Nat Commun 9, 5201. - PMC - PubMed
    1. Barnett DW, Garrison EK, Quinlan AR, Stromberg MP, and Marth GT (2011). BamTools: a C++ API and toolkit for analyzing and managing BAM files. Bioinformatics 27, 1691–1692. - PMC - PubMed
    1. Bennett RL, Swaroop A, Troche C, and Licht JD (2017). The Role of Nuclear Receptor-Binding SET Domain Family Histone Lysine Methyltransferases in Cancer. Cold Spring Harb Perspect Med 7. - PMC - PubMed
    1. Bhat KP, Umit Kaniskan H, Jin J, and Gozani O (2021). Epigenetics and beyond: targeting writers of protein lysine methylation to treat disease. Nat Rev Drug Discov. - PMC - PubMed

Publication types

MeSH terms