. 2021 Nov;599(7885):513-517.
doi: 10.1038/s41586-021-04022-z. Epub 2021 Sep 23.

Architecture and assembly mechanism of native glycine receptors

Affiliations

Architecture and assembly mechanism of native glycine receptors

Hongtao Zhu et al. Nature. 2021 Nov.

Abstract

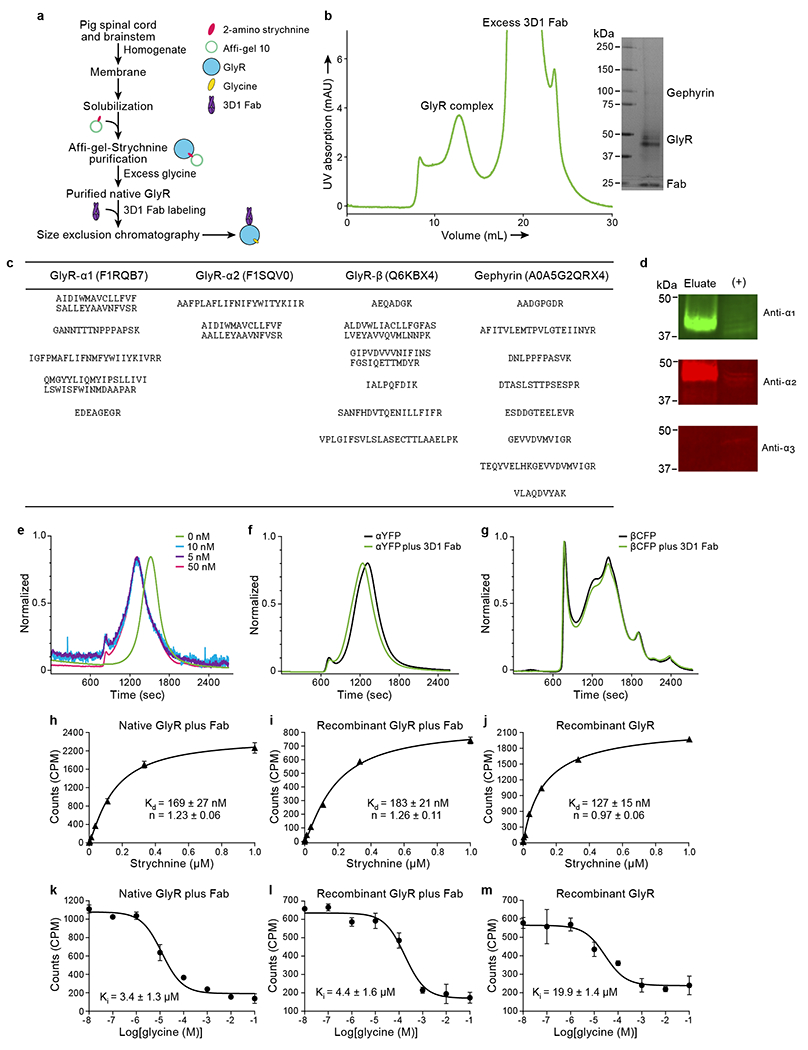
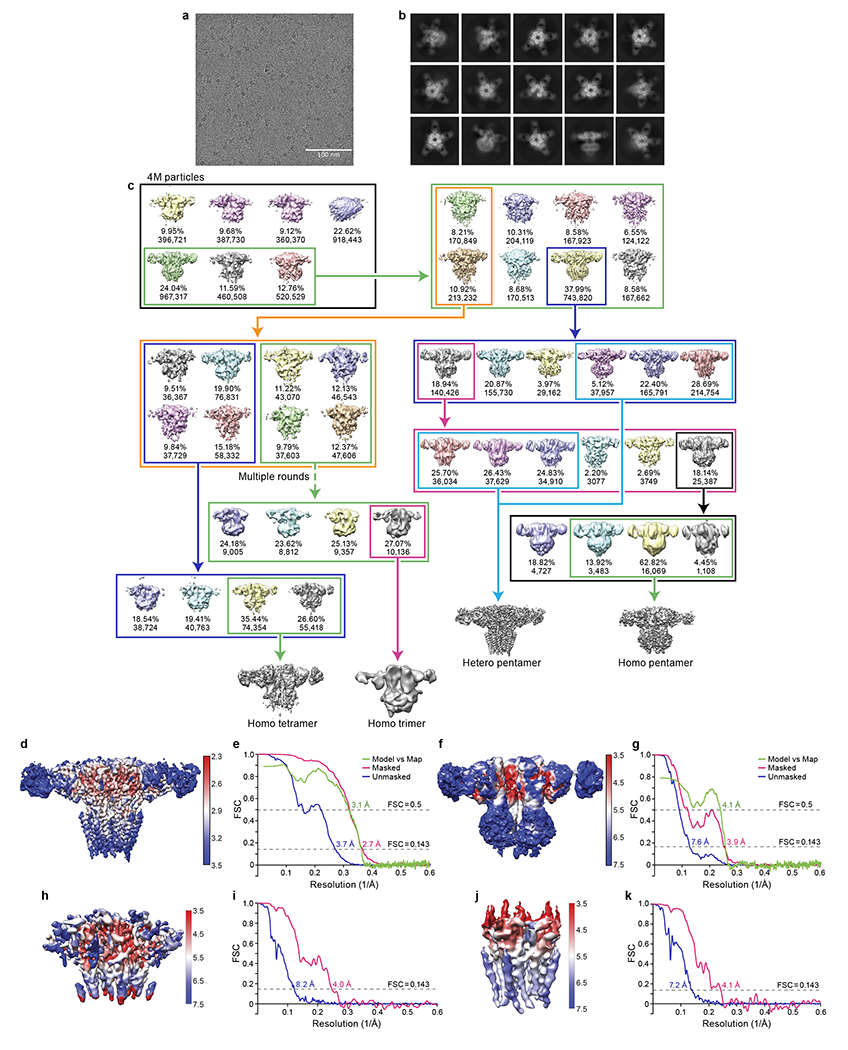
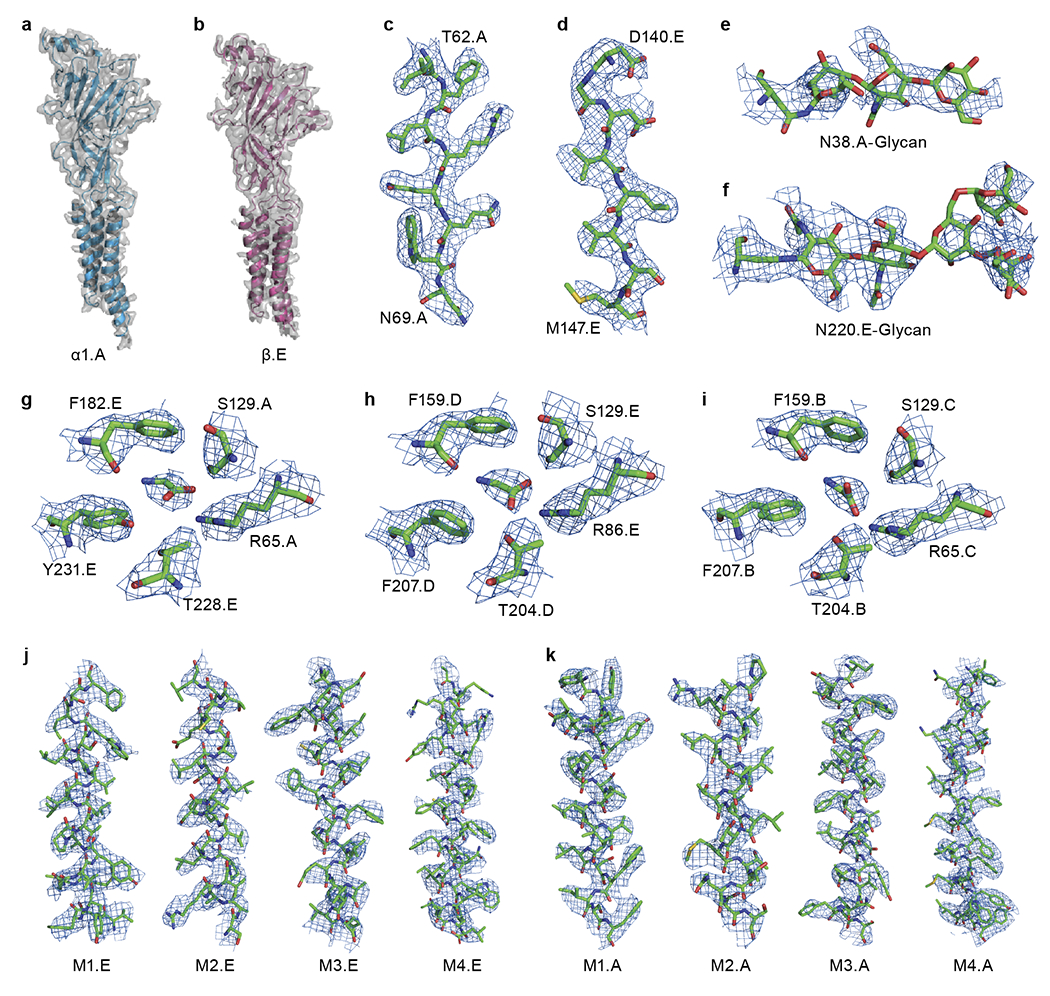
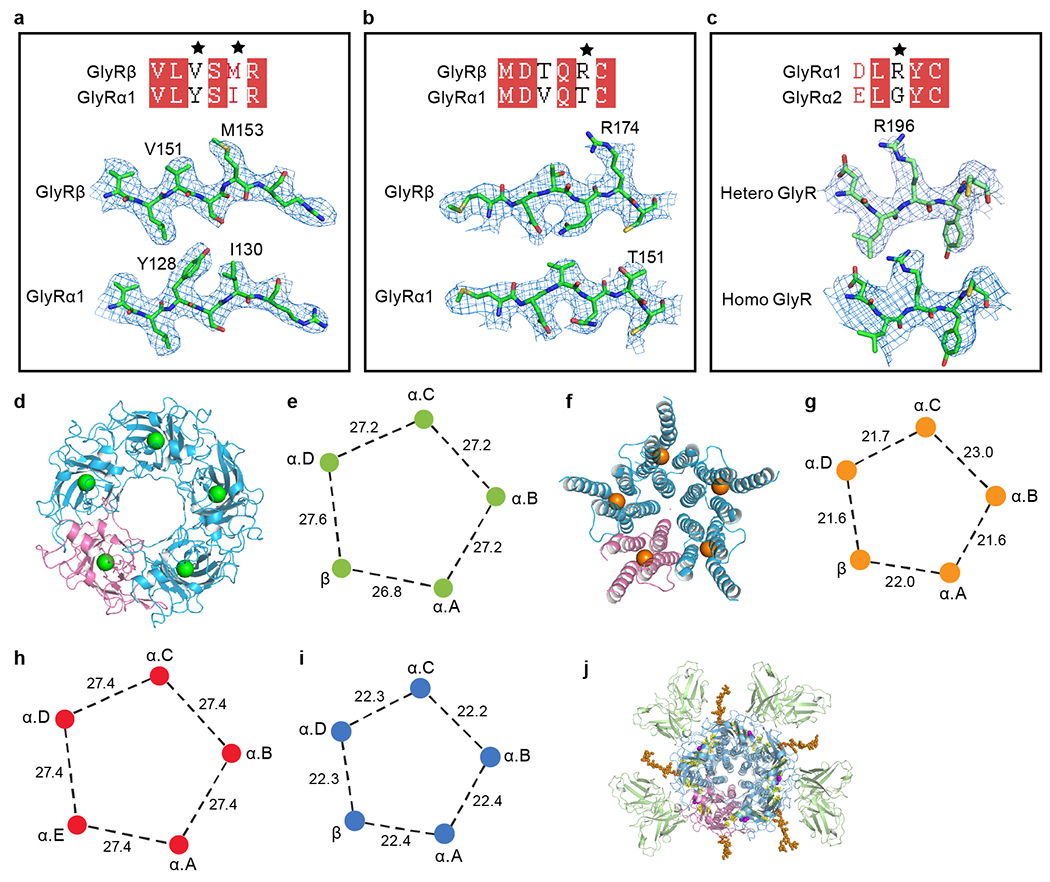
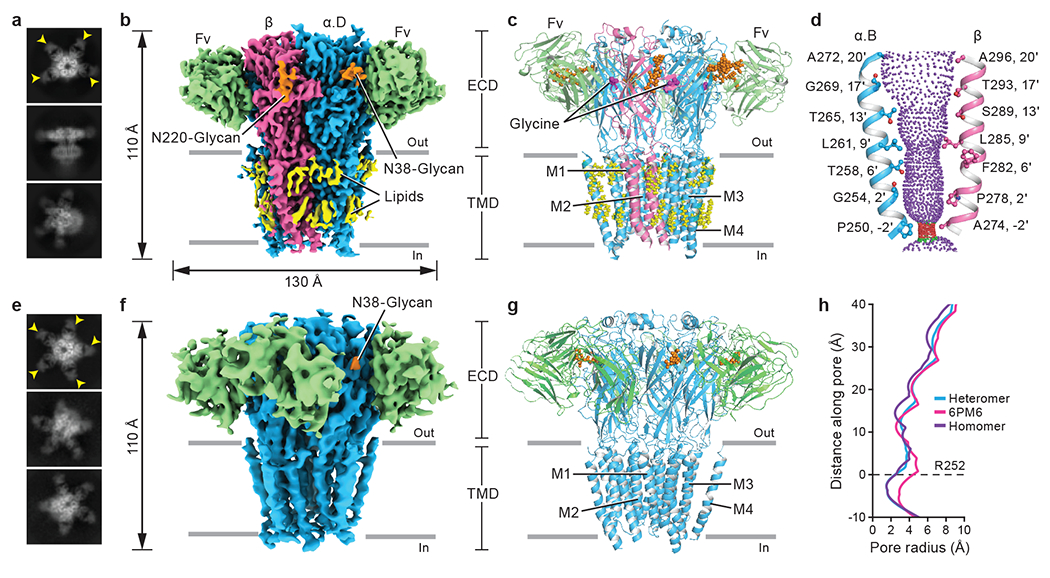
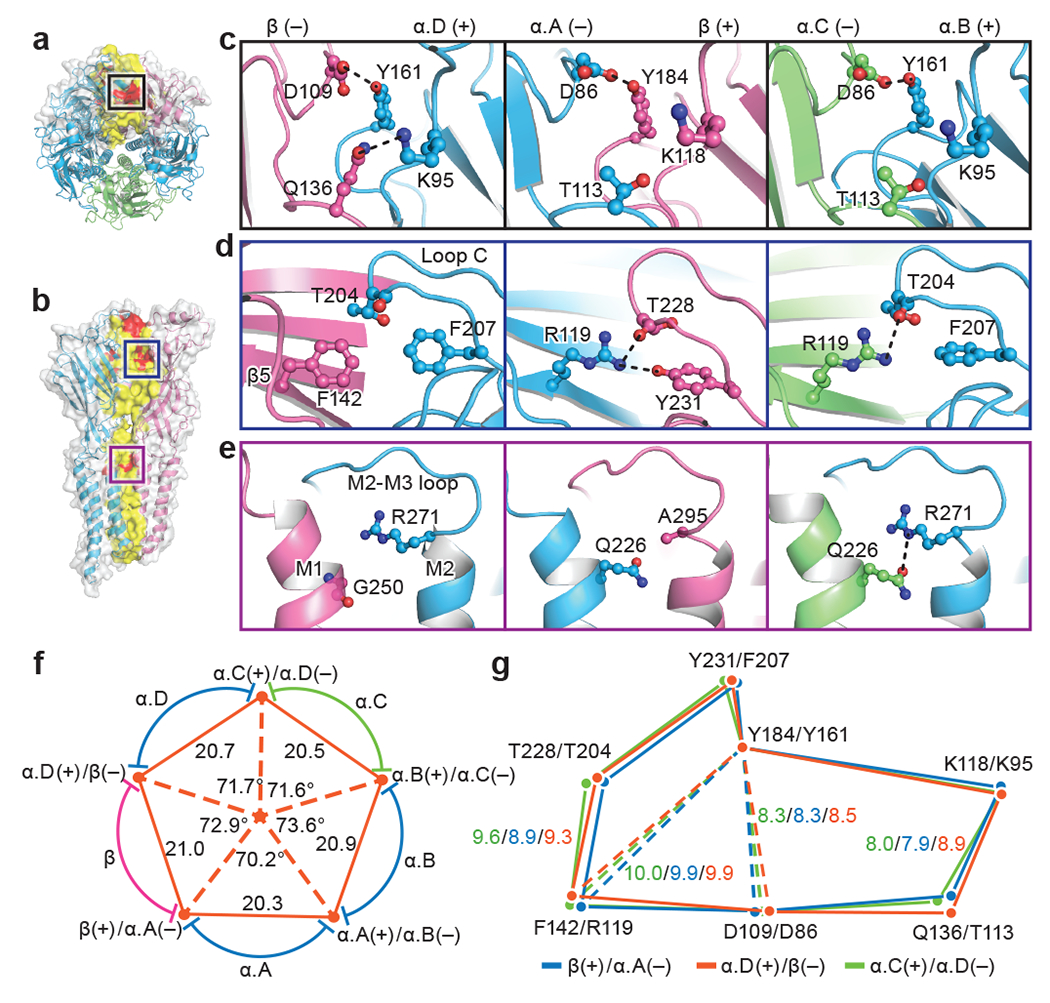
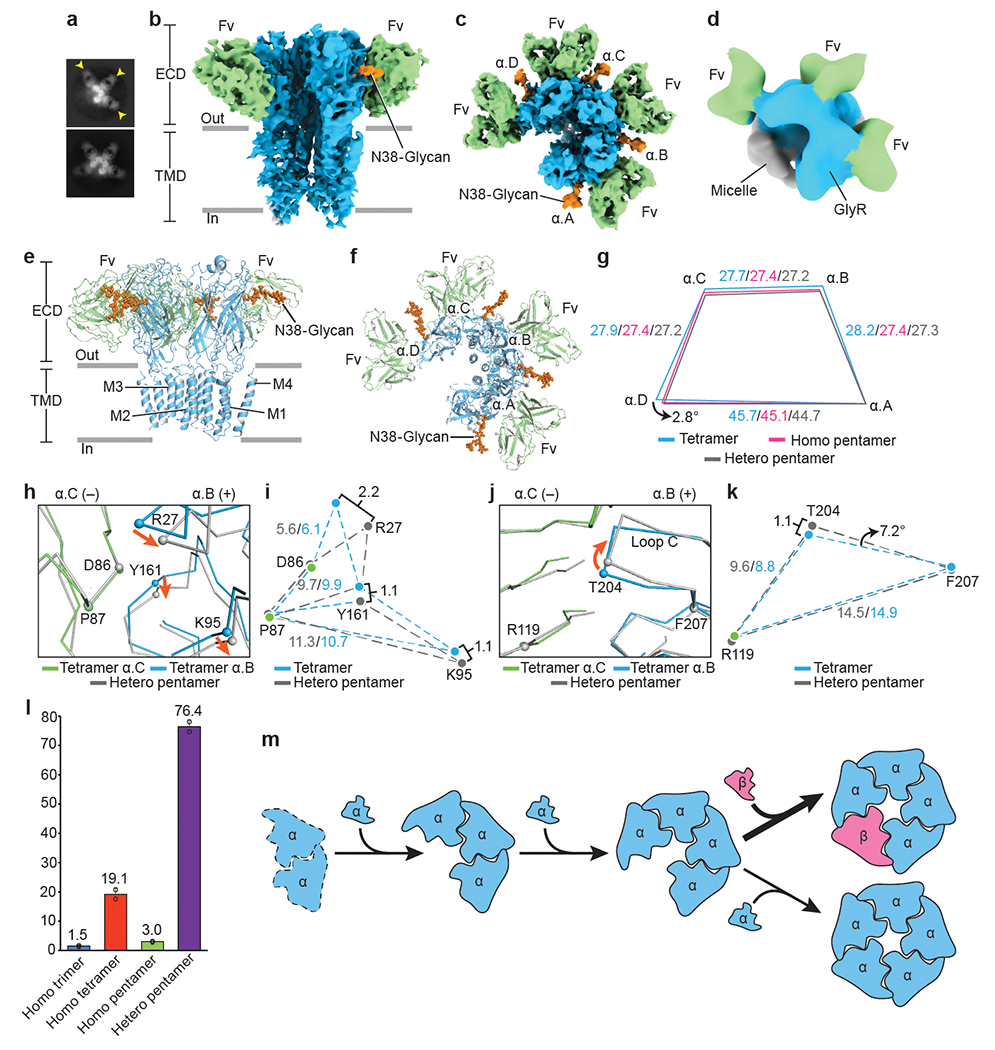
Glycine receptors (GlyRs) are pentameric, 'Cys-loop' receptors that form chloride-permeable channels and mediate fast inhibitory signalling throughout the central nervous system1,2. In the spinal cord and brainstem, GlyRs regulate locomotion and cause movement disorders when mutated2,3. However, the stoichiometry of native GlyRs and the mechanism by which they are assembled remain unclear, despite extensive investigation4-8. Here we report cryo-electron microscopy structures of native GlyRs from pig spinal cord and brainstem, revealing structural insights into heteromeric receptors and their predominant subunit stoichiometry of 4α:1β. Within the heteromeric pentamer, the β(+)-α(-) interface adopts a structure that is distinct from the α(+)-α(-) and α(+)-β(-) interfaces. Furthermore, the β-subunit contains a unique phenylalanine residue that resides within the pore and disrupts the canonical picrotoxin site. These results explain why inclusion of the β-subunit breaks receptor symmetry and alters ion channel pharmacology. We also find incomplete receptor complexes and, by elucidating their structures, reveal the architectures of partially assembled α-trimers and α-tetramers.


Conflict of interest statement

Competing Interests

The authors declare no competing interests.

Figures

Extended Data Fig. 1
Extended Data Fig. 1. Biochemistry results related with native GlyRs.
a, Flow chart for native GlyR purification. b, Representative SEC profile for native GlyR in complex with the 3D1 Fab. Inset shows a typical silver staining of sodium dodecyl sulphate-polyacrylamide gel electrophoresis of native GlyR sample for cryo-EM grid preparation. c, Results from mass spectrometry (See Methods for more details). The table shows the identified peptides within the sample and the corresponding proteins with their gene accession numbers. d, Western blot analysis of isolated native GlyR eluted from strychnine column using antibodies against α1, α2, and α3. Positive control is the membrane extracts from rat brain. The experiments were repeated two times with similar results. e, FSEC profiles for mixing of different concentration of recombinant homomeric α pentamer with 3D1 Fab. f-g, FSEC profiles for mixing of YFP-tagged homomeric α1 GlyR (f) and CFP-tagged β GlyR (g), respectively. h-j, Saturation binding of 3H strychnine to native GlyRs with 3D1 Fab (h), recombinant expressed pig heteromeric GlyRs with (i) and without 3D1 Fab (j), respectively. Results are the average of three replicates and the error bars represent standard error of the mean (SEM) (n=3). k-m, The competitive binding of glycine to native GlyRs with 3D1 Fab (k), recombinant expressed pig heteromeric GlyR with (l) and without 3D1 Fab (m), respectively. Results are the average of three replicates and the error bars represent SEM (n=3). The hot ligand used here is 3H strychnine.
Extended Data Fig. 2
Extended Data Fig. 2. 3D reconstruction of native GlyRs.
a, A typical cryo-EM micrograph for native GlyRs. The experiments were repeated three times with similar results. b, Selected 2D class averages for native GlyR-Fab complex. c, Flow chart for cryo-EM data analysis of native GlyRs. d, f, h, j, Local resolution maps for unsharpened heteromeric pentamer (d), homomeric α tetramer (f), locally refined ECD (h) and TMD map (j) of homomeric pentamer. e, g, i, k, FSC curves for heteromeric pentamer (e), homomeric α tetramer (g), locally refined ECD (i) and TMD map (k) of homomeric α pentamer.
Extended Data Fig. 3
Extended Data Fig. 3. Representative densities.
a-b, EM density segments for α.A (a) and β (b) subunits, respectively. The model is shown in carton representation. The density is shown in surface representation. c-d, Representative densities for light (c) and heavy chain (d) of 3D1 Fab. Regions are numbered. e-f, Representative densities for glycosylation on α.A (e) and β (f) subunits. g-i, Representative densities of the binding pockets formed by β(+)/α.A(−) (g), α.D(+)/β(−) (h) and α.B(+)/α.C(−) (i), respectively. The related key amino acids are labeled. j-k, Representative densities for transmembrane helices including M1, M2, M3 and M4 from β (j) and α.A (k), respectively. All of the isolated densities are contoured at 8σ.
Extended Data Fig. 4
Extended Data Fig. 4. Subunit identities and geometry of GlyR pentamers.
a-b, Comparison of isolated representative densities for α1 and β subunits contoured at 8σ. Two pairs of representative residues have been selected. These key amino acids are labeled. Black stars highlight the mismatched residues. c, Isolated densities with different amino acids between the α1 and α2 subunit from native heteromeric and homomeric pentamer maps contoured at 8σ, respectively. d, f, ECD (d) and TMD (f) of heteromeric pentamer shown in cartoon representation. The α subunits are colored in blue and β subunit is in salmon. The centers of mass for ECD and TMD are shown in green and orange, respectively. e, g, Schematic diagram illustrating the neighboring distances of centers of mass of heteromeric ECD (e) and TMD (g), respectively. h, i, Schematic diagram illustrating the neighboring distances of centers of mass of homomeric α1 pentamer ECD (h) and TMD (i), respectively. j, Top-down view of heteromeric GlyR-Fab complex. GlyRs are in cartoon representation, with N-glycans and lipids in sphere representation. 3D1 Fabs, α, β, N-glycans, ligands glycine and lipids are colored in green, blue, salmon, orange, purple and yellow, respectively. All of the distances are denoted in Å.
Extended Data Fig. 5
Extended Data Fig. 5. Binding of 3D1 Fab.
a, d, Side views of 3D1 Fab bound to the isolated α.A (a) and α.B subunit (d) in carton representation, respectively. b-c, e, Close-up view of the binding site of the region indicated in panel (a) and (d) viewed approximately parallel to the plane of the membrane. The key amino acids involved in interactions are shown in ball-stick representation. The potential hydrogen bonds, cation-π and π-π interactions are indicated in dashed lines. f, Side view of 3D1 Fab bound to the isolated β subunit in carton representation. g, Close-up view of the binding site of the region indicated in panel (f) viewed approximately parallel to the plane of the membrane.
Extended Data Fig. 6
Extended Data Fig. 6. Analysis associated with TMD.
a, Sequence alignment of M2 helices among GABAAR, GlyR and GluCl. Higher prime numbers approach ECD, lower prime numbers approach intracellular domain. The −2’ position is the first amino acid of M2 helix. Sequence alignment was performed by PROMALS3D. b-d, Isolated M2 helices bound with picrotoxin from GABAAR (b; PDB ID: 6HUG), GluCl (c; PDB ID: 3RI5) and homomeric GlyR (d; PDB ID: 6UD3). The important amino acids 6’T or 2’T interacting with picrotoxin are labeled. The M2 helices and picrotoxin are shown in cartoon and stick representation, respectively. e-f, Isolated M2 helices from native homomeric GlyR (e) and heteromeric GlyR (f), respectively. The 6’T and 6’F are shown in stick representation. The M2 helices are shown in cartoon representation. All distances are denoted in Å.
Extended Data Fig. 7
Extended Data Fig. 7. Structural metrics related with the interfaces.
a-c, View of the interface interactions of native homomeric α1 pentamer (see Fig. 2c–e). d, The summary of the buried areas for heteromeric pentamer, homomeric α tetramer and homomeric α1 pentamer. The areas are given in Å2. e, Top down view of heteromeric GlyR in surface and ribbon representation. The glycine molecules are shown in sphere representation. The α.A and α.D are in blue. The β subunit and α.C subunits are colored in salmon and lime, respectively. The boxed areas are enlarged in panels (f) to (h). f-h, Views of the binding pockets at α.D(+)/β(−) (f), α.B(+)/α.C(−) (g) and β(+)/α.A(−) (h) interfaces, respectively. The glycine molecules are shown in ball-stick representations with oxygen in red, nitrogen in blue and carbon in green. The possible hydrogen bonds and cation-pi interactions are shown as dashed lines. i, Superposition of the orthostatic binding sites. The binding sites are overlapped by the ECD of the principle side subunits. Orange arrows indicate the movement of loop C. j, Schematic diagram illustrating the relative positions of the amino acids in the binding pockets. The blue, pink, green and red polygon are created by the connection of the Cα atoms of these crucial amino acids at the β(+)/α.A(−), α.D(+)/β(−), α.B(+)/α.C(−) and native homomeric α(+)/α(−) interfaces, respectively. k-n, Schematic diagram illustrating the distances and angles related with the interfaces of Cys-loop family members including GABAAR (k, PDB ID: 6A96; l, PDB ID: 6DW1) and nAChR (m, PDB ID: 6CNJ; n, PDB ID: 6CNK; see Fig. 2f). The black star indicates the binding pocket bound with ligand. All distances are given in Å and the angles are given in degree.
Extended Data Fig. 8
Extended Data Fig. 8. Results related with assembly intermediates.
a-b, Representative FSEC profiles for recombinant expressed homomeric GlyR tagged with YFP (a) and heteromeric GlyR tagged with CFP on β subunit (b), respectively. Melting temperatures (Tm) were determined by fitting the curves to a sigmoidal dose-response equation. c, A typical cryo-EM micrograph for recombinant GlyRs. The experiments were repeated three times with similar results. d, 2D class averages for recombinant GlyRs bound with 3D1 Fabs. e-f, Top down and side views for the recombinant heteromeric GlyR map, respectively. g-h, Top down and side views for the recombinant homomeric GlyR map, respectively. i, Side view of isolated α.B-α.C dimer from tetramer. Subunits are shown in cartoon representation. α.B and α.C are colored in blue and lime, respectively. The boxed areas are enlarged in panel (j) and (l). j, l, Superposition of the interfaces in the upper ECD (j) and the region near loop C (l) of α.B(+)/α.C(−) interface from homomeric α tetramer, heteromeric pentamer and homomeric pentamer. Orange arrows indicate the displacements of the Cα atoms. k, m, Schematic diagram illustrating the relative positions of the amino acids of the homomeric pentamer and tetramer. All distances are given in Å.
Fig. 1.
Fig. 1.. Architecture of native heteromeric and homomeric GlyRs.
a, e, 2D class averages of heteromeric (a) and homomeric (e) GlyRs. Yellow arrows indicate bound 3D1 Fab. b, f, Side views of the sharpened cryo-EM maps of heteromeric (b) and homomeric (f) GlyRs. 3D1 Fabs, α, β, N-glycans and lipids are colored in green, blue, salmon, orange and yellow, respectively. The four α subunits in heteromeric GlyRs are denoted as α.A, α.B, α.C and α.D in counter clockwise direction viewed from ECD side. c, g, Side views of the atomic models of heteromeric (c) and homomeric (g) GlyRs, respectively. GlyRs are in cartoon representation, with N-glycans and lipids in sphere representation. Subunit coloring as in panels (b) and (f). d, Shape and size of the ion permeation pathway in the heteromeric GlyR. M2 helices from the α.B and β subunits are shown as cartoons and the side chains of pore-lining residues in ball-stick representation. Purple, green and red spheres define radii of > 3.3 Å, 1.8-3.3 Å, and < 1.8 Å, respectively. h, Profile of pore radii calculated by HOLE program for native heteromeric GlyR (blue), native homomeric α pentamer (purple) and open state homomeric α pentamer bound with glycine (PDB ID: 6PM6; pink). The Cα position of αArg252 in heteromeric GlyR is set to zero (0’). Figures for density maps and the corresponding models were generated by ChimeraX and Pymol.
Fig. 2.
Fig. 2.. Inter-subunit interactions.
a, b, Top-down (a) and side view (b) of native GlyR, respectively. Subunits β and α.D shown in surface and cartoon representation and the other three α subunits shown in cartoon representation. Red indicates potential hydrogen bonds. Yellow indicates amino acids located at the interfaces. β subunit is colored in salmon; α.A, α.B and α.D colored in blue; and α.C colored in lime. Boxed areas are enlarged in panel (c), (d) and (e). c-e, View of the interfaces in the upper ECD (c), loop C (d) and ECD-TMD region (e) of α.D(+)/β(−), β(+)/α.A(−) and α.B(+)/α.C(−) interfaces (left to right). (+) and (−) represent different sides of each subunit. Dashed lines indicate hydrogen bonds and salt-bridges. Side chains of key residues are in ball-stick representation with oxygen in red, nitrogen in blue. f, Schematic diagram illustrating the distances and angles associated with interfaces. Five red dots at the vertex of the pentagon indicate the center of masses of two adjacent subunits. The center orange dot indicates the center of mass of the ECD. The interfaces formed by the adjacent subunits are labeled near the orange dots. Coloring as in panel (a). Distances are given in Å and the angles in degrees. g, Schematic diagram illustrating the relative positions of the amino acids shown in panels (c) to (e). Orange, green and blue polygons are created by the connection of the Cα atoms of these highlighted amino acids at the α.D(+)/β(−), α.B(+)/α.C(−) and β(+)/α.A(−) interfaces, respectively. Polygons are aligned by the superposition of βY184 and αY161. Distances are given in Å.
Fig. 3.
Fig. 3.. Homomeric α assembly intermediates and model for GlyR assembly.
a, 2D class averages of homomeric α trimers and tetramers. Yellow arrows indicate bound 3D1 Fabs. b-c, Side (b) and top-down (c) views of homomeric α tetramer. 3D1 Fabs, α subunits and glycosylations colored in green, blue and orange, respectively. d, Top-down view of homomeric α trimer. Color coding as in panel (b). e-f, Side (e) and top-down (f) views of the atomic model of homomeric α tetramer in cartoon representation. Coloring as in panel (b). g, Schematic diagram illustrating changes in distances between α subunit centers of mass. Indicated values colored in blue, pink and grey are for homomeric tetramer, homomeric pentamer and heteromeric pentamer, respectively. All distances are denoted in Å. h, j, Superposition of the α.B(+)/α.C(−) interfaces from homomeric α tetramer and heteromeric pentamer. α.C subunit is in green and α.B in blue. Orange arrows indicate the movement of the Cα atoms. i, k, Schematic diagram illustrating the relative positions of amino acids shown in panel (h) and (j), respectively. All distances are given in Å. l, Bar plot showing particle distributions for each state (n=2). Percentage of particles is labeled above each bar. The corresponding data points were overlaid as black cycles. Data are presented as mean values +/− Standard Deviation (SD). m-q, Proposed model for GlyR assembly pathway. Dashed line in panel (m) indicates the missing structure. α and β subunits are colored in blue and salmon, respectively. Larger arrow before panel (p) indicates a higher probability.

References

Main References

    1. Legendre P The glycinergic inhibitory synapse. Cell Mol. Life Sci 58, 760–793 (2001). - PMC - PubMed
    1. Lynch JW Molecular structure and function of the glycine receptor chloride channel. Physiol. Rev 84, 1051–1095 (2004). - PubMed
    1. Shiang R et al. Mutations in the alpha 1 subunit of the inhibitory glycine receptor cause the dominant neurologic disorder, hyperekplexia. Nat. Gene.t 5, 351–358 (1993). - PubMed
    1. Grudzinska J et al. The beta subunit determines the ligand binding properties of synaptic glycine receptors. Neuron 45, 727–739 (2005). - PubMed
    1. Langosch D, Thomas L & Betz H Conserved quaternary structure of ligand-gated ion channels: the postsynaptic glycine receptor is a pentamer. Proc. Natl. Acad. Sci. U S A 85, 7394–7398 (1988). - PMC - PubMed

Method References

    1. Du J, Lu W, Wu S, Cheng Y & Gouaux E Glycine receptor mechanism elucidated by electron cryo-microscopy. Nature 526, 224–229 (2015). - PMC - PubMed
    1. Kawate T & Gouaux E Fluorescence-detection size-exclusion chromatography for precrystallization screening of integral membrane proteins. Structure 14, 673–681 (2006). - PubMed
    1. Goehring A et al. Screening and large-scale expression of membrane proteins in mammalian cells for structural studies. Nat. Protoc 9, 2574–2585 (2014). - PMC - PubMed
    1. Cook N, Harris A, Hopkins A & Hughes K Scintillation proximity assay (SPA) technology to study biomolecular interactions. Curr. Protoc. Protein Sci. Chapter 19, Unit 19.8 (2002). - PubMed
    1. Cheng Y & Prusoff WH Relationship between the inhibition constant (K1) and the concentration of inhibitor which causes 50 per cent inhibition (I50) of an enzymatic reaction. Biochem. Pharmacol 22, 3099–3108 (1973). - PubMed

Publication types