. 2021 Sep 23;9(1):33.
doi: 10.1186/s40170-021-00270-9.

Targeting MYC-enhanced glycolysis for the treatment of small cell lung cancer

Affiliations

Targeting MYC-enhanced glycolysis for the treatment of small cell lung cancer

Kasey R Cargill et al. Cancer Metab. .

Abstract

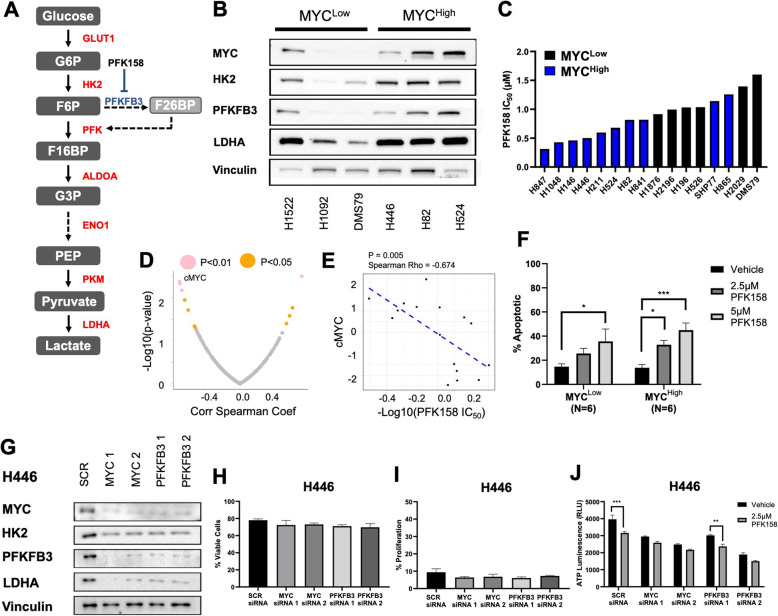
Introduction: The transcription factor MYC is overexpressed in 30% of small cell lung cancer (SCLC) tumors and is known to modulate the balance between two major pathways of metabolism: glycolysis and mitochondrial respiration. This duality of MYC underscores the importance of further investigation into its role in SCLC metabolism and could lead to insights into metabolic targeting approaches.

Methods: We investigated differences in metabolic pathways in transcriptional and metabolomics datasets based on cMYC expression in patient and cell line samples. Metabolic pathway utilization was evaluated by flow cytometry and Seahorse extracellular flux methodology. Glycolysis inhibition was evaluated in vitro and in vivo using PFK158, a small molecular inhibitor of PFKFB3.

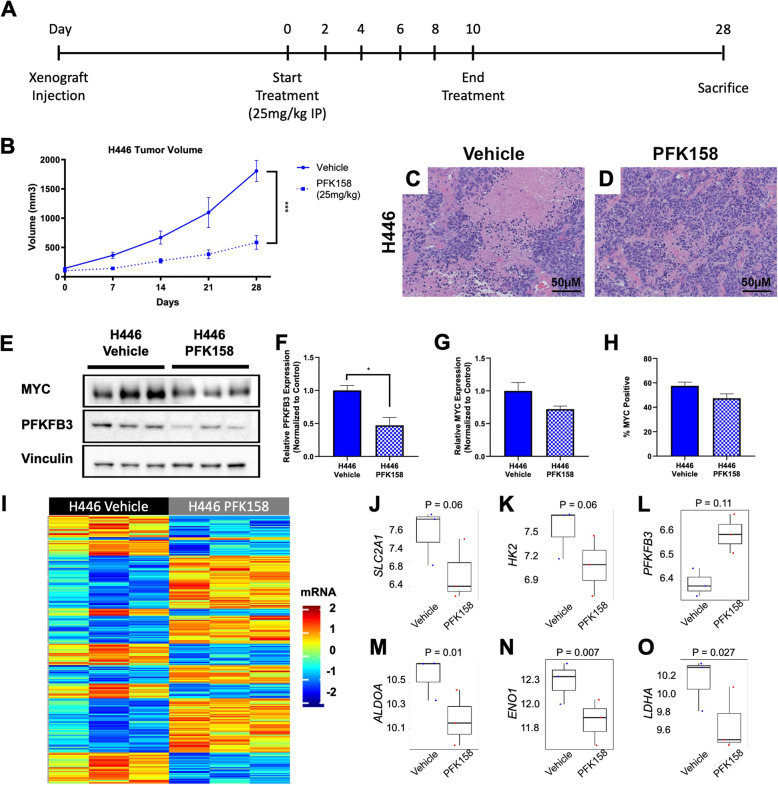
Results: MYC-overexpressing SCLC patient samples and cell lines exhibited increased glycolysis gene expression directly mediated by MYC. Further, MYC-overexpressing cell lines displayed enhanced glycolysis consistent with the Warburg effect, while cell lines with low MYC expression appeared more reliant on oxidative metabolism. Inhibition of glycolysis with PFK158 preferentially attenuated glucose uptake, ATP production, and lactate in MYC-overexpressing cell lines. Treatment with PFK158 in xenografts delayed tumor growth and decreased glycolysis gene expression.

Conclusions: Our study highlights an in-depth characterization of SCLC metabolic programming and presents glycolysis as a targetable mechanism downstream of MYC that could offer therapeutic benefit in a subset of SCLC patients.

Keywords: Glycolysis; MYC; Metabolism; PFK158; Small cell lung cancer.


Conflict of interest statement

L.A.B. serves on advisory committees for AstraZeneca, AbbVie, GenMab, BergenBio, Pharma Mar SA, Sierra Oncology, Merck, Bristol Myers Squibb, Genentech, and Pfizer and has research support from AbbVie, AstraZeneca, GenMab, Sierra Oncology, Tolero Pharmaceuticals. C.M.G. received research funding from AstraZeneca.

Figures

Fig. 1
Fig. 1
MYC directly upregulates glycolysis expression. A–C Bimodal MYC gene stratification of SCLC samples in the George et al., Gay et al., and Sato et al. datasets [11, 37, 38]. D Venn diagram showing the 266 upregulated gene commonalities among the three datasets. E Of the 266 upregulated genes, 36.9% can be linked to a metabolic process through Panther Gene Ontology Biological Pathway Analysis. F Similarly, several of the top GO terms generated by David Functional Enrichment Analysis are involved in central carbon and glucose metabolism. G and H Glycolysis genes HK2, PFKFB3, and LDHA exhibit increased expression in the MYCHigh subset of patient tumors [11] and cell lines [37], respectively. I HK2, PFKFB3, and LDHA protein expression by RPPA is also increased in MYCHigh cell lines. J ChIP-seq analysis of MYC (red) and H3K27Ac (blue) genomic binding at indicated gene loci from N = 4 RPM tumor samples. Arrows indicate directionality of the gene
Fig. 2
Fig. 2
PFK158 reduces ATP production and induces apoptosis. A The glycolysis pathway can be inhibited at the major rate-limiting step by targeting PFKFB3 with PFK158. B Validation of MYC, HK2, PFKFB3, and LDHA protein expression in a panel of MYCLow (H1522, H1092, DMS79) and MYCHigh (H446, H82, H524) cell lines. C Calculated IC50 based on ATP luminescence in MYCLow and MYCHigh cell lines. D 11 out of 210 proteins are significantly associated with PFK158 IC50. E cMYC is more highly expressed in cell lines with lower IC50 values. F Annexin V/PI staining in MYCLow cell lines (DMS79, H526, H196, H345, H2196, H1436) and MYCHigh cell lines (H211, H847, H1930, H446, H82, H841) shows percent of apoptotic cells. G Immunoblots of H446 cell line transfected with SCR siRNA, MYC siRNA, and PFKFB3 siRNA showing lower MYC, HK2, PFKFB3, and LDHA protein expression with vinculin loading control. H The percent of viable cells among siRNA-treated H446 cells is not significantly altered. I The percent proliferation cells among siRNA-treated H446 cells is not significantly altered. J ATP luminescence of siRNA knockdown H446 cells after 24 h of 2.5 μM PFK158 treatment. (*P < 0.05; **P < 0.01; ***P < 0.005)
Fig. 3
Fig. 3
MYCHigh cells are more glycolytic and sensitive to glycolysis inhibition. A Glucose uptake is higher in MYCHigh (H82, H446, H1048, H847) cell lines compared with MYCLow (DMS79, H345, H196, cell lines and is significantly decreased with PFK158 treatment. B RPM cells have higher glucose uptake compared with RP cells and is reduced with PFK158 treatment. C Similarly, extracellular lactate is higher in MYCHigh (H1930, H847, H524, H841, H446, H146, NJH29, H1048) cell lines compared with MYCLow (DMS79, H196, H526, H345, H2196, H1105) cell lines and reduced with PFK158 treatment. D Extracellular lactate is higher in RPM cell lines and reduced with PFK158 treatment. E Intracellular lactate significantly and positively correlates with LDHA expression (cell lines: NJH29, H1092, H446, H1436, H82, H1930, DMS79, H1048, H841, H526). F Glucose uptake in significantly lower in H446 cells treated with siRNA against MYC and PFKFB3 compared with a SCR negative control. G Extracellular lactate is significantly reduced in H446 cells treated with siRNA against MYC and PFKFB3 compared with a SCR negative control. H Based on the ECAR, glycolysis is significantly higher in the representative MYCHigh cell line H446 as compared with the representative MYCLow cell line DMS79. There were no changes in glycolysis in DMS79 cell treated with PFK158; however, glycolysis was significantly decreased in H446 cells treated with PFK158. I Acid produced by non-glycolytic pathways was significantly higher in DMS79 cells regardless of treatment. J The level of oligomycin-stimulated glycolysis indicative of forced glycolytic utilization is significantly lower in PFK158-treated H446 cells (*P < 0.05; **P < 0.01; ***P < 0.005; ****P < 0.001)
Fig. 4
Fig. 4
PFK158-treated MYCHighcells do not increase oxidative respiration mechanisms. A Seahorse extracellular flux mito stress test monitored the oxygen consumption rate after the administration of oligomycin, FCCP, and rotenone and antimycin A. B Basal oxygen consumption is significantly reduced in H446 cells compared with DMS79. In H446 cells treated with PFK158, basal oxygen consumption is also significantly reduced compared with untreated cells. C Maximal oxygen consumption is significantly reduced in H446 cells compared with DMS79. In H446 cells treated with PFK158, maximal oxygen consumption is also significantly reduced compared with untreated cells. D Mitochondria-generated ATP is significantly reduced in H446 cells compared with DMS79. In H446 cells treated with PFK158, ATP is also significantly reduced based on untreated cells. E Proton leak is unchanged between DMS79 and H446 cells, but significantly reduced in H446 cells treated with PFK158. F Coupling efficiency is significantly reduced in H446 cells compared with DMS79. In H446 cells treated with PFK158, coupling efficiency is also significantly reduced compared with untreated cells. G Spare respiratory capacity is unchanged between DMS79 and H446 cells, but significantly reduced in H446 cells treated with PFK158. H Reactive oxygen species (ROS) generation is significantly increased in MYCHigh (H446, H524, H146, H211, H1048, H841) cells treated with PFK158 compared with MYCLow (DMS79, H196, H526, H345) cells. I The mitochondrial membrane potential is significantly reduced in MYCHigh (H446, H524, H146, H211) cells treated with PFK158 compared with MYCLow (DMS79, H196, H526, H345) cells. J There are no differences in mitochondrial content regardless of MYC status or treatment; MYCLow cell lines: DMS79, H196, H526; MYCHigh cell lines: H446, H524, H146, H211, H1048, H841, H82, H865 (*P < 0.05; **P < 0.01; ***P < 0.005; ****P < 0.001)
Fig. 5
Fig. 5
PFK158 reduces tumor growth in a MYCHigh xenograft model. A H446 xenografts were given 25 mg/kg PFK158 by intraperitoneal injection every other day for 10 days. B PFK158-treated animals exhibited a significant delay in tumor growth. C and D H&E staining showing that PFK158-treated animals have less necrotic tissue. E Immunoblot against MYC and PFKFB3 with loading control Vinculin. F PFKFB3 expression was significantly reduced in H446 tumors from animals treated with PFK158. G and H MYC expression was lower but not significantly so in tumors regardless of PFK158 treatment when evaluated by immunoblotting or flow cytometry, respectively. I Heatmap showing transcriptional expression changes between H446 tumors treated with vehicle or PFK158. J–L SLC2A1, HK2, and PFKFB3 gene expression are not significantly altered following PFK158 treatment. M–O Downstream glycolysis enzyme genes ALDOA, ENO1, and LDHA are significantly lower following PFK158 treatment. (*P < 0.05; ***P < 0.005)

References

    1. N H, AM N, M K, D M, A B, M Y et al. SEER Cancer Statistics Review (CSR) 1975-2016. Bethesda: National Cancer Institute; 2019.
    1. Society AC. Cancer Facts and Figures 2019. Atlanta: American Cancer Society; 2019.
    1. Horn L, Mansfield AS, Szczesna A, Havel L, Krzakowski M, Hochmair MJ, et al. First-line atezolizumab plus chemotherapy in extensive-stage small-cell lung cancer. N Engl J Med. 2018;379(23):2220–2229. doi: 10.1056/NEJMoa1809064. - DOI - PubMed
    1. Institute NC . Scientific framework for small cell lung cancer (SCLC) 2014.
    1. Inamura K. Lung cancer: understanding its molecular pathology and the 2015 WHO classification. Front Oncol. 2017;7:193. doi: 10.3389/fonc.2017.00193. - DOI - PMC - PubMed

LinkOut - more resources