. 2021 Nov 23;97(21):e2065-e2078.
doi: 10.1212/WNL.0000000000012853. Epub 2021 Sep 23.

CSF Synaptic Biomarkers in the Preclinical Stage of Alzheimer Disease and Their Association With MRI and PET: A Cross-sectional Study

Collaborators, Affiliations

CSF Synaptic Biomarkers in the Preclinical Stage of Alzheimer Disease and Their Association With MRI and PET: A Cross-sectional Study

Marta Milà-Alomà et al. Neurology. .

Abstract

Background and objectives: To determine whether CSF synaptic biomarkers are altered in the early preclinical stage of the Alzheimer continuum and associated with Alzheimer disease (AD) risk factors, primary pathology, and neurodegeneration markers.

Methods: This cross-sectional study was performed in the Alzheimer's and Families (ALFA+) cohort, comprising middle-aged cognitively unimpaired participants. CSF neurogranin and growth-associated protein-43 (GAP-43) were measured with immunoassays, and synaptosomal-associated protein-25 (SNAP-25) and synaptotagmin-1 were measured with immunoprecipitation mass spectrometry. AD CSF biomarkers β-amyloid (Aβ)42/40, phosphorylated tau (p-tau), and total tau and the neurodegeneration biomarker neurofilament light chain (NfL) were also measured. Participants underwent structural MRI and fluorodeoxyglucose and Aβ PET imaging. General linear modeling was used to test the associations between CSF synaptic biomarkers and risk factors, Aβ pathology, tau pathology, and neurodegeneration markers.

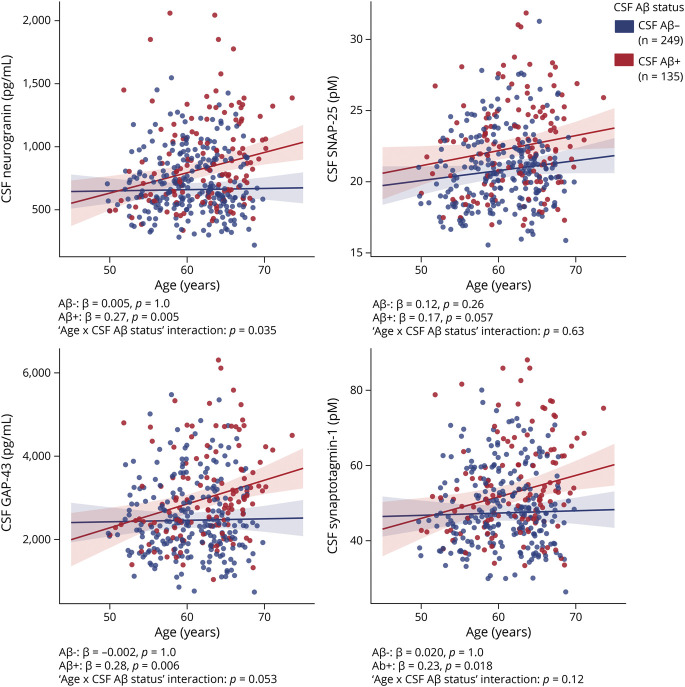
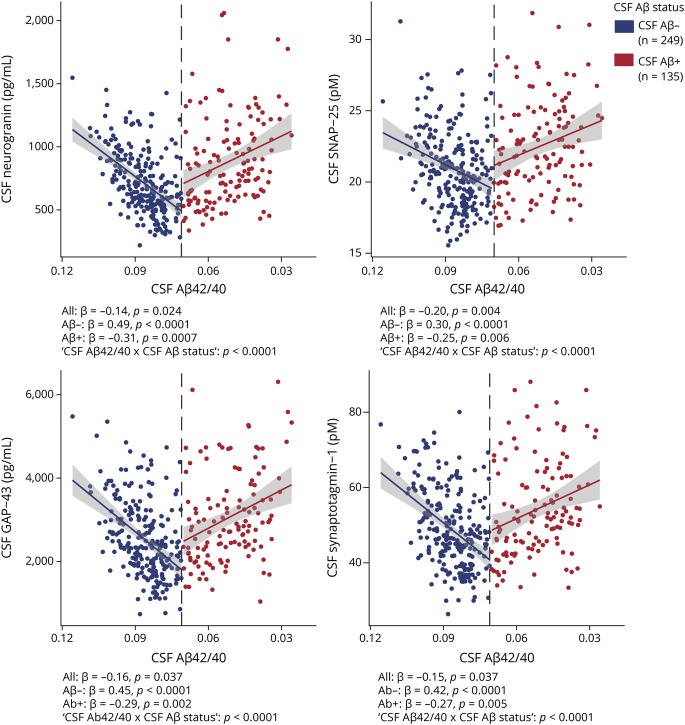
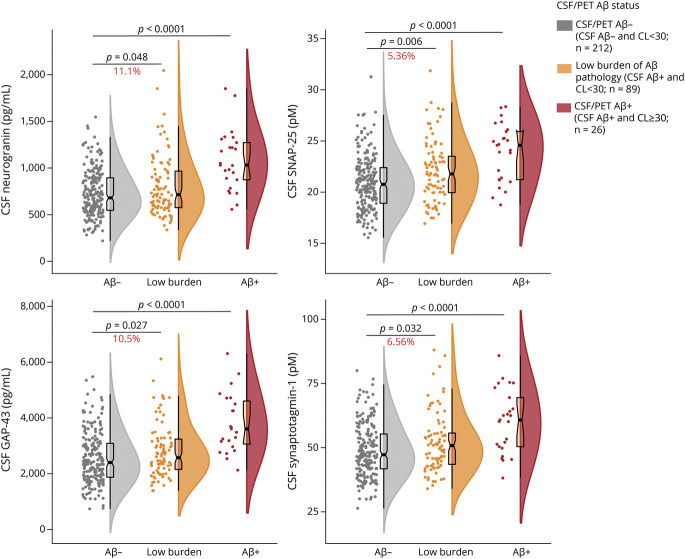
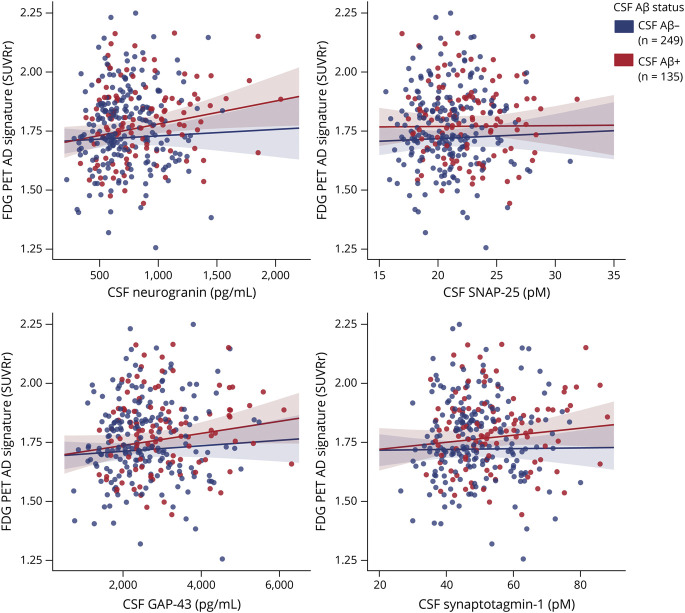
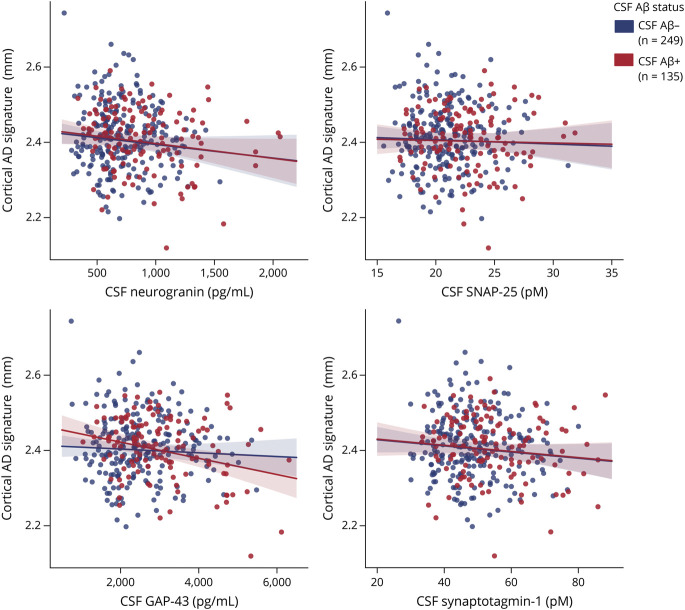
Results: All CSF synaptic biomarkers increased with age. CSF neurogranin was higher in females, while CSF SNAP-25 was higher in APOE ε4 carriers. All CSF synaptic biomarkers increased with higher Aβ load (as measured by CSF Aβ42/40 and Aβ PET Centiloid values), and it is important to note that the synaptic biomarkers were increased even in individuals in the earliest stages of Aβ deposition. Higher CSF synaptic biomarkers were also associated with higher CSF p-tau and NfL. Higher CSF neurogranin and GAP-43 were significantly associated with higher brain metabolism but lower cortical thickness in AD-related brain regions.

Discussion: CSF synaptic biomarkers increase in the early preclinical stages of the Alzheimer continuum even when a low burden of Aβ pathology is present, and they differ in their association with age, sex, APOE ε4, and markers of neurodegeneration.

Trial registration information: ClinicalTrials.gov Identifier NCT02485730.


Figures

Figure 1
Figure 1. Association of CSF Synaptic Biomarkers With Age
Scatterplots representing the association of each of the CSF synaptic biomarkers with age in the CSF β-amyloid (Aβ)–negative (A−; blue) and the Aβ-positive (A+; red) groups. CSF Aβ status was defined by the CSF Aβ42/40 ratio and participants were classified as CSF Aβ-positive if CSF Aβ42/40 <0.071. Each point depicts the value of the CSF biomarker of an individual, and the solid lines indicate the regression line for each of the groups. The standardized regression coefficients (β) and p values are shown and were computed using a linear model adjusting for sex. In addition, the age × CSF Aβ status interaction term was computed. All p values are corrected for multiple comparisons with the false discovery rate approach. GAP-43 = growth-associated protein-43; SNAP-25 = synaptosomal-associated protein-25.
Figure 2
Figure 2. Association of CSF Synaptic Biomarkers With CSF Aβ Pathology
Scatterplots representing the association of each CSF synaptic biomarker with CSF β-amyloid (Aβ)42/40 in the CSF Aβ-negative (A−; blue) and Aβ-positive (A+; red) groups. Each point depicts the value of the CSF biomarker of an individual, and the solid lines indicate the regression line for each of the groups. The x-axis is reversed. The vertical dashed line indicates the cutoff for CSF Aβ42/40 positivity of 0.071. The standardized regression coefficients (β) and the p values for the total and stratified analyses are shown and were computed with a linear model adjusting for age and sex. In addition, the CSF Aβ42/40 × CSF Aβ status interaction term was computed. All p values are corrected for multiple comparisons with the false discovery rate approach. GAP-43 = growth-associated protein-43; SNAP-25 = synaptosomal-associated protein-25.
Figure 3
Figure 3. CSF Synaptic Biomarkers by CSF/PET Aβ Status
Boxplots depicting the median (horizontal bar), interquartile range (IQR; hinges), and 1.5 IQR (whiskers). Group differences were assessed by a 1-way analysis of covariance adjusted by age and sex, followed by Dunnett-corrected post hoc pair-wise comparisons. The percentage of change between the low-burden group and the CSF/PET β-amyloid (Aβ)–negative group is shown. eTable 3 (doi.org/10.5061/dryad.vdncjsxv4) shows the demographics of the 3 groups compared. All p values are corrected for multiple comparisons with the false discovery rate approach. GAP-43 = growth-associated protein-43; SNAP-25 = synaptosomal-associated protein-25.
Figure 4
Figure 4. Association of CSF Synaptic Biomarkers With FDG PET AD Signature
Scatterplots representing the association of each of the CSF synaptic biomarker with FDG PET uptake (standardized uptake value ratio) Alzheimer disease (AD) signature in the CSF β-amyloid (Aβ)–negative (A−; blue) and the CSF Aβ-positive (A+; red) groups. CSF Aβ status was defined by the CSF Aβ42/40 ratio, and participants were classified as CSF Aβ-positive if CSF Aβ42/40 <0.071. Each point depicts the value of the CSF biomarker of an individual, and the solid lines indicate the regression line for each of the groups. The associations were computed with a linear model adjusted for age and sex. GAP-43 = growth-associated protein-43; SNAP-25 = synaptosomal-associated protein-25.
Figure 5
Figure 5. Association of CSF Synaptic Biomarkers With Cortical MRI AD Signature
Scatter plots representing the association of each of the CSF synaptic biomarker with the cortical thickness (millimeters) Alzheimer disease (AD) signature in the CSF β-amyloid (Aβ)–negative (A−; blue) and the CSF Aβ-positive (A+; red) groups. CSF Aβ status was defined by the CSF Aβ42/40 ratio, and participants were classified as CSF Aβ-positive if CSF Aβ42/40 <0.071. Each point depicts the value of the CSF biomarker of an individual, and the solid lines indicate the regression line for each of the groups. The associations were computed with a linear model adjusted for age and sex. GAP-43 = growth-associated protein-43; SNAP-25 = synaptosomal-associated protein-25.

References

    1. Selkoe DJ. Alzheimer's disease is a synaptic failure. Science. 2002;298(5594):789-791. - PubMed
    1. Arendt T. Synaptic degeneration in Alzheimer's disease. Acta Neuropathol. 2009;118(1):167-179. - PubMed
    1. DeKosky ST, Scheff SW. Synapse loss in frontal cortex biopsies in Alzheimer's disease: correlation with cognitive severity. Ann Neurol. 1990;27(5):457-464. - PubMed
    1. Camporesi E, Nilsson J, Brinkmalm A, et al. . Fluid biomarkers for synaptic dysfunction and loss. Biomark Insights. 2020;15:1177271920950319.. - PMC - PubMed
    1. Wellington H, Paterson RW, Portelius E, et al. . Increased CSF neurogranin concentration is specific to Alzheimer disease. Neurology. 2016;86(9):829-835. - PMC - PubMed

Publication types

Associated data