. 2021 Sep 23;12(10):864.
doi: 10.1038/s41419-021-04151-3.

TNF-α synergises with IFN-γ to induce caspase-8-JAK1/2-STAT1-dependent death of intestinal epithelial cells

Affiliations

TNF-α synergises with IFN-γ to induce caspase-8-JAK1/2-STAT1-dependent death of intestinal epithelial cells

Jerzy A Woznicki et al. Cell Death Dis. .

Abstract

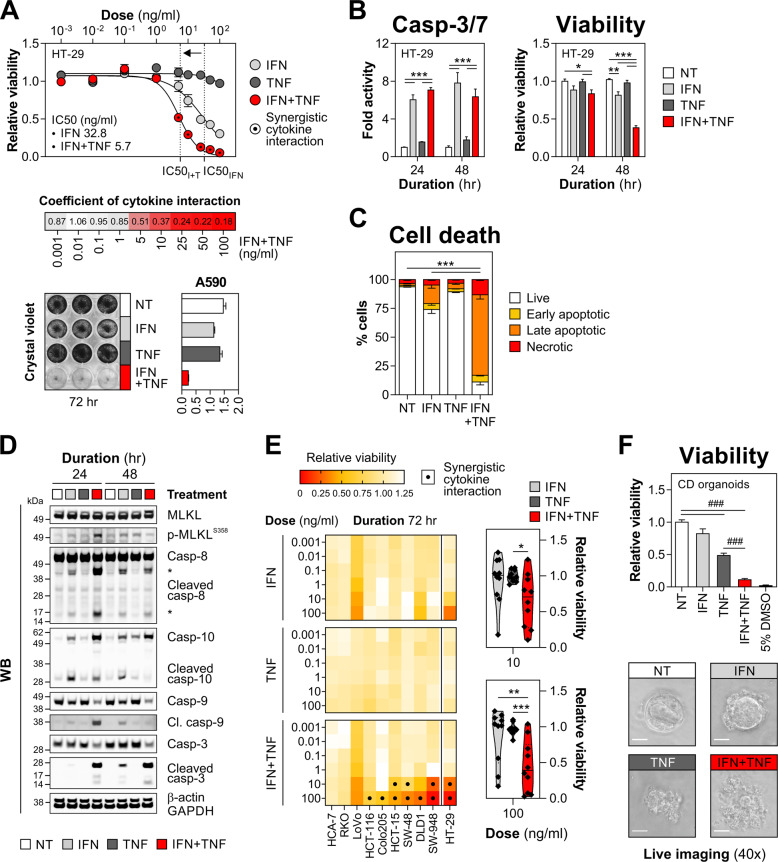
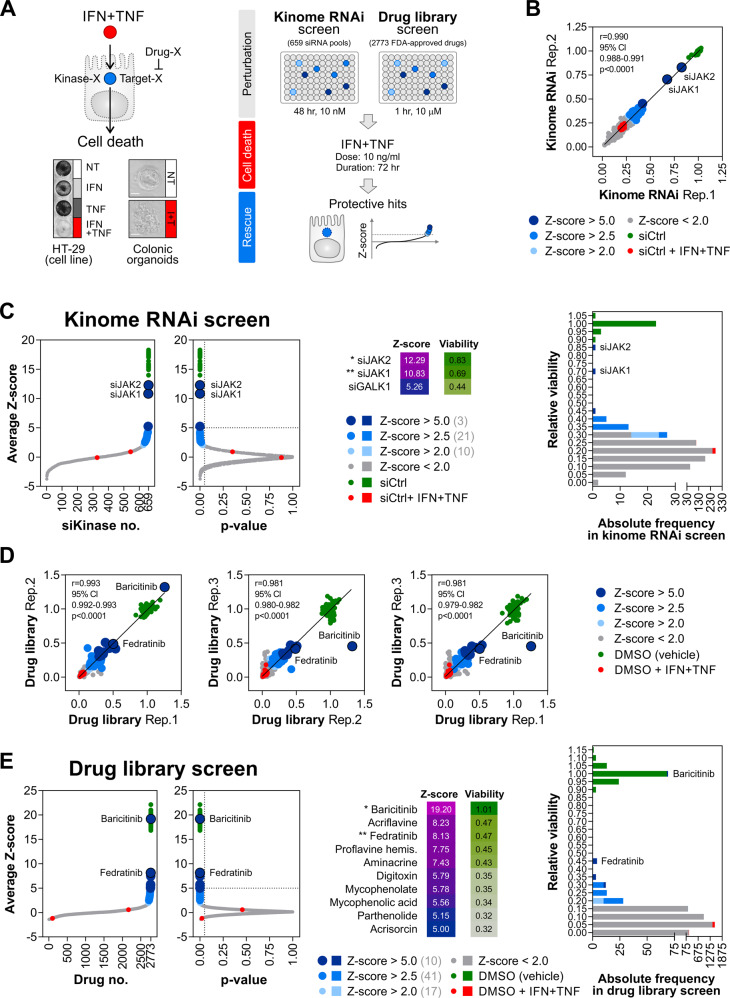
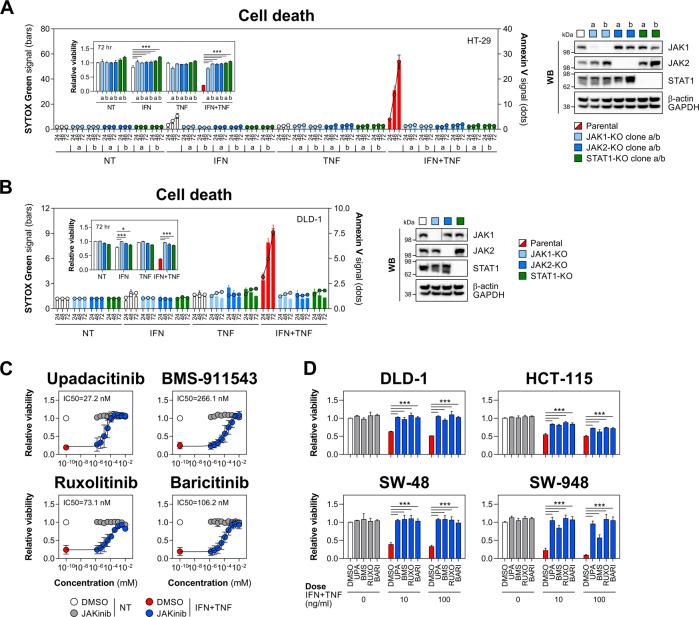
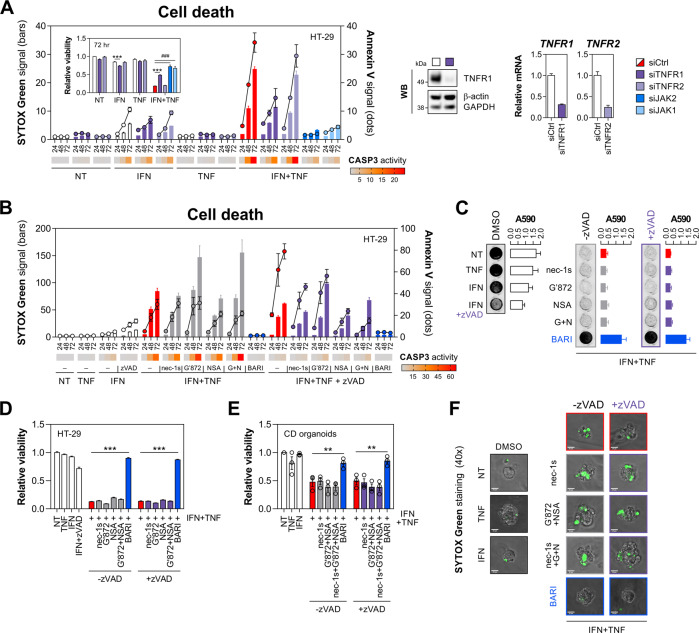
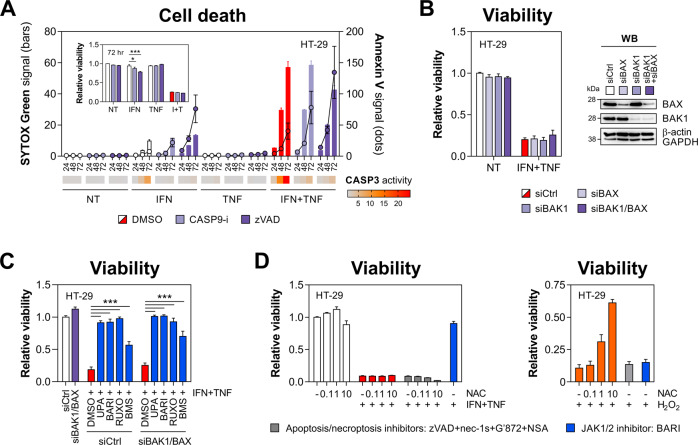
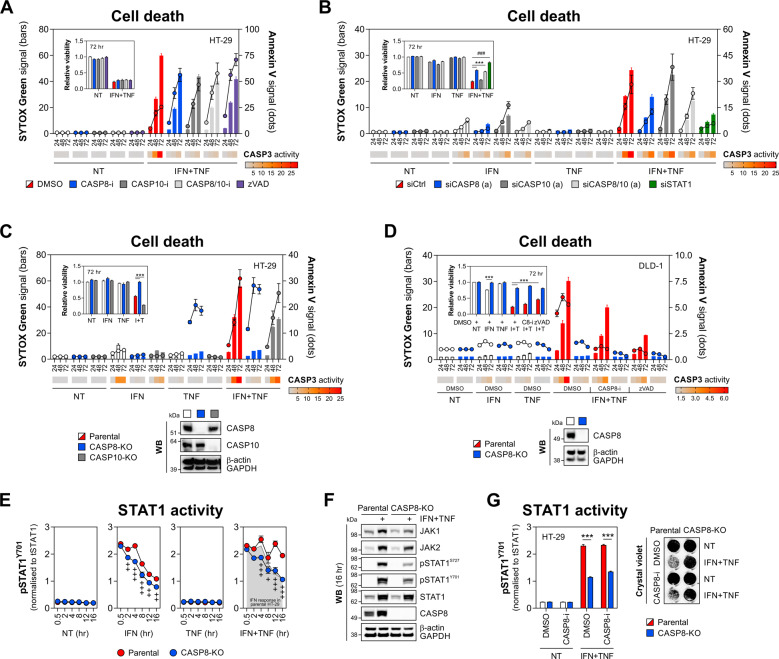
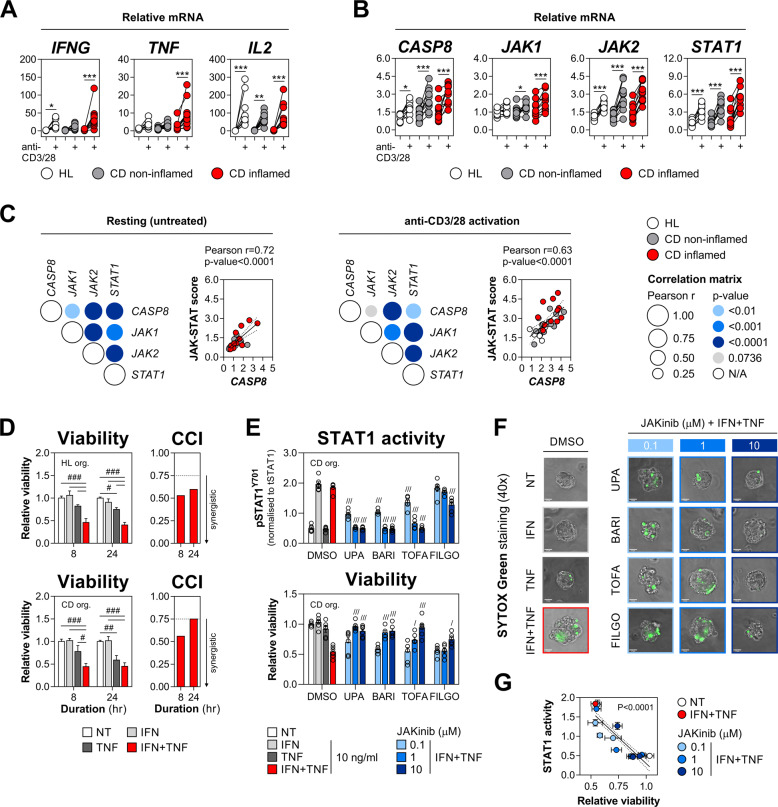
Rewiring of host cytokine networks is a key feature of inflammatory bowel diseases (IBD) such as Crohn's disease (CD). Th1-type cytokines-IFN-γ and TNF-α-occupy critical nodes within these networks and both are associated with disruption of gut epithelial barrier function. This may be due to their ability to synergistically trigger the death of intestinal epithelial cells (IECs) via largely unknown mechanisms. In this study, through unbiased kinome RNAi and drug repurposing screens we identified JAK1/2 kinases as the principal and nonredundant drivers of the synergistic killing of human IECs by IFN-γ/TNF-α. Sensitivity to IFN-γ/TNF-α-mediated synergistic IEC death was retained in primary patient-derived intestinal organoids. Dependence on JAK1/2 was confirmed using genetic loss-of-function studies and JAK inhibitors (JAKinibs). Despite the presence of biochemical features consistent with canonical TNFR1-mediated apoptosis and necroptosis, IFN-γ/TNF-α-induced IEC death was independent of RIPK1/3, ZBP1, MLKL or caspase activity. Instead, it involved sustained activation of JAK1/2-STAT1 signalling, which required a nonenzymatic scaffold function of caspase-8 (CASP8). Further modelling in gut mucosal biopsies revealed an intercorrelated induction of the lethal CASP8-JAK1/2-STAT1 module during ex vivo stimulation of T cells. Functional studies in CD-derived organoids using inhibitors of apoptosis, necroptosis and JAKinibs confirmed the causative role of JAK1/2-STAT1 in cytokine-induced death of primary IECs. Collectively, we demonstrate that TNF-α synergises with IFN-γ to kill IECs via the CASP8-JAK1/2-STAT1 module independently of canonical TNFR1 and cell death signalling. This non-canonical cell death pathway may underpin immunopathology driven by IFN-γ/TNF-α in diverse autoinflammatory diseases such as IBD, and its inhibition may contribute to the therapeutic efficacy of anti-TNFs and JAKinibs.


Conflict of interest statement

K.N. and F.S. are in receipt of research funding from AbbVie Inc. in the context of a research centre spoke award (SFI-14/SP/2710) to APC Microbiome Ireland. B.L.M. is an employee and shareholder of AbbVie Inc.

Figures

Fig. 1
Fig. 1. IFN-γ synergises with TNF-α to kill IECs in a dose-dependent manner.
A HT-29 cells were treated with increasing concentrations of IFN-γ and/or TNF-α for 72 h. Relative viability, including absolute IC50 values (top) and a heat map of viability-based coefficients of cytokine interaction (middle). Crystal violet staining and its absorbance quantification (A590 nm) at 10 ng/ml cytokine dose (bottom). BD HT-29 cells were treated with IFN-γ and/or TNF-α (10 ng/ml each) for the indicated times. B Caspase-3/7 activity and relative viability of HT-29 cells measured at 24 and 48 h. C HT-29 cells were stained for active caspase-3 and fixable viability dye FVS660 at 72 h, analysed by flow cytometry and percentages of live/dying cells were quantified. Data were mean ± SEM of n = 2 independent experiments. D Western blots showing levels of MLKL (total and S358-phosphorylated) and CASP3/8/9/10 (total and cleaved) in HT-29 cells treated as indicated for 24 and 48 h. E Colonic cell lines were treated with increasing concentrations of IFN-γ and/or TNF-α for 72 h. Heat maps showing relative viability in each line (left) and a combined viability score across the cell line panel (including HT-29 data, extracted from section (A)) for the indicated cytokine doses (right). F Primary human colonic organoids derived from Crohn’s disease (CD) colonic biopsies (n = 3 lines) were treated with IFN-γ and/or TNF-α (10 ng/ml each) or 5% DMSO for 72 h. Relative viability (top) and representative live images of a select organoid line (bottom). Unless specified otherwise, data were mean ± SEM of n = 3 independent experiments. *p < 0.05, **p < 0.01 and ***p < 0.001 (two-way ANOVA with Tukey’s multiple comparisons test), ###p < 0.001 (one-way ANOVA with Tukey’s multiple comparisons). NT non-treated.
Fig. 2
Fig. 2. Functional screening identifies JAK1/2 as key drivers of IEC death induced by IFN-γ/TNF-α.
A Schematic workflow of the kinome RNAi and drug library rescue screens performed in HT-29 cells against a fixed cell death trigger: IFN-γ/TNF-α, 72 h, 10 ng/ml each. B Interreplicate reproducibility in the kinome RNAi screen. C Z-score distribution and its associated p values across the kinome RNAi library (left). Average relative viability for candidate genes with Z-score >5.0 (middle). Frequency distribution of average relative viability across the kinome RNAi library (right). D Interreplicate reproducibility in the drug library screen. E Z-score distribution and its associated p values across the drug library (left). Average relative viability for candidate drugs with Z-score >5.0 (middle). Frequency distribution of average relative viability across the drug library (right).
Fig. 3
Fig. 3. JAK1/2 inhibition protects IECs from IFN-γ/TNF-α.
A Parental, JAK1, JAK2 or STAT1 knockout HT-29 cells were treated with IFN-γ and/or TNF-α (10 ng/ml each) for up to 72 h. SYTOX Green/Annexin V signals were recorded at indicated times, and relative viability was measured at 72 h (inner graph). Two knockout clones per each target (labelled as 'a' and 'b') were generated. Western blot validation of target knockout (right). B Parental, JAK1, JAK2 or STAT1 knockout DLD-1 cells were treated with IFN-γ and/or TNF-α (100 ng/ml each) for up to 72 h. SYTOX Green/Annexin V signals were recorded at indicated times, and relative viability was measured at 72 h (inner graph). Western blot validation of target knockout (right). C Relative viability of HT-29 cells pretreated for 1 h with vehicle (DMSO), JAK1-selective compound (upadacitinib), JAK2-selective compound (BMS-911543) or dual JAK1/2 inhibitors (ruxolitinib or baricitinib) starting at 10 μM with threefold dilutions down to 1.52 nM, followed by IFN-γ/TNF-α (10 ng/ml each) for 72 h. Data were mean ± SD of n = 3 independent experiments. D Relative viability of DLD-1, HCT-115, SW-48 and SW-948 cells pretreated for 1 h with DMSO or the indicated JAK inhibitors (1 μM each), followed by IFN-γ/TNF-α (10 or 100 ng/ml each) for 72 h. Unless specified otherwise, data were mean ± SEM of n = 3 independent experiments. *p < 0.05 and ***p < 0.001 (two-way ANOVA with Tukey’s multiple comparisons test). NT non-treated, KO knockout, JAKinib JAK inhibitor, UPA upadacitinib, BMS BMS-911543, RUXO ruxolitinib, BARI baricitinib.
Fig. 4
Fig. 4. IFN-γ and TNF-α kill IECs through non-canonical TNFR1 signalling.
A HT-29 cells were transfected with a nontargeting siRNA (siCtrl), siTNFR1, siTNFR2 or positive control siRNA’s (siJAK1, siJAK2), followed by IFN-γ/TNF-α (10 ng/ml each). SYTOX Green/Annexin V signals and caspase-3 activity (heatmap) were recorded at indicated times, and relative viability was measured at 72 h (inner graph). Western blot and RT-qPCR validation of TNFR1/2 knockdown (right). BD HT-29 cells were pretreated for 1 h with vehicle (DMSO), RIPK1 inhibitor (necrostatin-1s, 10 μM), RIPK3 inhibitor (GSK′872, 10 μM), MLKL inhibitor (NSA, 1 μM), dual JAK1/2 inhibitor (baricitinib, 10 μM) alone or in combination with a pan-caspase inhibitor (zVAD, 20 μM), followed by IFN-γ/TNF-α (10 ng/ml each). B SYTOX Green/Annexin V signals and caspase-3 activity (heatmap) were recorded at indicated times. C Crystal violet staining and its absorbance quantification (A590 nm) at 72 h. D Relative viability measured at 72 h. E, F Primary human colonic organoids derived from CD colonic biopsies (n = 3 lines) were pretreated for 30 min with the indicated inhibitors (concentrations as in section B), followed by IFN-γ/TNF-α (10 ng/ml each). E Relative viability and F SYTOX Green staining were assayed at 8 h after cytokine treatment. Data were mean ± SEM of n = 3 independent experiments. **p < 0.01 and ***p < 0.001 (two-way ANOVA with Tukey’s multiple comparisons test), ###p < 0.001 (unpaired t-test). NT non-treated, nec-1s necrostatin-1s, G′872 GSK′872, G + N GSK′872 + NSA, BARI baricitinib.
Fig. 5
Fig. 5. IFN-γ and TNF-α kill IECs independently of mitochondrial apoptosis regulators.
A HT-29 cells were pretreated for 1 h with DMSO, caspase-9 inhibitor (Z-LEHD, 10 μM) or zVAD (20 μM), followed by IFN-γ/TNF-α (10 ng/ml each). SYTOX Green/Annexin V signals and caspase-3 activity (heatmap) were recorded at indicated times, and relative viability was measured at 72 h (inner graph). B Relative viability of HT-29 cells transfected with siCtrl, siBAK1 or siBAX, followed by IFN-γ/TNF-α (10 ng/ml each) for 72 h (left). Western blot validation of BAK1/BAX knockdown (right). C Relative viability of HT-29 cells transfected with siCtrl or siBAK1/BAX, subsequently pretreated for 1 h with DMSO, JAK1-selective compound (upadacitinib), JAK2-selective compound (BMS-911543) or dual JAK1/2 inhibitors (ruxolitinib or baricitinib) at 1 μM, followed by IFN-γ/TNF-α (10 ng/ml each) for 72 h. D Relative viability of HT-29 cells pretreated for 1 h with DMSO, baricitinib (1 μM) or a cocktail of apoptosis/necroptosis inhibitors (necrostatin-1s (10 μM), GSK′872 (10 μM), NSA (1 μM) and zVAD (20 μM)) and increasing concentrations of N-acetylcysteine (NAC, 0.1, 1 and 10 mM), followed by (left) IFN-γ/TNF-α (10 ng/ml each) or (right) H2O2 (1 mM) for 72 h. Data were mean ± SEM of n = 3 independent experiments. *p < 0.05 and ***p < 0.001 (two-way ANOVA with Tukey’s multiple comparisons test). NT non-treated, nec-1s necrostatin-1s, G′872 GSK′872, CASP9-i caspase-9 inhibitor, UPA upadacitinib, BARI baricitinib, RUXO ruxolitinib, BMS BMS-911543, NAC N-acetylcysteine.
Fig. 6
Fig. 6. Caspase-8 nonenzymatic function is required for IEC killing by IFN-γ/TNF-α.
A HT-29 cells were pretreated for 1 h with vehicle (DMSO), caspase-8 inhibitor (Z-IETD, 10 μM), caspase-10 inhibitor (Z-AEVD, 10 μM) or zVAD (20 μM), followed by IFN-γ/TNF-α (10 ng/ml each). SYTOX Green/Annexin V signals and caspase-3 activity (heatmap) were recorded at indicated times, and relative viability was measured at 72 h (inner graph). B HT-29 cells were transfected with a nontargeting siRNA (siCtrl), siCASP8, siCASP10 or a positive control siRNA (siSTAT1), followed by IFN-γ/TNF-α (10 ng/ml each) for 72 h. SYTOX Green/Annexin V signals and caspase-3 activity (heatmap) were recorded at indicated times, and relative viability was measured at 72 h (inner graph). For both targets, siRNA’s 'a' were used. C Parental, CASP8 or CASP10 knockout HT-29 cells were treated with IFN-γ/TNF-α (10 ng/ml each). SYTOX Green/Annexin V signals and caspase-3 activity (heatmap) were recorded at indicated times, and relative viability was measured at 72 h (inner graph). Western blot validation of CASP8/10 knockout (bottom). D Parental or CASP8 knockout DLD-1 cells were pretreated for 1 h with vehicle (DMSO), caspase-8 inhibitor (Z-IETD, 10 μM) or zVAD (20 μM), followed by IFN-γ/TNF-α (10 ng/ml each). SYTOX Green/Annexin V signals and caspase-3 activity (heatmap) were recorded at indicated times, and relative viability was measured at 72 h (inner graph). Western blot validation of CASP8 knockout (bottom). E STAT1 activity was measured by HTRF assay in parental and CASP8 knockout HT-29 treated with IFN-γ and/or TNF-α (10 ng/ml each) for indicated times. F Western blot analysis of JAK1/2, STAT1 (total, Y701- and S727-phosphorylated) and CASP8 expression in parental and CASP8 knockout HT-29 treated with IFN-γ/TNF-α (10 ng/ml each) for 16 h. G STAT1 activity at 16 h measured by HTRF assay (left), and crystal violet staining at 72 h (right) in parental and CASP8 knockout HT-29 pretreated for 1 h with DMSO or caspase-8 inhibitor (Z-IETD, 10 μM), followed by IFN-γ/TNF-α (10 ng/ml each). Data were mean ± SEM of n = 3 independent experiments. ***p < 0.001 (two-way ANOVA with Tukey’s multiple comparisons test), +p < 0.05, ++p < 0.01 and +++p < 0.001 (two-way ANOVA with Bonferroni’s multiple comparisons test vs. time point-matched parental HT-29 cells), ###p < 0.001 (unpaired t-test). NT non-treated, C8-i/CASP8-i caspase-8 inhibitor, CASP10-i caspase-10 inhibitor, KO knockout, I + T IFN + TNF.
Fig. 7
Fig. 7. Activation of the CASP8-JAK1/2-STAT1 cell death module in human colonic biopsies and organoids.
AC Colonic biopsies isolated from healthy (HL) individuals (n = 10) or patients with inactive/non-inflamed (n = 11) and active/inflamed (n = 11) Crohn’s disease (CD) were incubated ex vivo with anti-CD3/28 (5 μg/ml each) for 18 h. Relative mRNA expression of A IFNG, TNF and IL2, and B JAK1, JAK2, STAT1 and CASP8 measured by RT-qPCR. C Correlation between relative mRNA levels of the indicated genes or the JAK-STAT score in resting (left) and anti-CD3/28-stimulated biopsies (right). D Relative viability of primary human colonic organoids derived from HL (n = 3 lines) or CD (n = 3 lines) colonic biopsies, and stimulated with IFN-γ and/or TNF-α (10 ng/ml each) for the indicated times. Coefficient of cytokine interaction (CCI) calculated per time-point (right). EG Primary human colonic organoids derived from CD colonic biopsies (n = 3 lines) were pretreated for 1 h with vehicle (DMSO), JAK1-selective compound (upadacitinib and filgotinib), JAK1/2 inhibitor (baricitinib) or pan-JAK inhibitor (tofacitinib) at 0.1, 1 or 10 μM, followed by IFN-γ and/or TNF-α (10 ng/ml each) for the indicated times. E STAT1 activity was measured by HTRF assay at 2 h (top) and relative viability at 8 h (bottom) of cytokine treatment. F SYTOX Green staining of a select organoid line at 8 h of cytokine treatment. G Pearson correlation between relative viability and STAT1 activity. Data were mean ± SEM. *p < 0.05, **p < 0.01 and ***p < 0.001 (two-way, repeated-measures ANOVA with Bonferroni’s multiple comparisons test), #p < 0.05, ##p < 0.01 and ###p < 0.001 (two-way ANOVA with Tukey’s multiple comparisons test), /p < 0.05, ///p < 0.001 (one-way ANOVA with Dunnett’s multiple comparisons test vs. DMSO plus IFN-γ/TNF-α). NT non-treated, JAKinib JAK inhibitor, UPA upadacitinib, BARI baricitinib, TOFA tofacitinib, FILGO filgotinib, org. organoids, CCI coefficient of cytokine interaction.

References

    1. Gunther C, Neumann H, Neurath MF, Becker C. Apoptosis, necrosis and necroptosis: cell death regulation in the intestinal epithelium. Gut. 2013;62:1062–71. doi: 10.1136/gutjnl-2011-301364. - DOI - PubMed
    1. Neurath MF. Cytokines in inflammatory bowel disease. Nat Rev Immunol. 2014;14:329–42. doi: 10.1038/nri3661. - DOI - PubMed
    1. Neurath MF. Current and emerging therapeutic targets for IBD. Nat Rev Gastroenterol Hepatol. 2017;14:269–78. doi: 10.1038/nrgastro.2016.208. - DOI - PubMed
    1. Wallach D, Kang TB, Dillon CP, Green DR. Programmed necrosis in inflammation: toward identification of the effector molecules. Science. 2016;352:aaf2154. doi: 10.1126/science.aaf2154. - DOI - PubMed
    1. Vanden Berghe T, Linkermann A, Jouan-Lanhouet S, Walczak H, Vandenabeele P. Regulated necrosis: the expanding network of non-apoptotic cell death pathways. Nat Rev Mol Cell Biol. 2014;15:135–47. doi: 10.1038/nrm3737. - DOI - PubMed

Publication types

MeSH terms