. 2021 Sep 23;12(1):5603.
doi: 10.1038/s41467-021-25934-4.

A blueprint of the topology and mechanics of the human ovary for next-generation bioengineering and diagnosis

Affiliations

A blueprint of the topology and mechanics of the human ovary for next-generation bioengineering and diagnosis

Emna Ouni et al. Nat Commun. .

Abstract

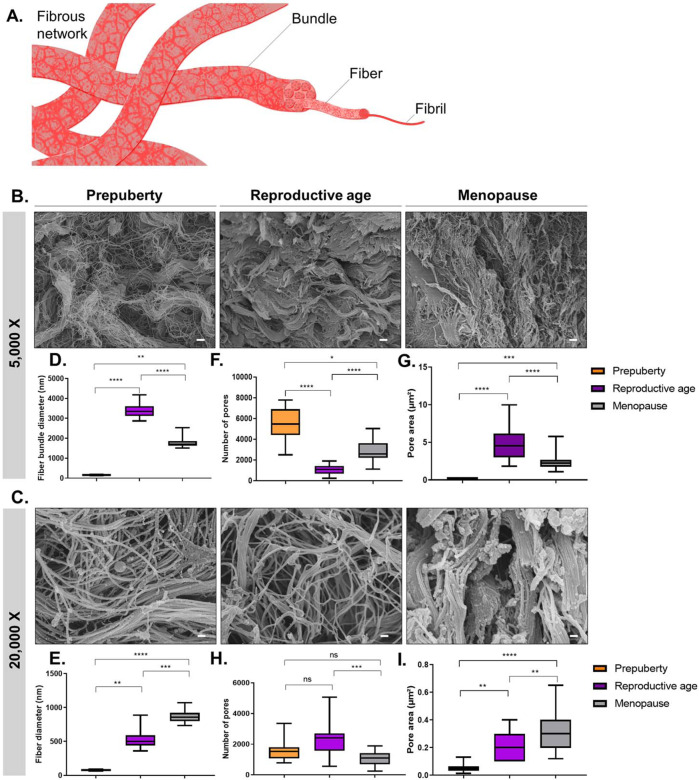
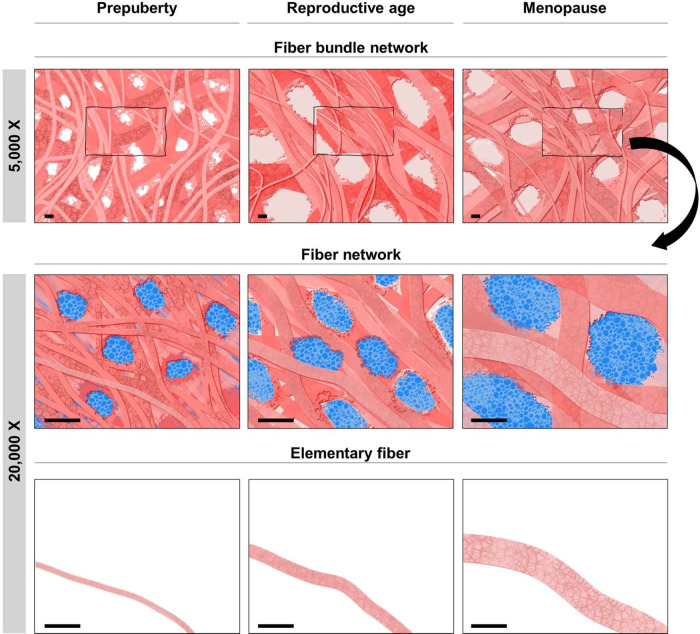
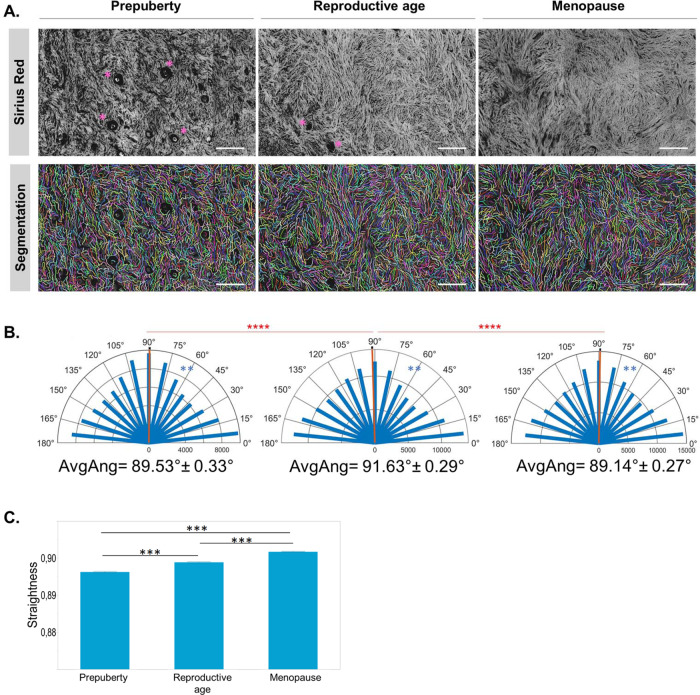
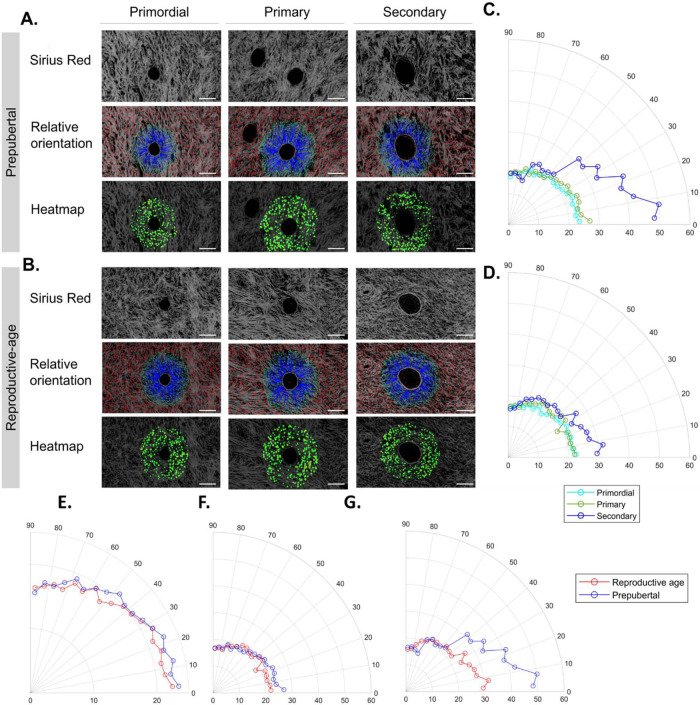
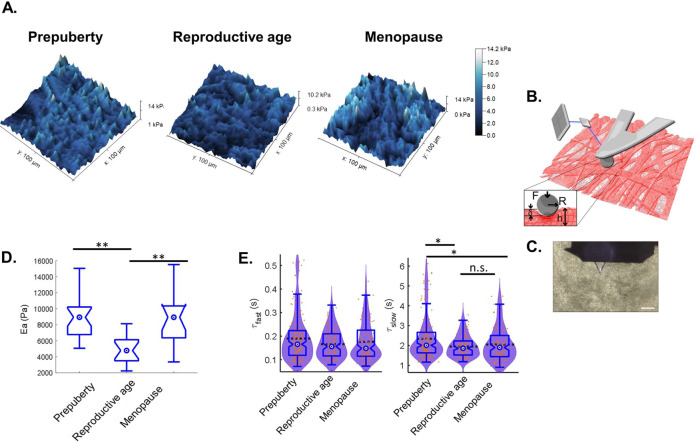
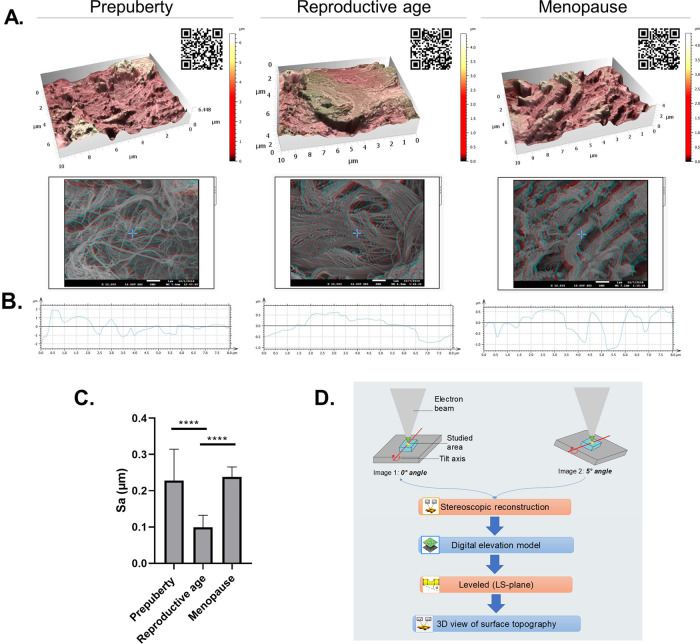
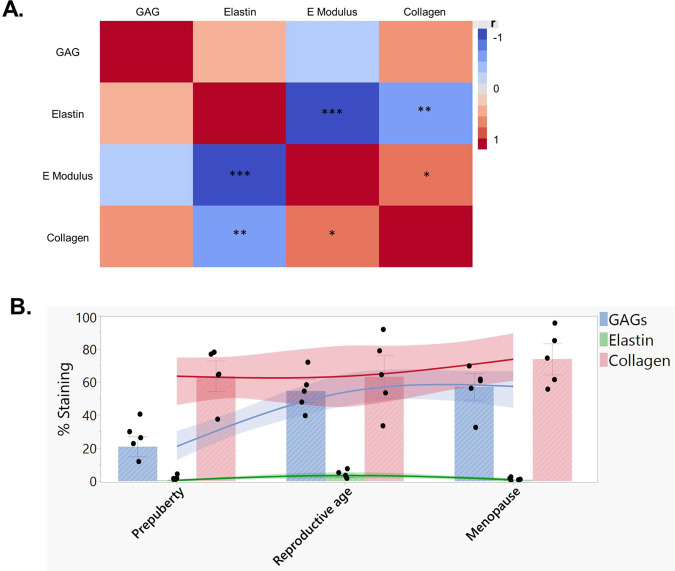
Although the first dissection of the human ovary dates back to the 17th century, the biophysical characteristics of the ovarian cell microenvironment are still poorly understood. However, this information is vital to deciphering cellular processes such as proliferation, morphology and differentiation, as well as pathologies like tumor progression, as demonstrated in other biological tissues. Here, we provide the first readout of human ovarian fiber morphology, interstitial and perifollicular fiber orientation, pore geometry, topography and surface roughness, and elastic and viscoelastic properties. By determining differences between healthy prepubertal, reproductive-age, and menopausal ovarian tissue, we unravel and elucidate a unique biophysical phenotype of reproductive-age tissue, bridging biophysics and female fertility. While these data enable to design of more biomimetic scaffolds for the tissue-engineered ovary, our analysis pipeline is applicable for the characterization of other organs in physiological or pathological states to reveal their biophysical markers or design their bioinspired analogs.


Conflict of interest statement

The authors declare no competing interests.

Figures

Fig. 1
Fig. 1. ECM microstructure and fibrous network morphology in human ovarian tissue from prepuberty to menopause.
A Schematic illustration of the fibrous network anatomy composed of fibrils, fibers, and fiber bundles, as defined in this study. SEM micrographs revealed: B the ECM network structure at fiber bundle scale (×5000 magnification) and C fiber scale (×20,000 magnification). D, E At prepuberty (number of biological replicates [n] = 5), ovarian tissue is composed of the thinnest fibers (mean ± SD: 76.1 nm ± 9.8) assembled into the thinnest bundles (160.0 nm ± 21.3), densifying upon puberty (fiber scale: 528.4 nm ± 128.0; fiber bundle scale: 3379.0 nm ± 368.8). FI Fiber and bundle spacing deduced from pore number and area revealed a tight ECM network at prepuberty, illustrated here by large numbers of pores (5430 ± 1688) occupying the smallest area (0.19 µm2 ± 0.05). At reproductive age (n = 5), human ovarian tissue is characterized by fibers of intermediate diameter (528.4 nm ± 12.8) assembled into the thickest bundles compared to prepubertal (n = 5) and menopausal (n = 5) tissues, forming a looser fibrous network with greater pore spaces (4.9 µm2 ± 2.4). While at high magnification, we found menopausal tissue to be composed of smaller pore numbers occupying greater areas than at reproductive age (1054 ± 470); a similar observation at lower magnification revealed tighter network organization at menopause (0.32 µm2 ± 0.15). These pore-spacing differences between age groups may play a role in permeability change with age. Boxplots display 25th and 75th percentile, median (line), and the whiskers extending to the last data point not considered outlier. Fiber and pore analyses were conducted using DiameterJ. One-way ANOVA (post hoc: Tukey) was used to compare pore area. Differences in fiber morphology and pore number were analyzed by Kruskal–Wallis test (post hoc: Dunn) (*p < 0.05; **p < 0.01; ***p < 0.001; ****p < 0.0001). Scale: 1 µm.
Fig. 2
Fig. 2. Schematic illustration of fibrous ECM structure deduced from SEM image analyses.
Simplified illustration of ECM structural remodeling with age at fiber (×20,000) and fiber bundle (×5000) scale, showing changes in fibrous network morphology (thickness, spacing). Scale: 1 µm.
Fig. 3
Fig. 3. Fiber orientation and straightness in the interstitial ECM.
A Sirius Red-stained paraffin sections show collagen autofluorescence, which was used for collagen fiber segmentation by curvelet transform that enabled measurement of directional fiber distribution and fiber straightness. Asterisks point to preantral follicles. B Angular fiber distribution changes with age (blue) demonstrate the anisotropic nature of human ovarian tissue, but average angles change only at reproductive age (red), and no significant differences were noted between prepubertal and menopausal tissues. C Fiber straightness increases significantly with age (n = 5 biologically independent samples/group). Straightness results were extracted from segmented and tracked fibers as detailed in Table 1 and are expressed as mean ± SD. Statistical significance in fiber straightness was obtained by one-way ANOVA followed by Tukey’s post hoc multiple comparisons. Three to five regions per slide were selected from Sirius Red scans for fiber orientation and straightness measurements. The Rayleigh test was applied to assess whether fibers are uniformly oriented from 0° to 180° within each age group or display a common mean direction. The Watson’s parametric multiple sample test and Kuiper’s test with Bonferroni correction were applied to successively compare mean directions and directional distribution between study groups (**p < 0.01; ***p < 0.001; ****p < 0.0001). Scale: 100 µm.
Fig. 4
Fig. 4. Fiber orientation in the perifollicular ECM around preantral follicles at prepuberty and reproductive age.
A, B Analysis of fiber orientation around the borders of primordial, primary, and secondary follicles at prepubertal and reproductive age using Sirius Red-stained sections. Details on the number of analyzed fibers and follicles at each stage and age are detailed in Table 1. The blue line associates the center of fibers extracted by CT-FIRE with corresponding boundary locations, while the red line shows fibers located either beyond the distance range or within the boundary; boundaries are highlighted in yellow; the heatmap uses red or warm colors to indicate larger relative angles. C, D Circular plots of fiber orientation frequency during folliculogenesis in prepubertal (C) and reproductive age (D) tissues revealed significant fiber reorientation at the secondary stage compared to primordial and primary stages and at both ovarian ages. One-way ANOVA (post hoc: Tukey) was used to compare fiber directionality between follicle stages within each age group. During prepuberty (p values): Pprimordial–primary = 0.9191; Pprimordial–secondary = 0.0010; and Pprimary–secondary = 0.0034. During reproductive age (p values): Pprimordial–primary = 0.8574; Pprimordial–secondary = 0.0022; and Pprimary–secondary = 0.0099. EG When comparing the difference in fiber orientation around follicles from prepubertal and reproductive-age tissues at each follicular stage (E: primordial, F: primary, and G: secondary), we found significant differences between age groups at all stages. Pprimordial = 0.0026; Pprimary = 0.0329; and Psecondary < 0.0001. One-tailed t test was used to compare fiber directionality around follicles at the same stage between age groups. Scale: 200 µm.
Fig. 5
Fig. 5. Elasticity and viscoelasticity of human ovarian tissue.
A 3D rendering of AFM maps such as surface height and color reflects Young’s modulus amplitude measured using a Hertzian model. B Graphic representation of a Hertzian model and AFM measurement of ovarian tissue deformation under AFM spherical probe indentation: R is the probe radius (2.5 µm), F is the applied force, δ is the indentation, and h is tissue thickness (50 µm). Deformation induces cantilever deflection. An optical system using a laser to detect the tip’s deflection helped to measure Young’s modulus using the Hertzian model. C Transmission microscopic image of the AFM cantilever positioned on top of ovarian tissue in PBS. Scale: 100 µm. D Elasticity measurements. N = 5 biologically independent samples per age group with at least three analyzed regions per sample. Pprepuberty–reproductive age = 3.471e−5; Pmenopause–reproductive age = 7.619e−4. E Viscoelasticity measurements. Although ovarian tissue shows significant elasticity change upon menopause, no significant difference was recorded in terms of viscoelasticity (λ: relaxation time) between reproductive-age and menopausal tissues. A minimum of six measurements on at least nine different points in a sample were recorded for viscoelasticity, which was measured on the same region that was used for force maps. The graphic shows the overlay of violin plots with boxplots. Statistical significance was obtained using Kruskal–Wallis test followed by Dunn’s multiple comparison correction. Boxplots display 25th and 75th percentile, median (blue circle), and the whiskers extending to the last data point not considered outlier. ns: non-significant; *p < 0.001; **p < 0.0001.
Fig. 6
Fig. 6. Topography and surface analyses.
A, D 3D rendering of surface topography from stereoscopic reconstruction of two SEM images acquired using eucentric rotation around the y axis with a 5° tilt at ×12,000 magnification. Color scales indicate the height range on each surface. Scale on SEM micrographs corresponds to 1 µm. QR codes open video animation of 3D topography representations. B Extracted rugosity profiles from 3D reconstructions. C Surface roughness was measured by calculating the arithmetic average of 3D roughness (Sa) according to calculation conditions defined in ISO25178. At least three regions were acquired per sample (n = 5 biologically independent samples/age group). D 3D stereoscopic reconstruction pipeline. One-way ANOVA (post hoc: Tukey) was used to compare surface roughness (****p < 0.0001).
Fig. 7
Fig. 7. Linking biochemical to biophysical properties.
A Correlation matrix of elastic matrisome components and apparent elastic modulus measured in study subjects. Histological staining was used to characterize glycosaminoglycans (GAGs), collagen abundance, and immunofluorescent staining of elastin. Computer-assisted quantification of staining was based on the following equation: % stained area = (stained area/region of interest (ROI) area) × 100 expressed as a percentage. A correlation matrix was constructed using JMP Pro 14.3.0 (SAS, France, Grégy-sur-Yerres). Spearman’s correlation was used to measure the strength and direction of association (r) between each pair of variables. Pcollagen–elastin = 0.0058; PEmodulus–collagen = 0.0148; PEmodulus–elastin < 0.0001. B Changes in collagen, elastin, and GAG levels with age are summarized in bar charts, presented as mean ± SD, n = 5 biologically independent samples per age group. The data plot fits a smoothing spline with a lambda value of 0.05. The curves also include the bootstrap confidence region for each fit generated by JMP Pro 14.3.0. *p < 0.05; **p < 0.01; ***p < 0.0001.

References

    1. Crawford GE, Ledger WL. In vitro fertilisation/intracytoplasmic sperm injection beyond 2020. BJOG. 2019;126:237–243. doi: 10.1111/1471-0528.15526. - DOI - PubMed
    1. Shikanov A, Smith RM, Xu M, Woodruff TK, Shea LD. Hydrogel network design using multifunctional macromers to coordinate tissue maturation in ovarian follicle culture. Biomaterials. 2011;32:2524–2531. doi: 10.1016/j.biomaterials.2010.12.027. - DOI - PMC - PubMed
    1. Vanacker J, Amorim CA. Alginate: a versatile biomaterial to encapsulate isolated ovarian follicles. Ann. Biomed. Eng. 2017;45:1633–1649. doi: 10.1007/s10439-017-1816-6. - DOI - PubMed
    1. Joo S, et al. The effect of collagen hydrogel on 3D culture of ovarian follicles. Biomed. Mater. 2016;11:065009. doi: 10.1088/1748-6041/11/6/065009. - DOI - PubMed
    1. Chiti MC, Dolmans MM, Donnez J, Amorim CA. Fibrin in reproductive tissue engineering: a review on its application as a biomaterial for fertility preservation. Ann. Biomed. Eng. 2017;45:1650–1663. doi: 10.1007/s10439-017-1817-5. - DOI - PubMed

Publication types

MeSH terms