. 2021 Sep 23;11(1):18910.
doi: 10.1038/s41598-021-98082-w.

Role of pyruvate in maintaining cell viability and energy production under high-glucose conditions

Affiliations

Role of pyruvate in maintaining cell viability and energy production under high-glucose conditions

Hideji Yako et al. Sci Rep. .

Abstract

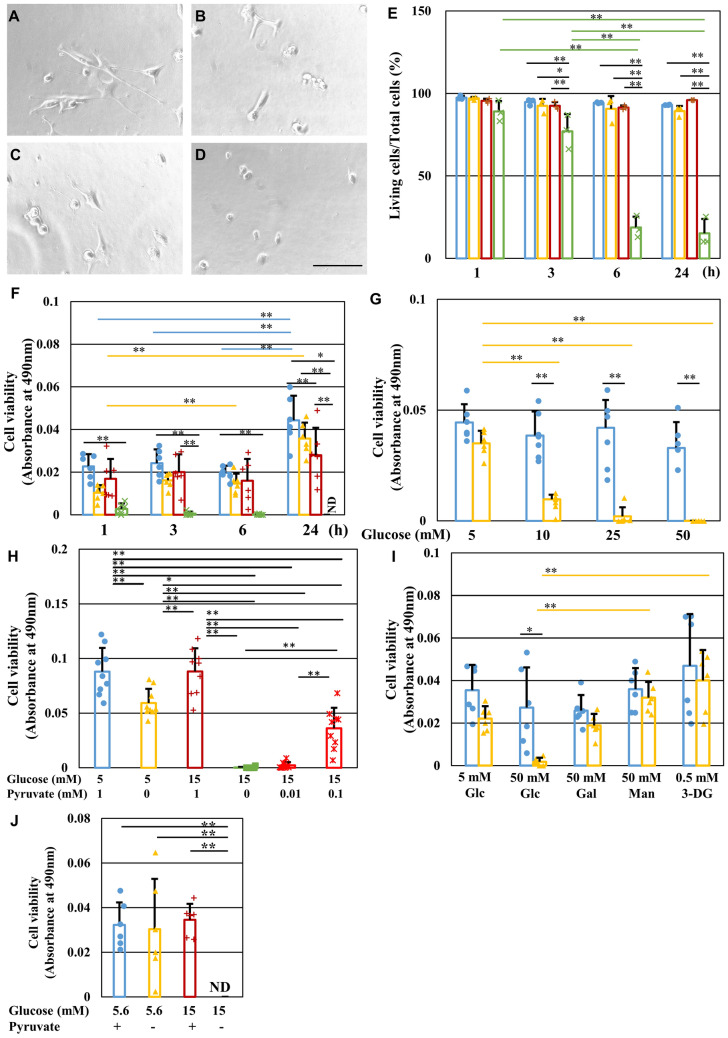
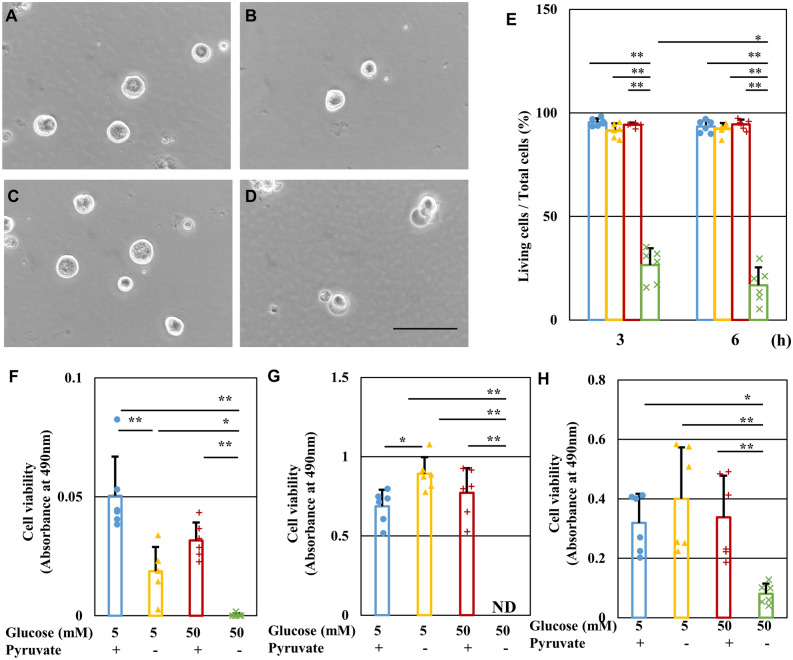
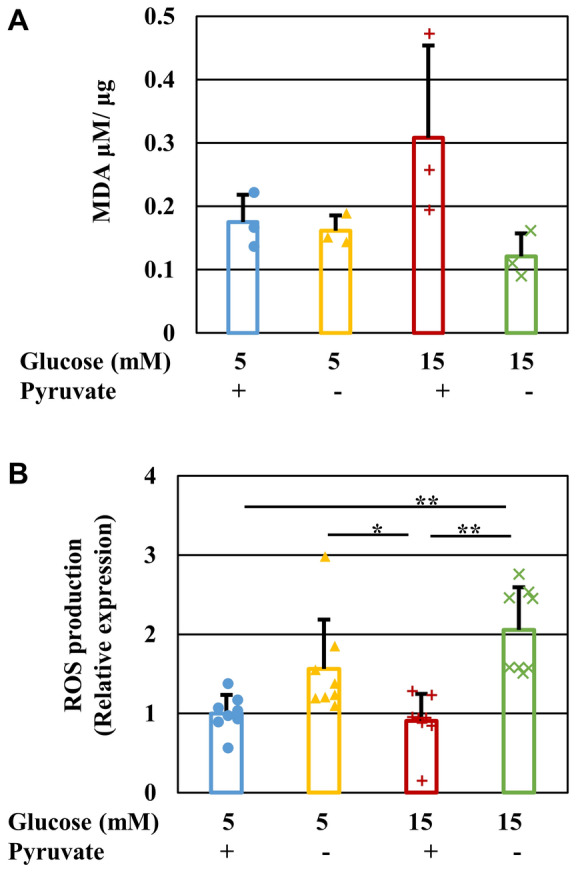
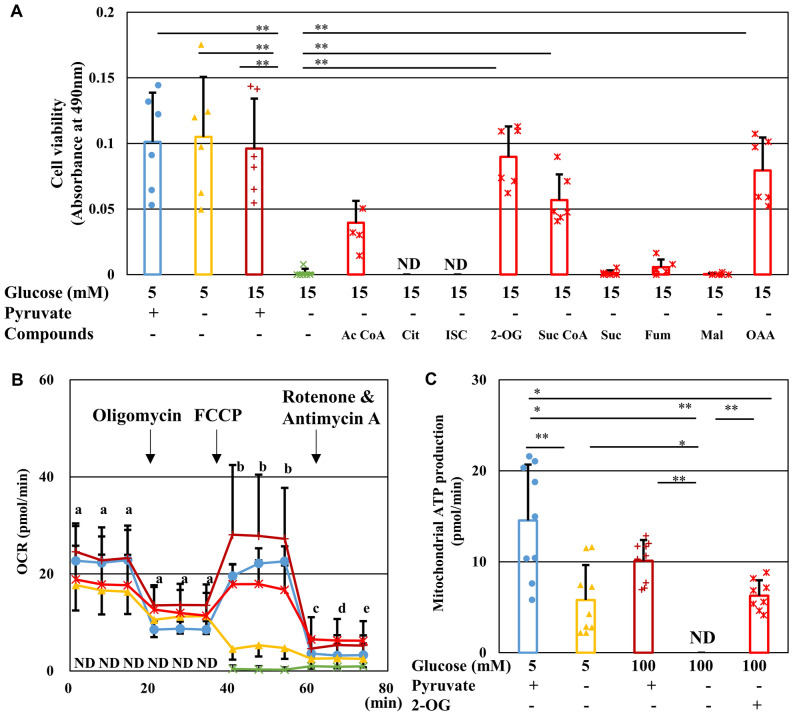
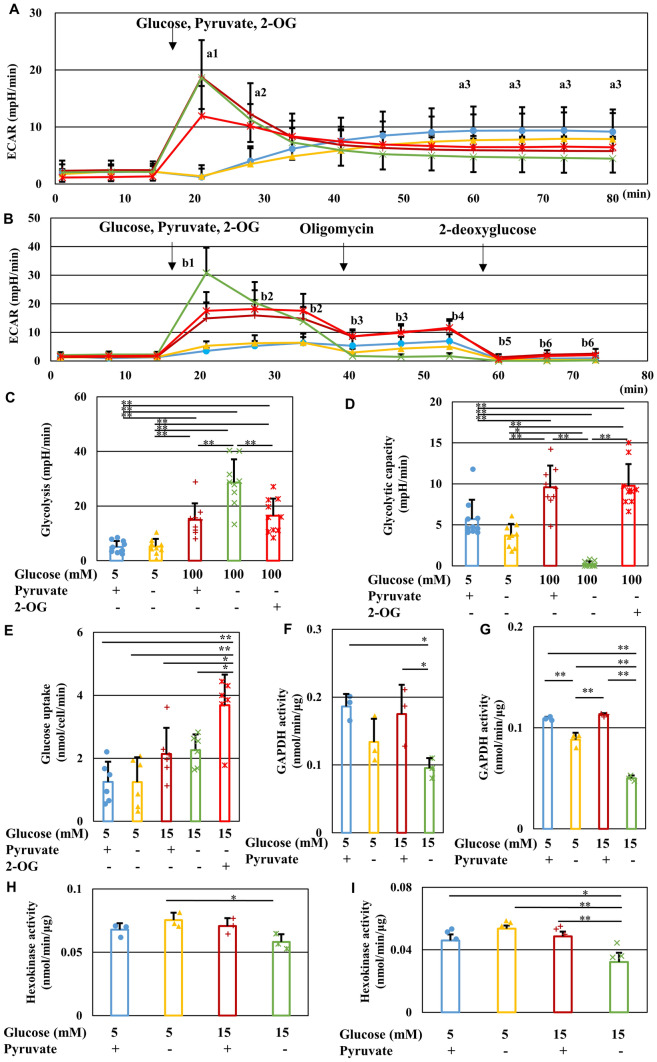
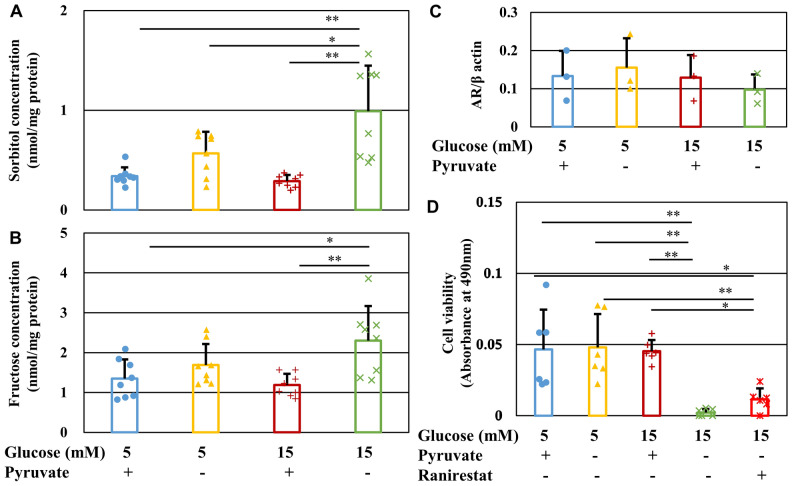
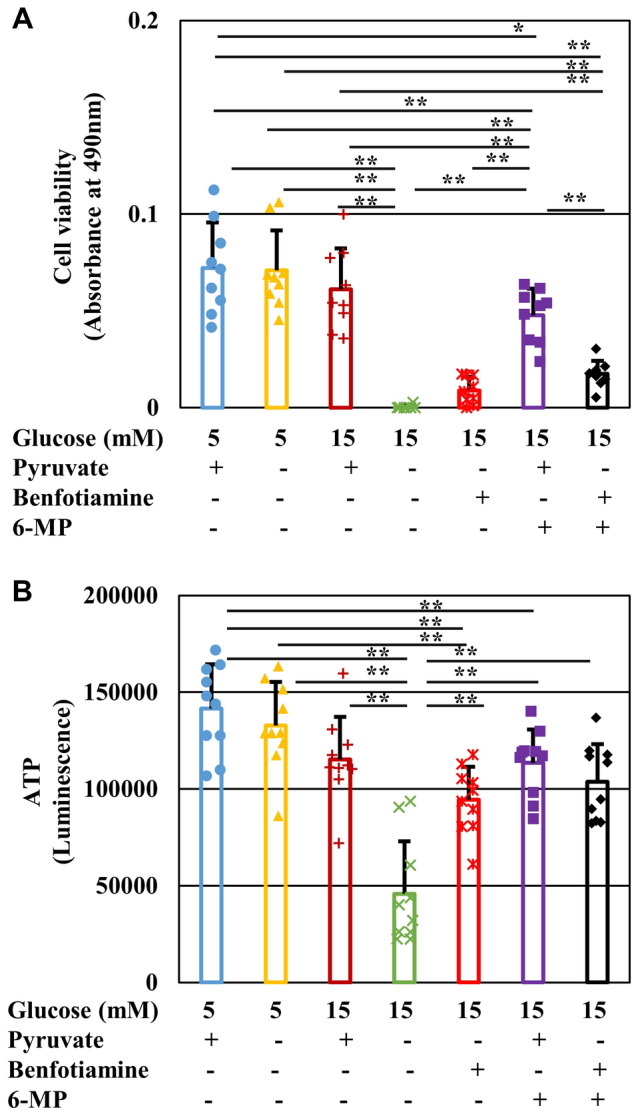
Pyruvate functions as a key molecule in energy production and as an antioxidant. The efficacy of pyruvate supplementation in diabetic retinopathy and nephropathy has been shown in animal models; however, its significance in the functional maintenance of neurons and Schwann cells under diabetic conditions remains unknown. We observed rapid and extensive cell death under high-glucose (> 10 mM) and pyruvate-starved conditions. Exposure of Schwann cells to these conditions led to a significant decrease in glycolytic flux, mitochondrial respiration and ATP production, accompanied by enhanced collateral glycolysis pathways (e.g., polyol pathway). Cell death could be prevented by supplementation with 2-oxoglutarate (a TCA cycle intermediate), benfotiamine (the vitamin B1 derivative that suppresses the collateral pathways), or the poly (ADP-ribose) polymerase (PARP) inhibitor, rucaparib. Our findings suggest that exogenous pyruvate plays a pivotal role in maintaining glycolysis-TCA cycle flux and ATP production under high-glucose conditions by suppressing PARP activity.


Conflict of interest statement

Research funding for this study, as well as the AR inhibitor ranirestat and the data of intracellular sorbitol and fructose contents, were provided by Sumitomo Dainippon Pharma Co., Ltd (H. Y. and K. S.). The other authors declare no competing interests.

Figures

Figure 1
Figure 1
Pyruvate starvation induces rapid IMS32 Schwann cell death under high-glucose conditions. (A–D) Representative phase-contrast micrographs of IMS32 cells at 24 h in the [Glc 5 mM/Pyr ( +)] (A), [Glc 5 mM/Pyr (−)] (B), [Glc 50 mM/Pyr (+)] (C), and [Glc 50 mM/Pyr (−)] (D) groups. Scale bar represents 100 μm. (E and F) IMS32 cell viability at 1, 3, 6, and 24 h in the [Glc 5 mM/Pyr (+)] (blue), [Glc 5 mM/Pyr (−)] (yellow), [Glc 50 mM/Pyr (+)] (brown), and [Glc 50 mM/Pyr (−)] (green) groups was determined by Trypan blue staining (E) and MTS assay (F). (G and I) Cell viability at 24 h after exposure to 5, 10, 25, or 50 mM glucose (G) or 50 mM galactose, 50 mM mannitol or 0.5 mM 3-deoxyglucosone (I) in the presence (blue) or absence (yellow) of pyruvate was determined by MTS assay. (H) Cell viability at 24 h after exposure to [Glc 5 mM/Pyr 1 mM] (blue), [Glc 5 mM/Pyr (−)] (yellow), [Glc 15 mM/Pyr 1 mM] (brown), [Glc 15 mM/Pyr (−)] (green), and [Glc 15 mM/ Pyr 0.01 or 0.1 mM] (red) groups was determined by MTS assay. (J) Cell viability at 6 h after exposure to [Glc 5 mM/Pyr (+)] (blue), [Glc 5 mM/Pyr (−)] (yellow), [Glc 15 mM/Pyr (+)] (brown), and [Glc 15 mM/Pyr (−)] (green) in Tyrode’s solution with N2 supplement was determined. Values represent mean + SD from three (E), six (F, G, I, J) and nine (H) experiments (individual values are depicted as circles, triangles, pluses and crosses). * P < 0.05, ** P < 0.01. Glc, glucose; Gal, galactose; Man. Mannitol; 3-DG, 3-deoxyglucosone.
Figure 2
Figure 2
Pyruvate starvation induces rapid cell death of primary cultured rat DRG neurons, NSC-34 cells, MES13 cells and HAEC cells under high-glucose conditions. (A-D) Representative phase-contrast micrographs of DRG neurons at 24 h [Glc 5 mM/Pyr (+)] (A), [Glc 5 mM/Pyr (−)] (B), [Glc 50 mM/Pyr ( +)] (C), and [Glc 50 mM/Pyr (−)] (D) groups. Scale bar represents 100 μm. (E) The viability of DRG neurons at 3 and 6 h in the [Glc 5 mM/Pyr (+)] (blue), [Glc 5 mM/Pyr (−)] (yellow), [Glc 50 mM/Pyr (+)] (brown), and [Glc 50 mM/Pyr (−)] (green) groups was determined by Trypan blue staining. (F–H) The viability of NSC-34 cells (F), MES13 cells (G) and HAEC cells (H) at 24 h after exposure to the 4 conditions described above was determined by MTS assay. Values represent mean + SD from three (E) and six (F–H) experiments (individual values are depicted as circles, triangles, pluses and crosses). * P < 0.05, ** P < 0.01.
Figure 3
Figure 3
Pyruvate starvation under high-glucose conditions induces ROS production, but not lipid peroxidation. The quantity of MDA (A) and the fluorescent intensity of CellROX (B) in IMS32 cells at 1 h in the [Glc 5 mM/Pyr (+)] (blue), [Glc 5 mM/Pyr (-)] (yellow), [Glc 15 mM/Pyr (+)] (brown) and [Glc 15 mM/Pyr (-)] (green) was determined by TBARS assay (A) and CellROX assay (B), respectively. The fluorescent intensity of CellROX was normalized to ratio of the value of [Glc 5 mM/Pyr (+)]. Values represent mean + SD from three (A) and six (B) experiments (individual values are depicted as circles, triangles, pluses and crosses). ** P < 0.01.
Figure 4
Figure 4
2-Oxyglutarate prevents IMS32 cell death, mitochondrial dysfunction and ATP depletion under high-glucose pyruvate-starved conditions. (A) Cell viability at 24 h in the [Glc 5 mM/Pyr (+)] (blue), [Glc 5 mM/Pyr (−)] (yellow), [Glc 15 mM/Pyr (+)] (brown), [Glc 15 mM/Pyr (−)] (green), and [Glc 15 mM/Pyr (−)] supplemented with TCA cycle intermediates (red) groups was determined by MTS assay. (B) Time course of OCR in the [Glc 5 mM/Pyr (+)] (blue), [Glc 5 mM/Pyr (−)] (yellow), [Glc 100 mM/Pyr (+)] (brown), [Glc 100 mM/Pyr (−)] (green), and [Glc 100 mM/Pyr (−)/2-OG (+)] (red) groups measured by Extracellular Flux Analyzer and Cell MitoStress Test. (C) Mitochondrial ATP production under these five conditions was estimated by changes in OCR through sequential addition of oligomycin and FCCP. Values represent mean + SD from six (A) and 9–10 (B and C) experiments (individual values are depicted as circles, triangles, pluses, crosses and asterisks). (A and C) * P < 0.05, ** P < 0.01. (B) [Glc 100 mM/ Pyr (−)] compared with (a) all the other groups (P < 0.01), (b) [Glc 5 mM/Pyr (+)], [Glc 100 mM/ Pyr (+)], or [Glc 100 mM/Pyr (−)/2-OG (+)] (P < 0.01), (c) [Glc 100 mM/Pyr (−)/2-OG (+)] (P < 0.01) or [Glc 100 mM/ Pyr (+)] (P < 0.05), (d) [Glc 100 mM/Pyr (−)/2-OG (+)] (P < 0.01), and (e) [Glc 100 mM/ Pyr (+)] or [Glc 100 mM/Pyr (−)/2-OG (+)] (P < 0.01). Ac CoA, acetyl CoA; Cit, citrate; ISC, isocitrate; 2-OG, 2-oxyglutarate; Suc CoA, succinyl CoA; Suc, succinate; Fum, fumarate; Mai, malate; and OAA; oxaloacetate.
Figure 5
Figure 5
Pyruvate starvation inhibits glycolytic flux and GAPDH and hexokinase activity under high-glucose conditions. (A) Time course of ECAR in the [Glc 5 mM/Pyr (+)] (blue), [Glc 5 mM/Pyr (−)] (yellow), [Glc 100 mM/Pyr (+)] (brown), [Glc 100 mM/Pyr (−)] (green), and [Glc 100 mM/Pyr (−)/2-OG (+)] (red) groups measured using an Extracellular Flux Analyzer. (B) Time course of ECAR in the groups described as (A) measured using an Extracellular Flux Analyzer and XF Glycolytic test. Glucose, pyruvate and 2-OG-induced glycolysis (C) and maximum glycolytic capacity (D) under these five conditions was estimated by changes in ECAR through sequential addition of glucose, pyruvate and 2-OG, and oligomycin. (E) The amount of glucose uptake into IMS32 cells under the five conditions described in (A). GAPDH (F, G) and hexokinase (H, I) activity in IMS32 cells at 30 min (C, E) or 60 min (D, F) in the groups described in (A). Values represent mean + SD from 13–14 (A), 9–10 (B-D), six (E), and three (F-I) experiments (individual values are depicted as circles, triangles, pluses, crosses and asterisks). (A) [Glc 100 mM/Pyr (−)] compared with (a1) [Glc 5 mM/Pyr (+)], [Glc 5 mM/Pyr (−)], or [Glc 100 mM/Pyr (−)/2-OG (+)] (P < 0.01), (a2) [Glc 5 mM/Pyr (+)] or [Glc 5 mM/Pyr (−)] (P < 0.01), and (a3) [Glc 5 mM/Pyr (+)] (P < 0.01). (B) [Glc 100 mM/Pyr (−)] compared with (b1) [Glc 5 mM/Pyr (+)], [Glc 5 mM/Pyr (−)], [Glc 100 mM/Pyr (+)], or [Glc 100 mM/Pyr (−)/2-OG (+)] (P < 0.01), (b2) [Glc 5 mM/Pyr (+)], or [Glc 5 mM/Pyr (−)] (P < 0.01), (b3) [Glc 5 mM/Pyr (+)], [Glc 100 mM/Pyr (+)], or [Glc 100 mM/Pyr (−)/2-OG (+)] (P < 0.01), (b4) [Glc 5 mM/Pyr (+)], [Glc 100 mM/Pyr (+)], or [Glc 100 mM/Pyr (−)/2-OG (+)] (P < 0.01), and [Glc 5 mM/Pyr (−)] (P < 0.05), (b5) [Glc 100 mM/Pyr (+)] (P < 0.05), (b6) [Glc 100 mM/Pyr (+)], or [Glc 100 mM/Pyr (−)/2-OG (+)] (P < 0.01). (C-I) * P < 0.05, ** P < 0.01.
Figure 6
Figure 6
Pyruvate starvation enhances the polyol pathway under high-glucose conditions. (A and B) Concentration of sorbitol (A) and fructose (B) in IMS32 cells at 6 h in the [Glc 5 mM/Pyr (+)] (blue), [Glc 5 mM/Pyr (−)] (yellow), [Glc 15 mM/Pyr (+)] (brown), and [Glc 15 mM/Pyr (−)] (green) groups as determined by LC/MS/MS. (C) Relative AR protein expression in IMS32 cells at 1 h in the four groups as measured by Western blotting. Blots for AR and β-actin are shown in Fig. S4A. (D) The AR inhibitor, ranirestat, partially improved the viability of IMS32 cells under high-glucose pyruvate-starved conditions. Cell viability at 24 h after exposure to the four conditions described above and [Glc 15 mM/Pyr (−)/Ranirestat (+)] (red) was determined by MTS assay. Values represent mean + SD from eight (A and B), three (C), and six (D) experiments (individual values are depicted as circles, triangles, pluses, crosses and asterisks). * P < 0.05, ** P < 0.01.
Figure 7
Figure 7
Benfotiamine prevents IMS32 cell death and ATP depletion without accelerating purine metabolism under high-glucose pyruvate-starved conditions. Cell viability (A) at 24 h and intracellular ATP content (B) at 3 h in the Glc 5 mM/Pyr (+)] (blue), [Glc 5 mM/Pyr (−)] (yellow), [Glc 15 mM/Pyr (+)] (brown), [Glc 15 mM/Pyr (−)] (green) and [Glc 15 mM/Pyr (−)/Benfotiamine (+)] (red), [Glc 15 mM/Pyr (−)/6-mercaptopurine (6-MP) (+)] (purple), and [Glc 15 mM/Pyr (−)/Benfotiamine (+)/6-MP (+)] (black) group were determined by MTS assay (A) and CellTiter Glo 2.0 assay (B), respectively. Values represent mean + SD from nine (A) and 10 (B) experiments (individual values are depicted as circles, triangles, pluses, crosses and asterisks). * P < 0.05, ** P < 0.01. 6-MP, 6-mercaptopurine.
Figure 8
Figure 8
PARP is involved in IMS32 cell death under high-glucose pyruvate-starved conditions by suppressing GAPDH activity and glycolytic flux. (A) Relative protein expression of full-length (dark colors) and cleaved (light colors) PARP in IMS32 cells at 1 h in the [Glc 5 mM/Pyr (+)] (blue), [Glc 5 mM/Pyr (−)] (yellow), [Glc 15 mM/Pyr (+)] (brown), and [Glc 15 mM/Pyr (−)] (green) groups was determined by Western blotting. Blots for PARP and β-actin are shown in Fig. S4B. (B and C) The PARP inhibitor, rucaparib, prevented cell death and ATP depletion under high-glucose pyruvate-starved conditions. Cell viability (B) at 24 h and intracellular ATP contents (C) at 3 h in the four groups described above and the [Glc 15 mM/Pyr (−)/Rucaparib (+)] (red) group were determined by MTS assay (B) and CellTiter Glo 2.0 assay (C). (D and E) Treatment with rucaparib (purple) ameliorated the decline in basal GAPDH activity at 4 min (dark colors) and 6 min (light colors) after the initiation of measurement (D) and GAPDH activity/min (E) under high-glucose pyruvate-starved conditions. Intracellular contents of NAD (F) and NADH (G) at 1 h under these conditions described as (B) were determined. (H and I). Rucaparib (purple) improved ECAR (F) to a greater extent than benfotiamine (red), whereas neither agent could restore mitochondrial respiration (G) under high-glucose pyruvate-starved conditions. Values represent the mean + SD from three (A, F and G), eight (B and C), three (D and E), and 9–12 (H and I) experiments (individual values are depicted as circles, triangles, pluses, crosses and asterisks). (D) (a1) Basal GAPDH activity at 4 and 6 min (P < 0.01), (a2) 4 min (P < 0.05), and 6 min (P < 0.01). * P < 0.05, ** P < 0.01.

References

    1. Yagihashi S, Mizukami H, Sugimoto K. Mechanism of diabetic neuropathy: Where are we now and where to go? J. Diabetes Invest. 2011;2:18–32. doi: 10.1111/j.2040-1124.2010.00070.x. - DOI - PMC - PubMed
    1. Nakamichi N, et al. Protection by exogenous pyruvate through a mechanism related to monocarboxylate transporters against cell death induced by hydrogen peroxide in cultured rat cortical neurons. J. Neurochem. 2005;93:84–93. doi: 10.1111/j.1471-4159.2005.02999.x. - DOI - PubMed
    1. Hinoi E, et al. A Molecular Mechanism of Pyruvate Protection against Cytotoxicity of Reactive Oxygen Species in Osteoblasts. Mol. Pharmacol. 2006;70:925–935. doi: 10.1124/mol.106.024398. - DOI - PubMed
    1. Chang I, Cho N, Koh J-Y, Lee M-S. Pyruvate inhibits zinc-mediated pancreatic islet cell death and diabetes. Diabetologia. 2003;46:1220–1227. doi: 10.1007/s00125-003-1171-z. - DOI - PubMed
    1. Hegde K, Varma S. Prevention of cataract by pyruvate in experimentally diabetic mice. Mol. Cell. Biochem. 2005;269:115–120. doi: 10.1007/s11010-005-3087-z. - DOI - PubMed

Publication types

MeSH terms