. 2021 Sep 23;11(1):18902.
doi: 10.1038/s41598-021-98167-6.

Prepulse inhibition predicts subjective hearing in rats

Affiliations

Prepulse inhibition predicts subjective hearing in rats

Naoki Wake et al. Sci Rep. .

Abstract

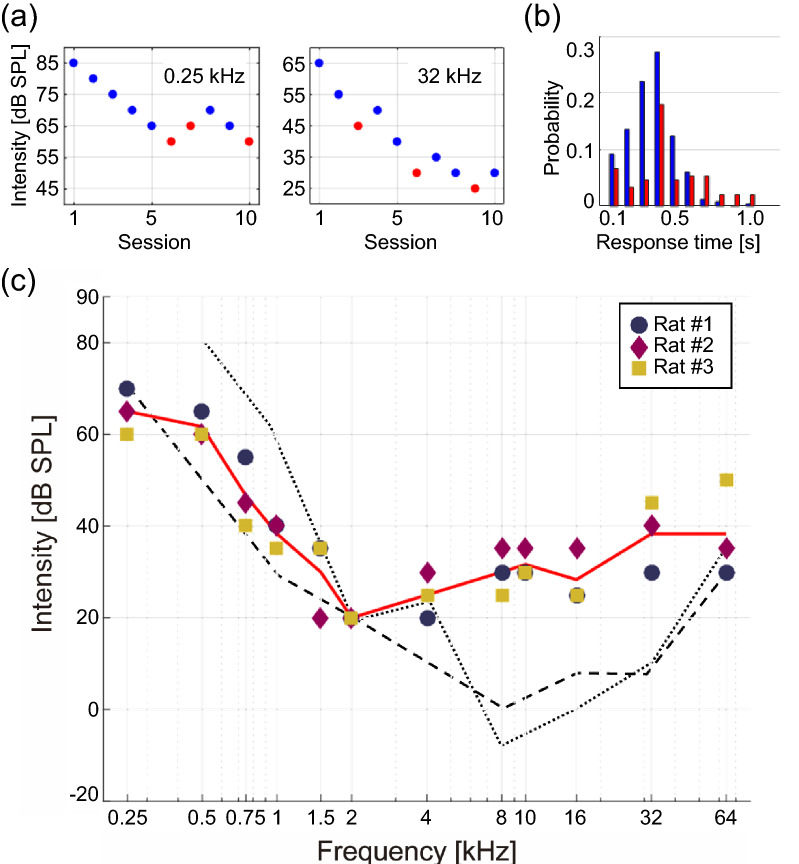
Auditory studies in animals benefit from quick and accurate audiometry. The auditory brainstem response (ABR) and prepulse inhibition (PPI) have been widely used for hearing assessment in animals, but how well these assessments predict subjective audiometry still remains unclear. Human studies suggest that subjective audiometry is consistent with the ABR-based audiogram, not with the PPI-based audiogram, likely due to top-down processing in the cortex that inhibits PPI. Here, we challenged this view in Wistar rats, as rodents exhibit less complexity of cortical activities and thereby less influence of the cerebral cortex on PPI compared to humans. To test our hypothesis, we investigated whether subjective audiometry correlates with ABR- or PPI-based audiograms across the range of audible frequencies in Wistar rats. The subjective audiogram was obtained through pure-tone audiometry based on operant conditioning. Our results demonstrated that both the ABR-based and PPI-based audiograms significantly correlated to the subjective audiogram. We also found that ASR strength was information-rich, and adequate interpolation of this data offered accurate audiometry. Thus, unlike in humans, PPI could be used to predict subjective audibility in rats.


Conflict of interest statement

The authors declare no competing interests.

Figures

Figure 1
Figure 1
An overview of the experimental system. (a) The parts comprising the system. (b) A head-restrained animal being trained to pull a spout lever in response to auditory stimuli (see Supplementary Video S1). (c) Diagrams of acclimation, training, and testing sessions.
Figure 2
Figure 2
Results of pure-tone audiometry. (a) The transitions of test SPL values across sessions for 0.25 and 32 kHz tones. When the subject was rewarded in ≥ 6 out of 10 trials in a given assessment session, the test SPL was lowered in the next assessment session (blue); otherwise, the test SPL was increased in the next session (red). The detection of tone was defined as a success rate of 0.7. (b) Probability distribution of reaction times across 4 hearing tests with 4, 8, 16, and 32 kHz tones. The reaction times for successful (blue) and failed (red) trials are shown. Cases when the lever was not pulled into the backward state within 1 s after the sound presentation are not shown. (c) Estimated audiograms of animals. A red line indicates the average of all the audiograms. Dashed lines indicate the audiograms of Sprague–Dawley rats (longer-dashed line) and cotton rats (shorter-dashed line) reported in previous studies. Both lines were determined by subjective hearing tests.
Figure 3
Figure 3
The ABR-based audiogram in relation to the pure-tone audiogram. (a) A representative ABR waveform. The peak values (red arrows) were used to determine an ABR threshold. (b) The values of the ABR-based audiogram plotted against the values of the pure-tone audiogram.
Figure 4
Figure 4
PPI-based audiogram in relation to behavioral audiogram. (a-i, left pane) The schematic of stimuli presented for evoking the startle responses. (a-i, right pane) Representative raw data of a force sensor output used to determine the strength of the startle response (startle value); (a-ii) The boxplots of startle strengths; (a-iii) The IR based on the startle strengths. The baseline of IR (red line) is the mean + 1σ of IRs under the startle only conditions across multiple days. The PPI threshold is defined as the smallest SPL where the IR exceeded the baseline. (b) The values of the PPI-based audiogram plotted against the values of the behavioral audiogram. (c) The values of the PPI-based audiogram after interpolating the IR function, plotted against the values of the pure-tone audiogram.

References

    1. Heffner H, Masterton B. Hearing in primitive primates: Slow loris (Nycticebuscoucang) and potto (Perodicticuspotto) J. Comp. Physiol. Psychol. 1970 doi: 10.1037/h0029138. - DOI - PubMed
    1. Heffner RS, Heffner HE. Behavioral hearing range of the chinchilla. Hear. Res. 1991;52:13–16. doi: 10.1016/0378-5955(91)90183-A. - DOI - PubMed
    1. Jackson LL, Heffner RS, Heffner HE. Free-field audiogram of the Japanese macaque (Macacafuscata) J. Acoust. Soc. Am. 1999;106:3017–3023. doi: 10.1121/1.428121. - DOI - PubMed
    1. Lasky RE, Soto AA, Luck ML, Laughlin NK. Otoacoustic emission, evoked potential, and behavioral auditory thresholds in the rhesus monkey (Macacamulatta) Hear. Res. 1999;136:35–43. doi: 10.1016/S0378-5955(99)00100-8. - DOI - PubMed
    1. Ryan A. Hearing sensitivity of the mongolian gerbil, Merionesunguiculatis. J. Acoust. Soc. Am. 1976;59:1222–1226. doi: 10.1121/1.380961. - DOI - PubMed

Publication types