. 2021 Oct;6(10):1319-1333.
doi: 10.1038/s41564-021-00964-2. Epub 2021 Sep 23.

Restriction factor compendium for influenza A virus reveals a mechanism for evasion of autophagy

Affiliations

Restriction factor compendium for influenza A virus reveals a mechanism for evasion of autophagy

Laura Martin-Sancho et al. Nat Microbiol. 2021 Oct.

Abstract

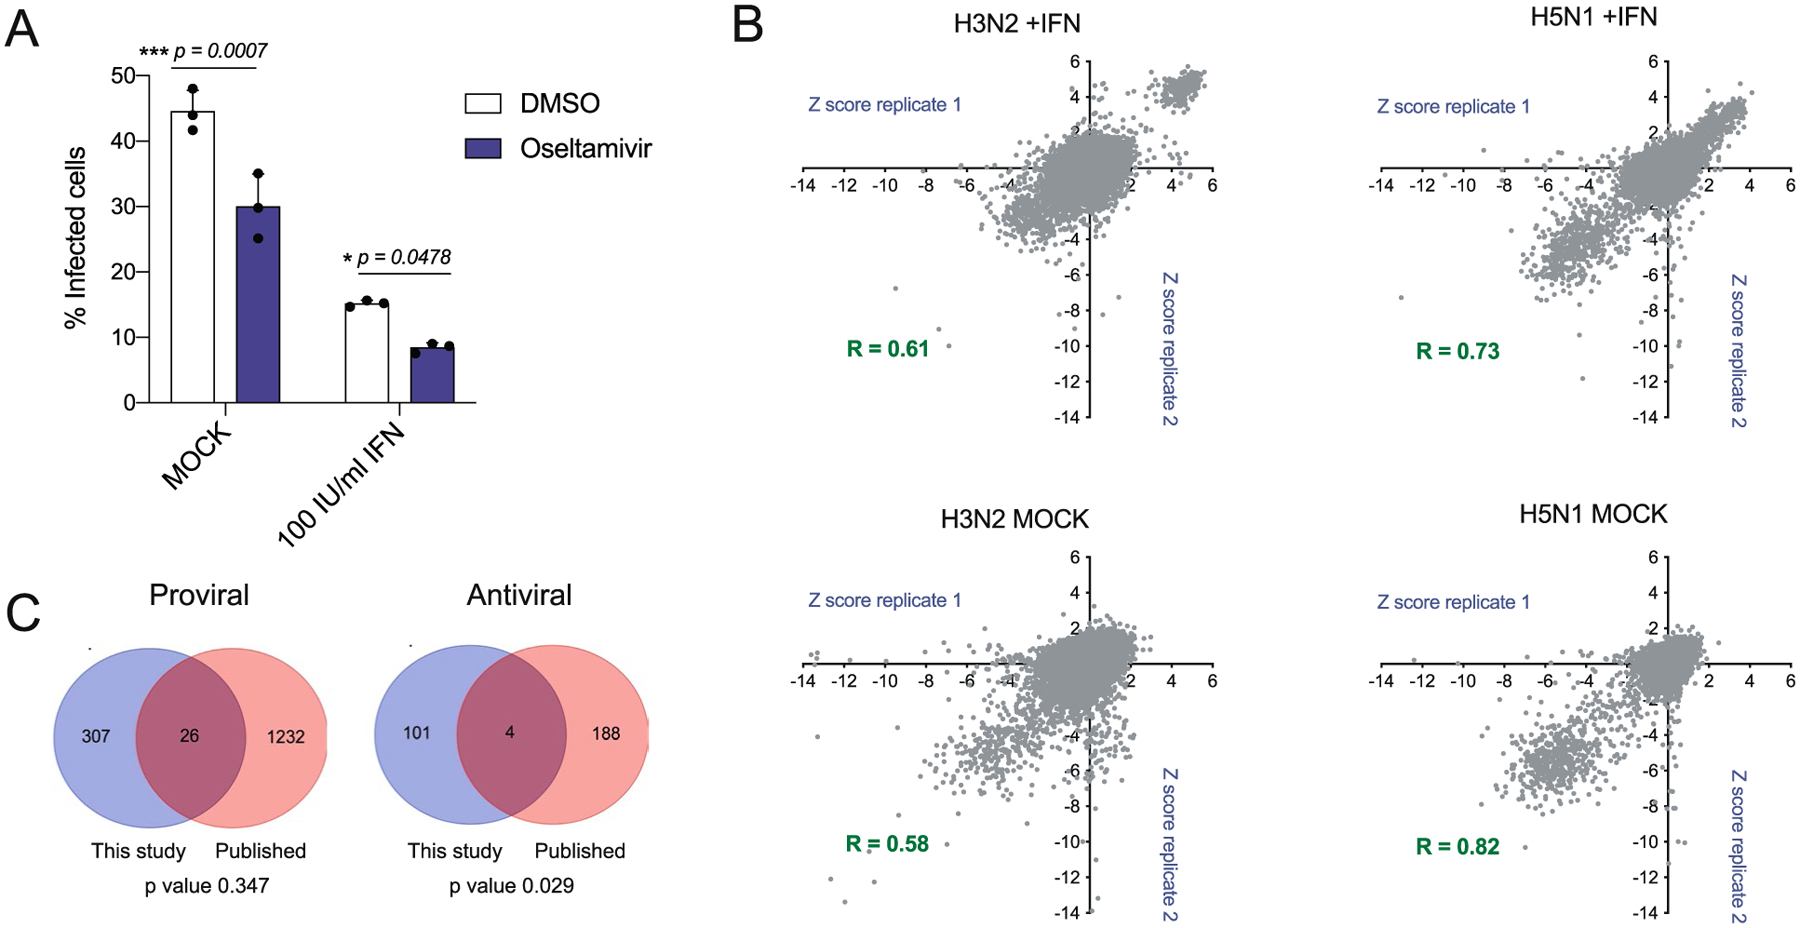
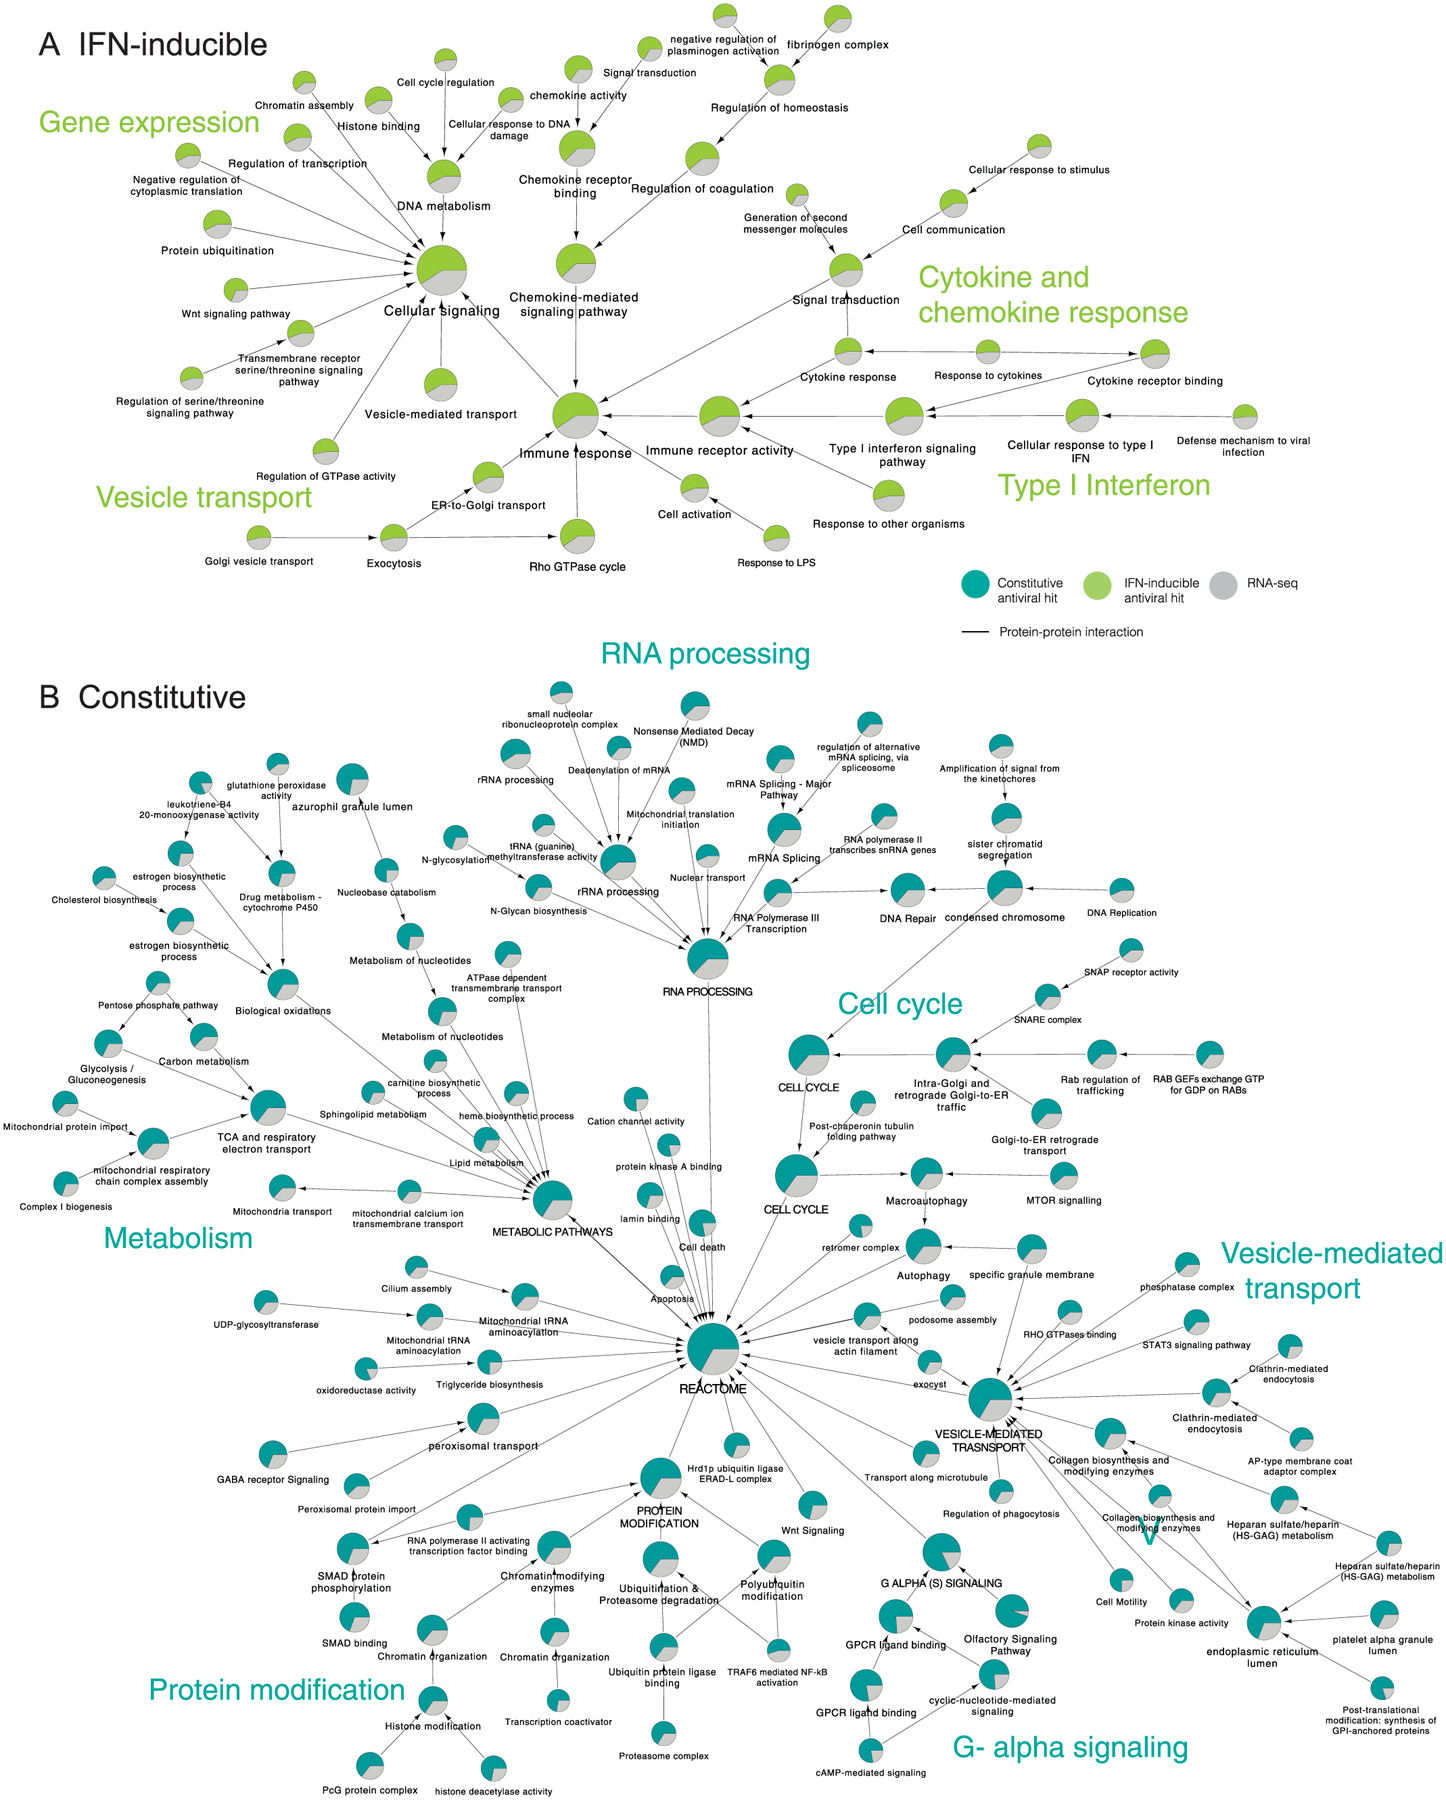
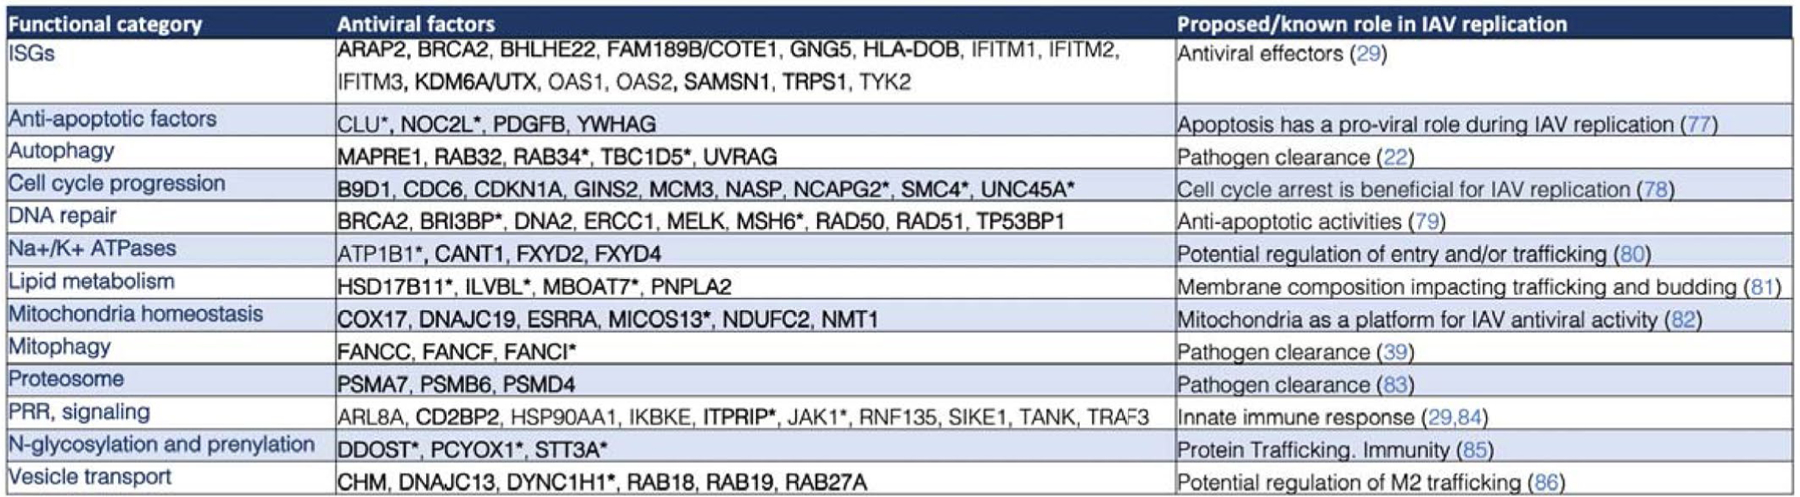
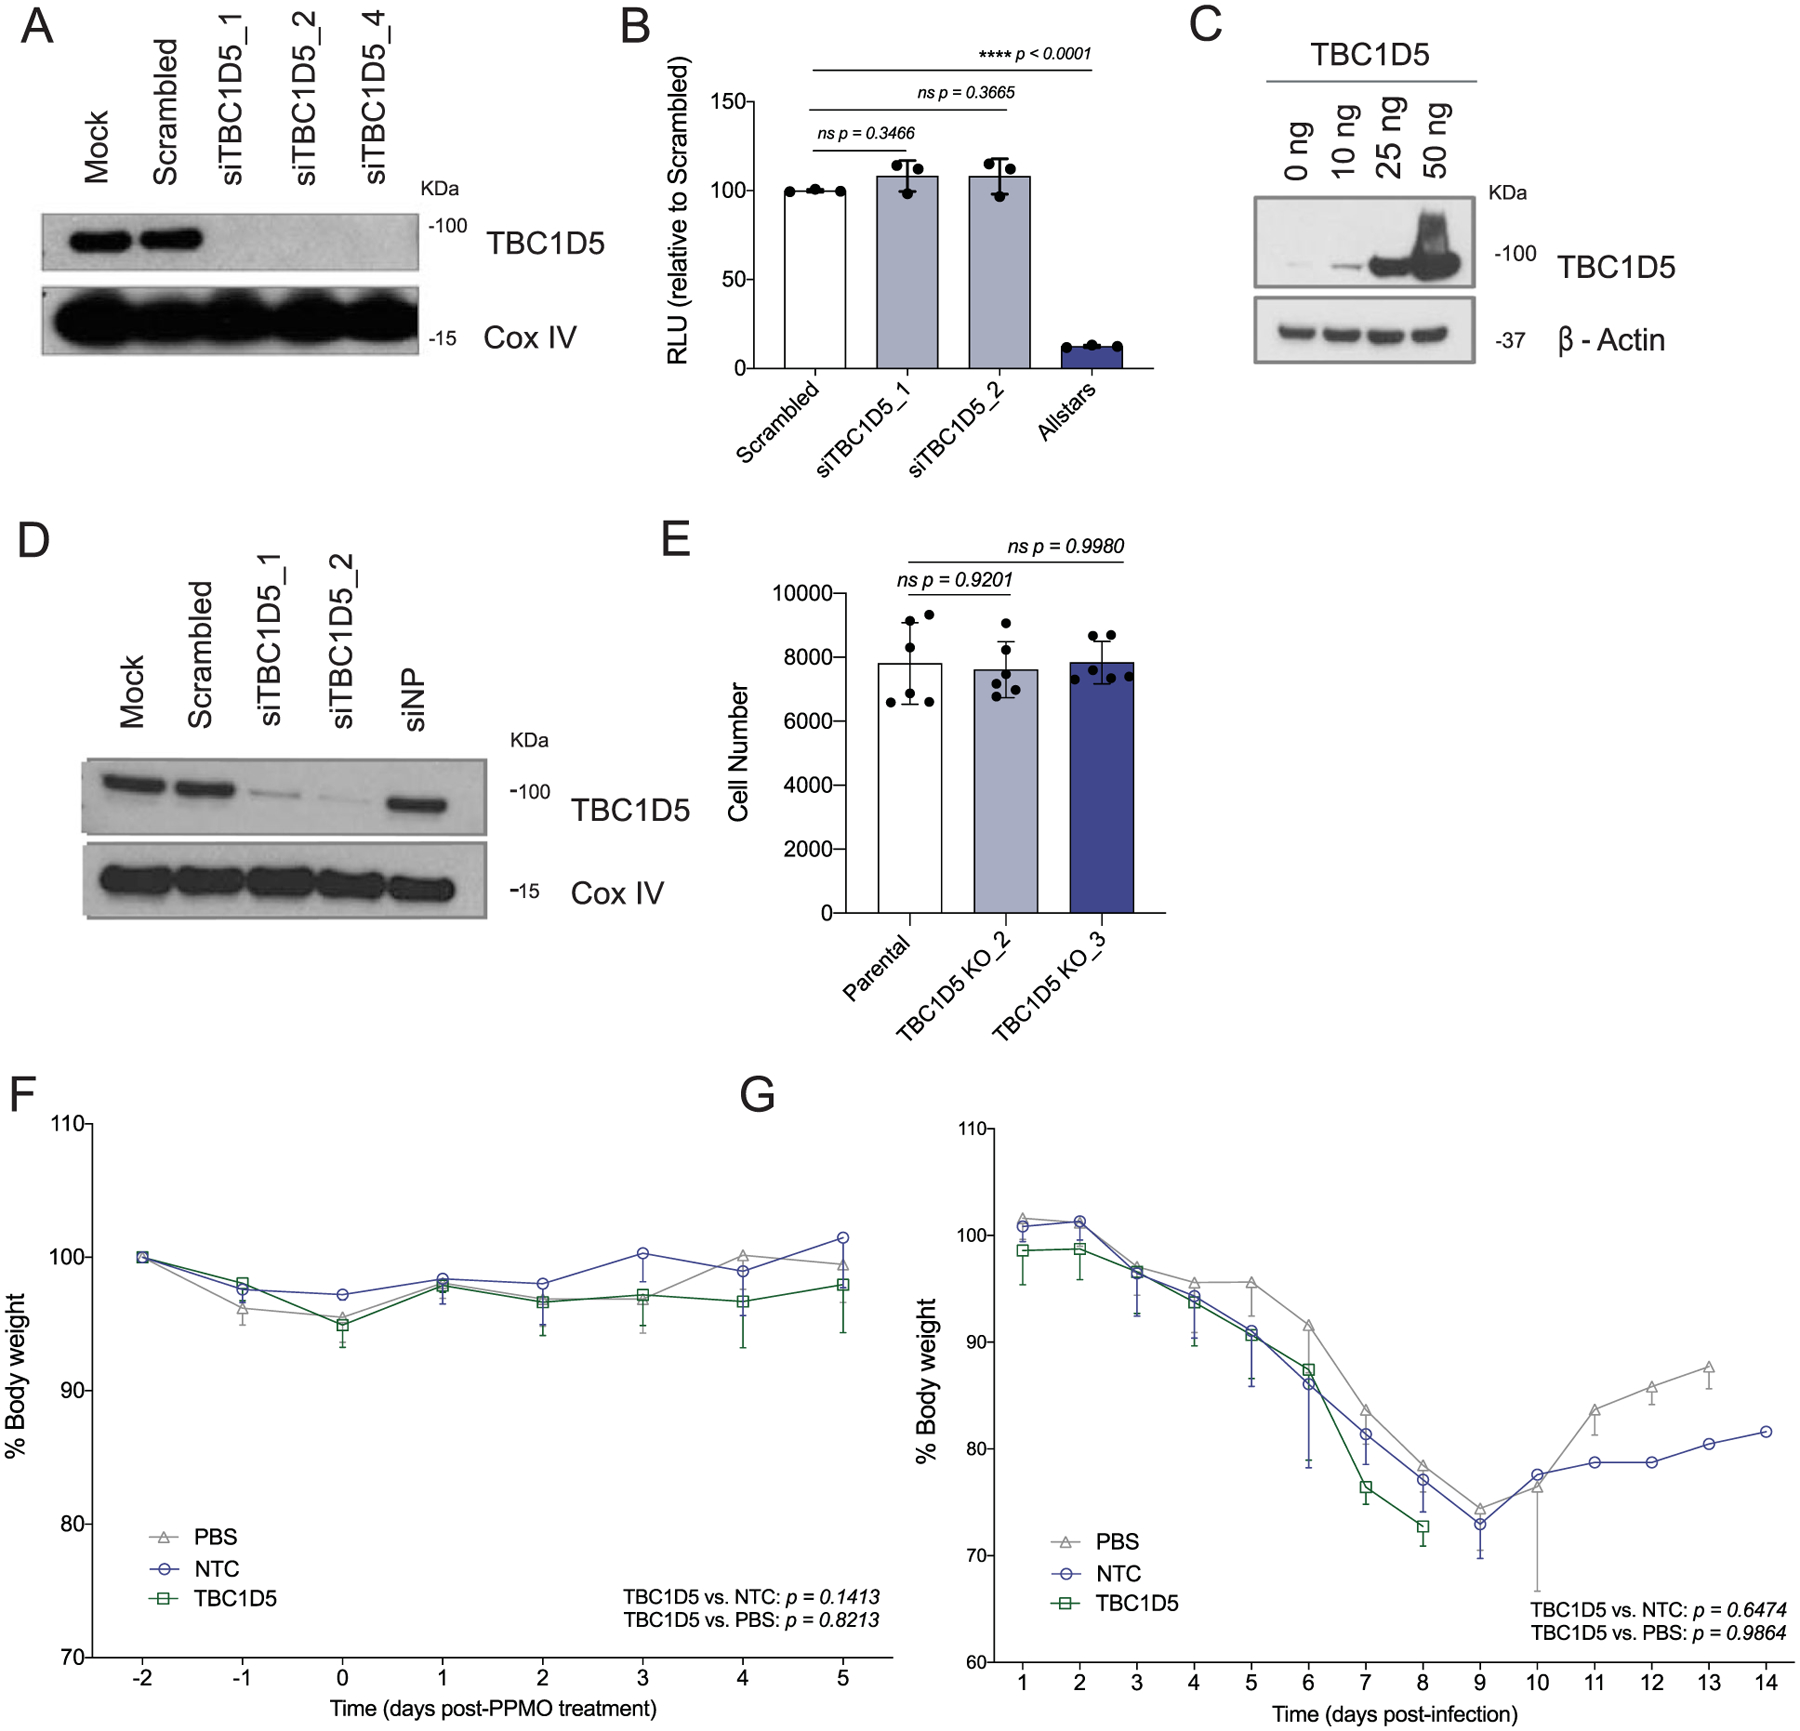
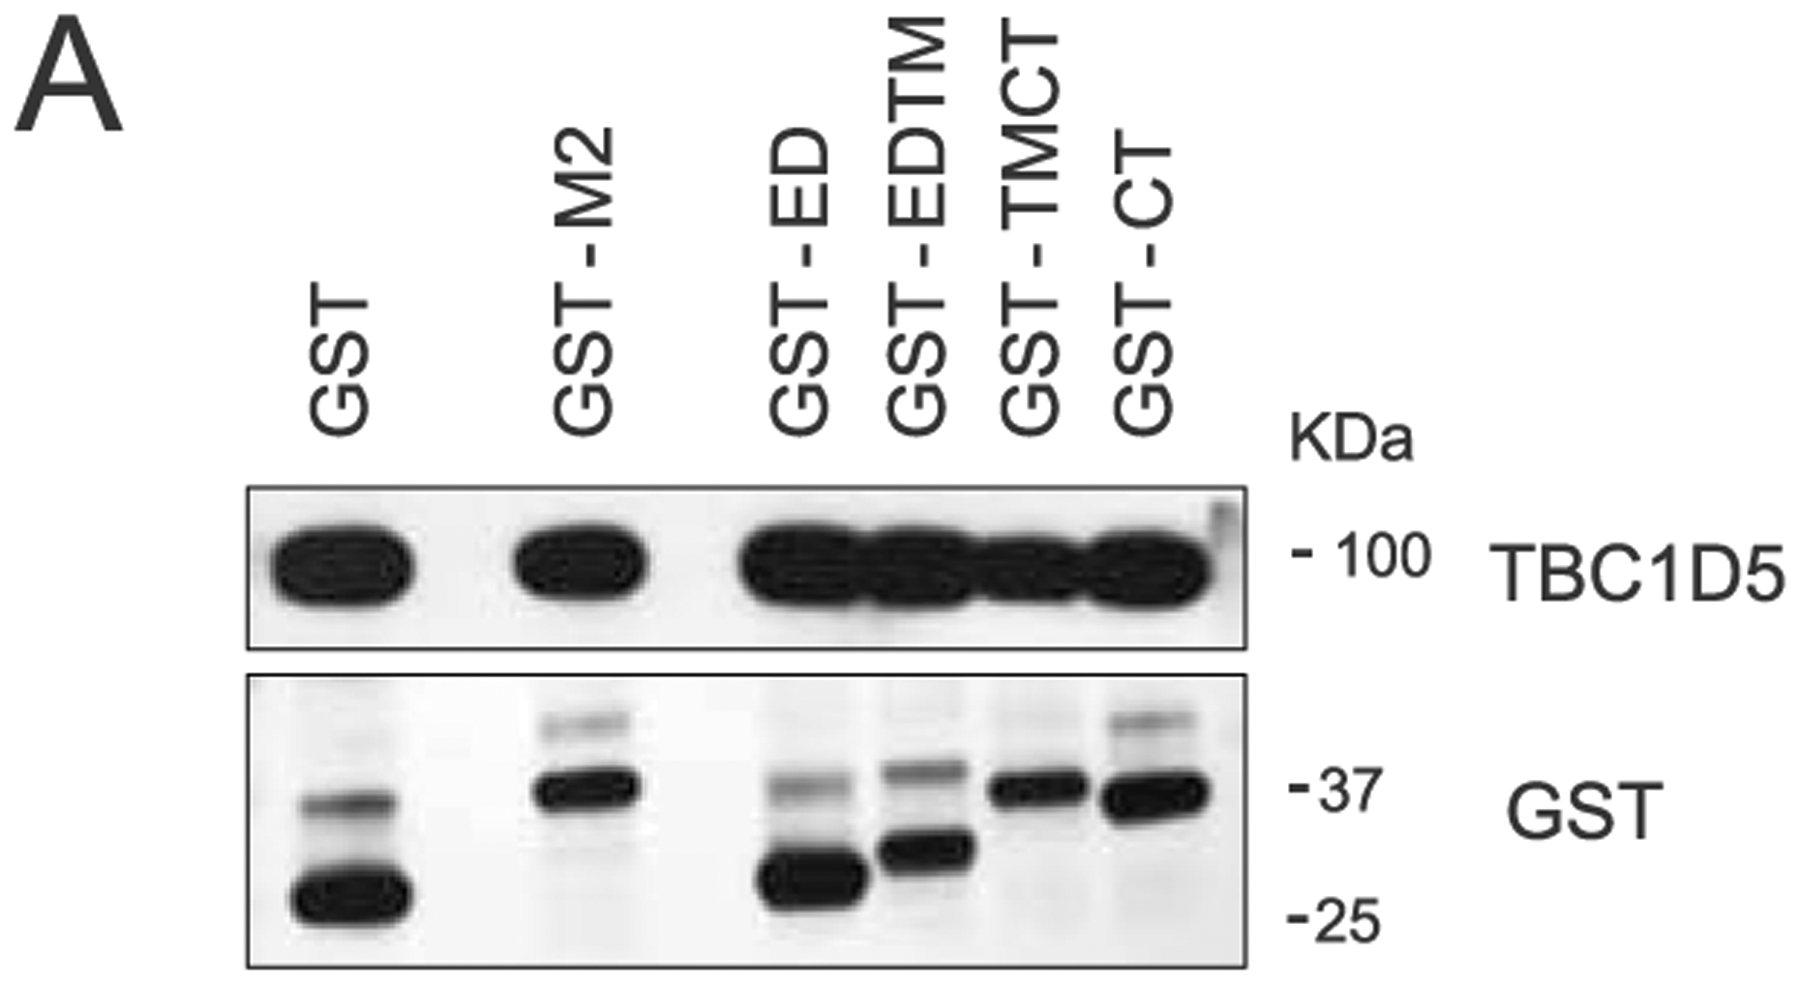
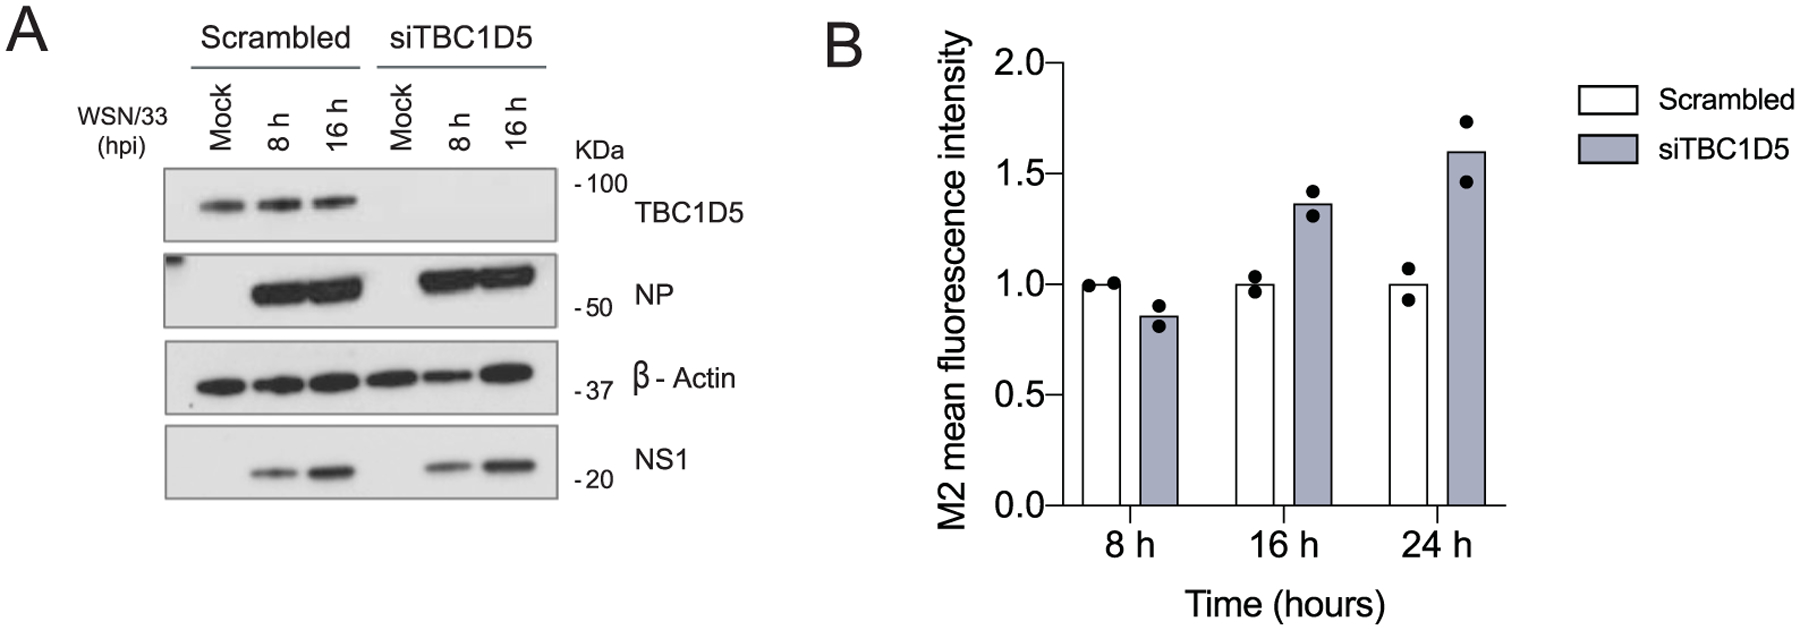
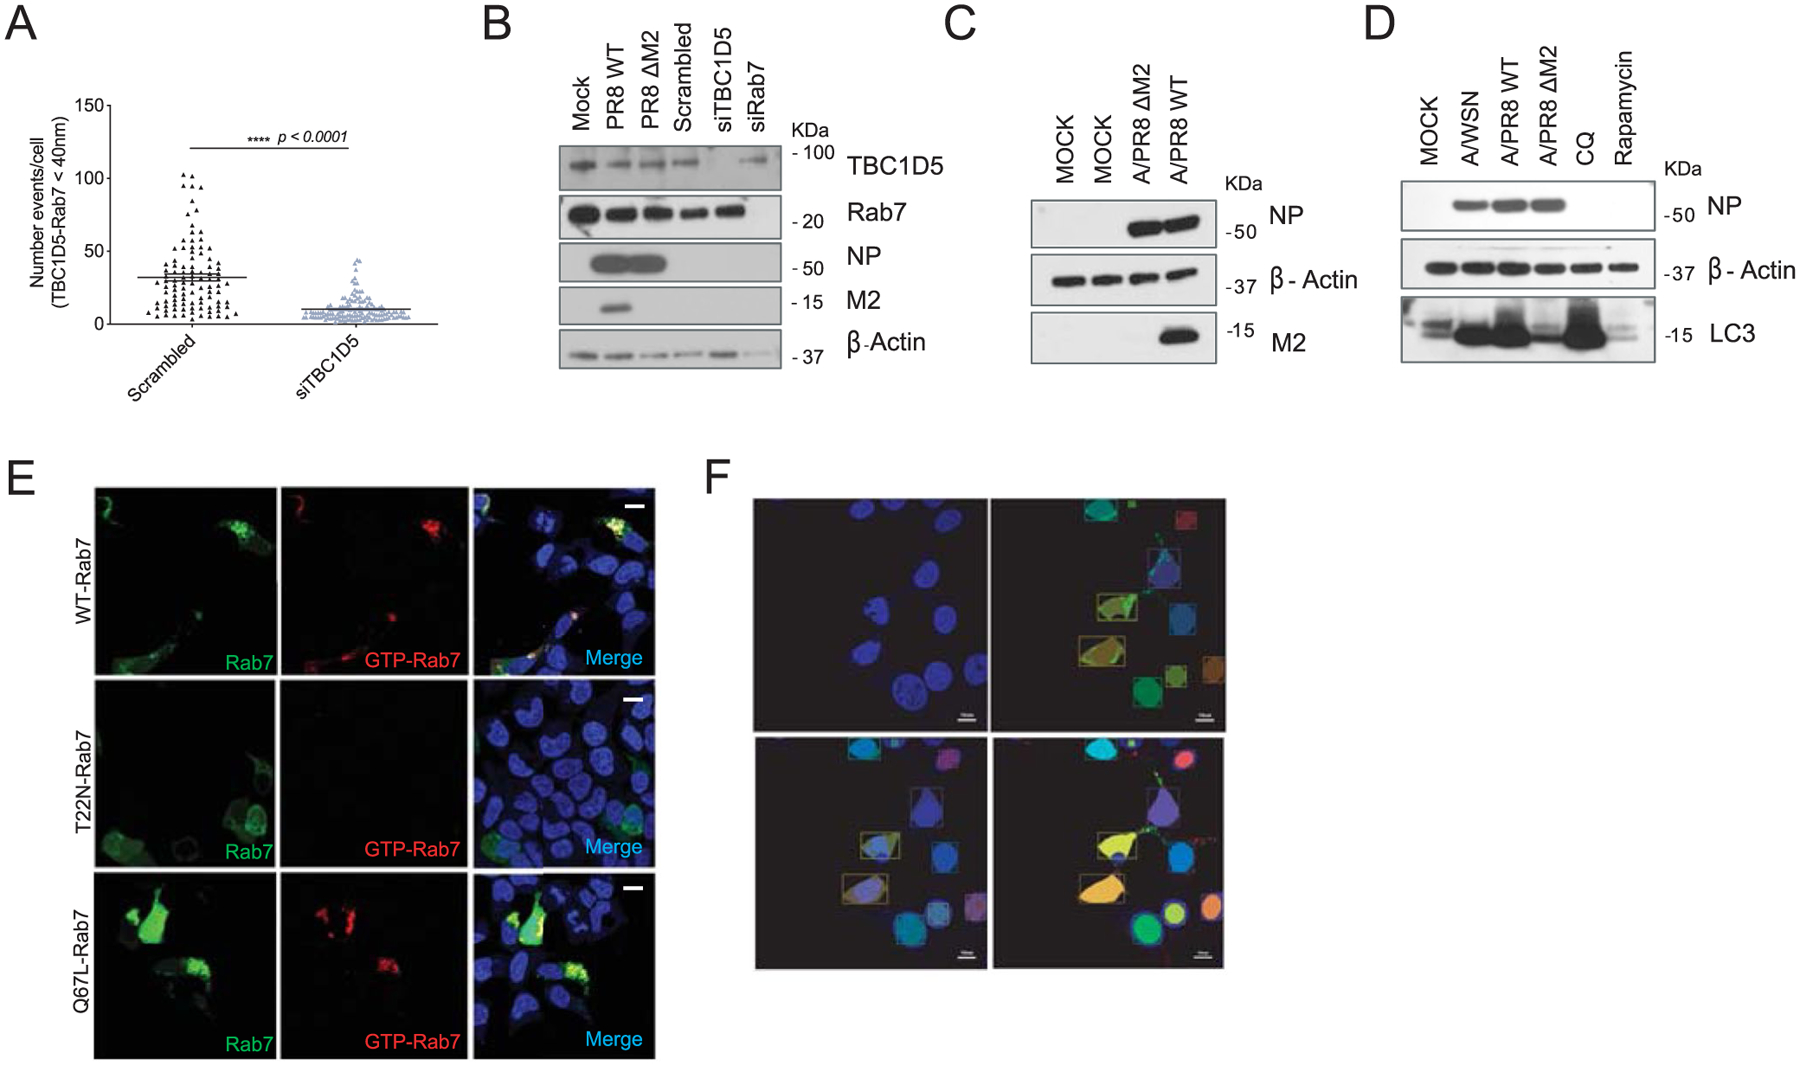
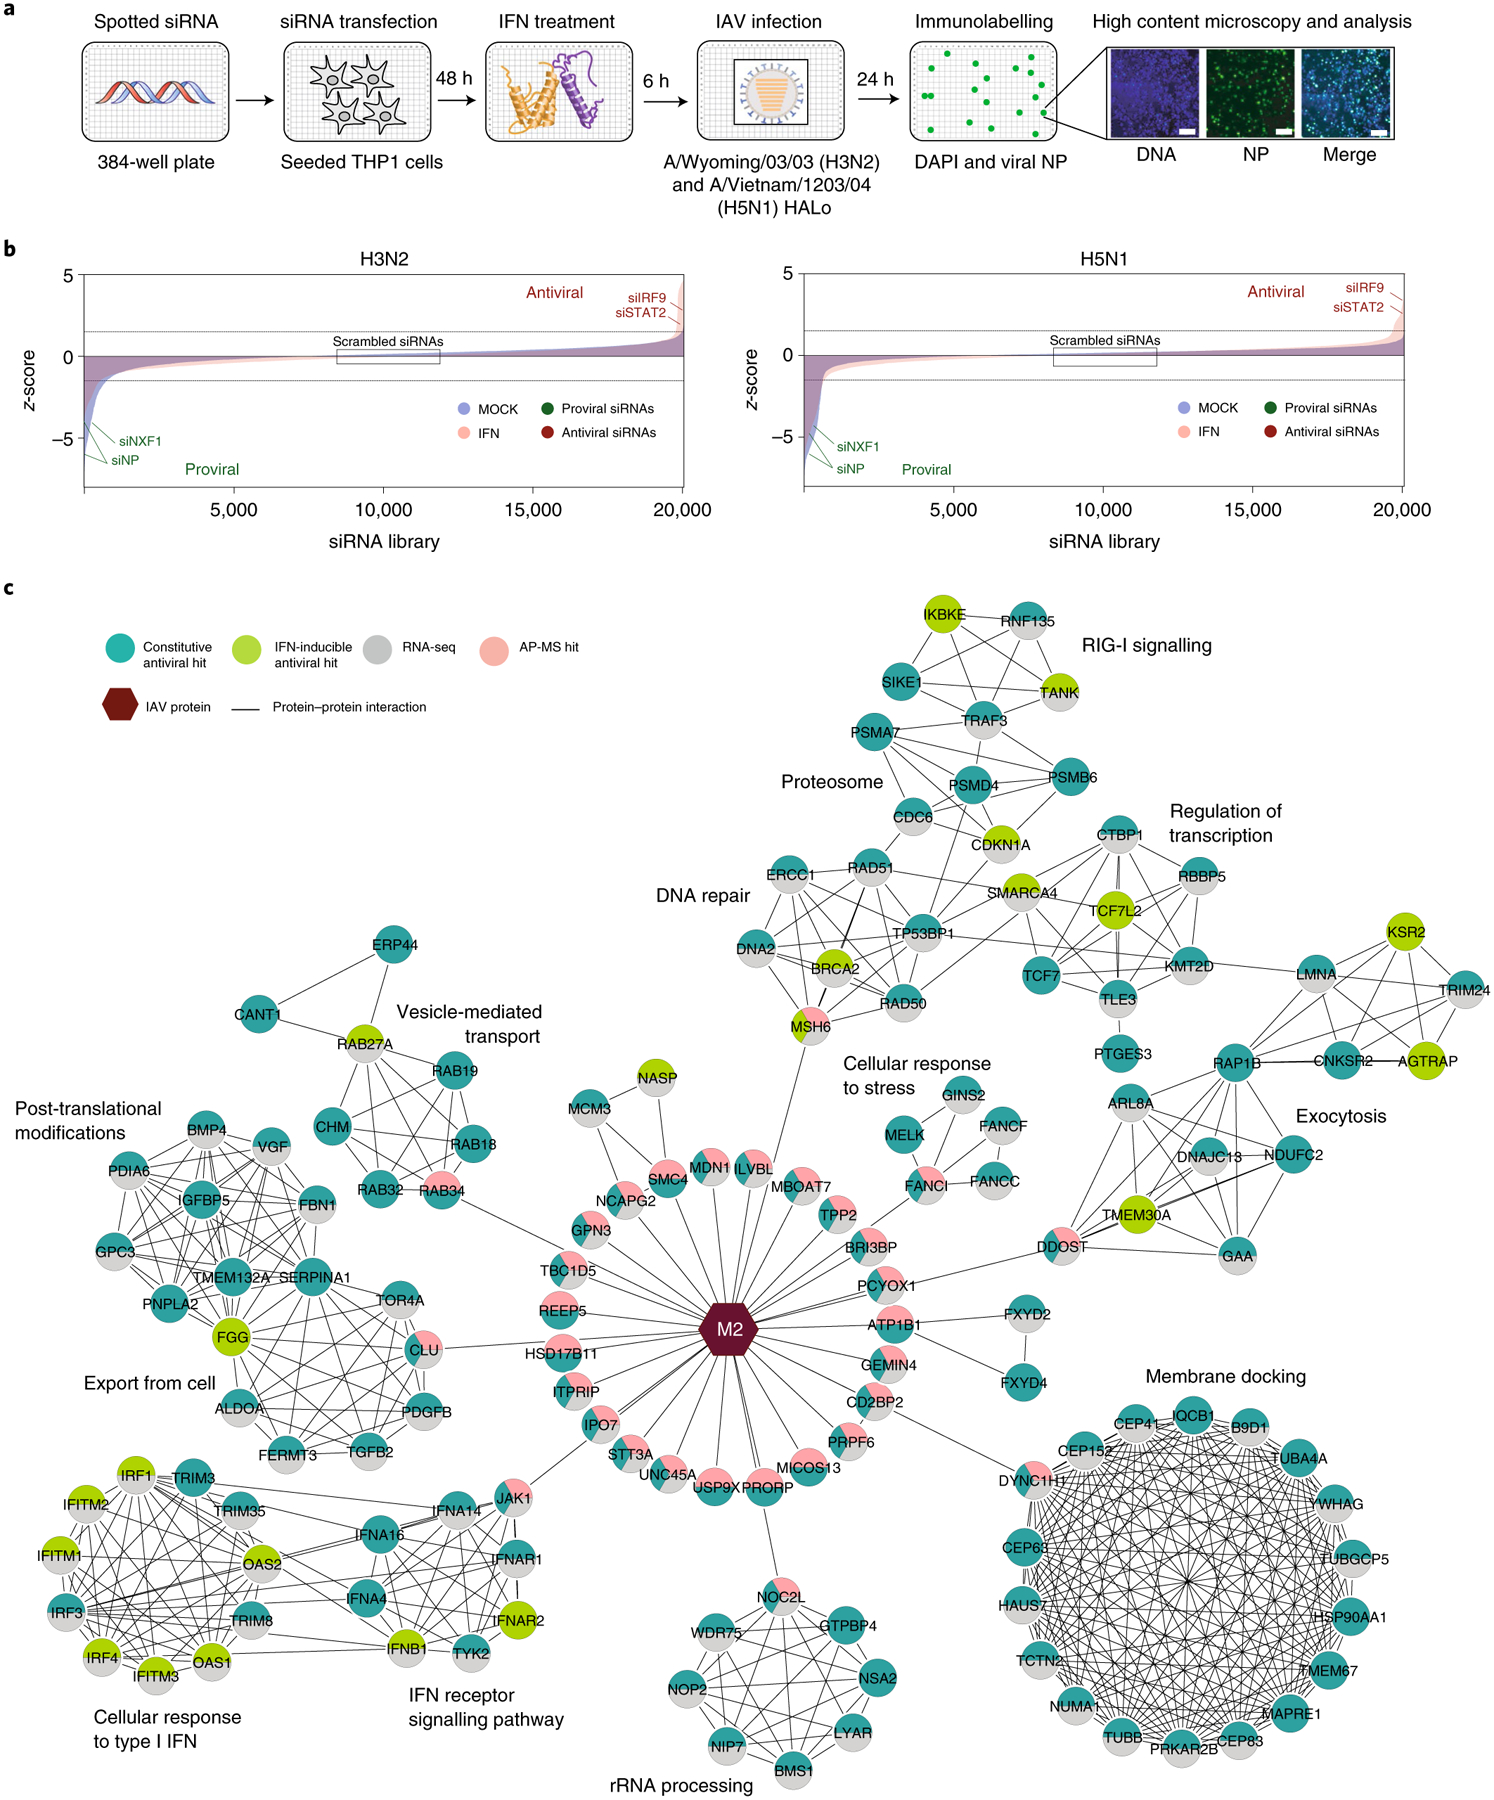
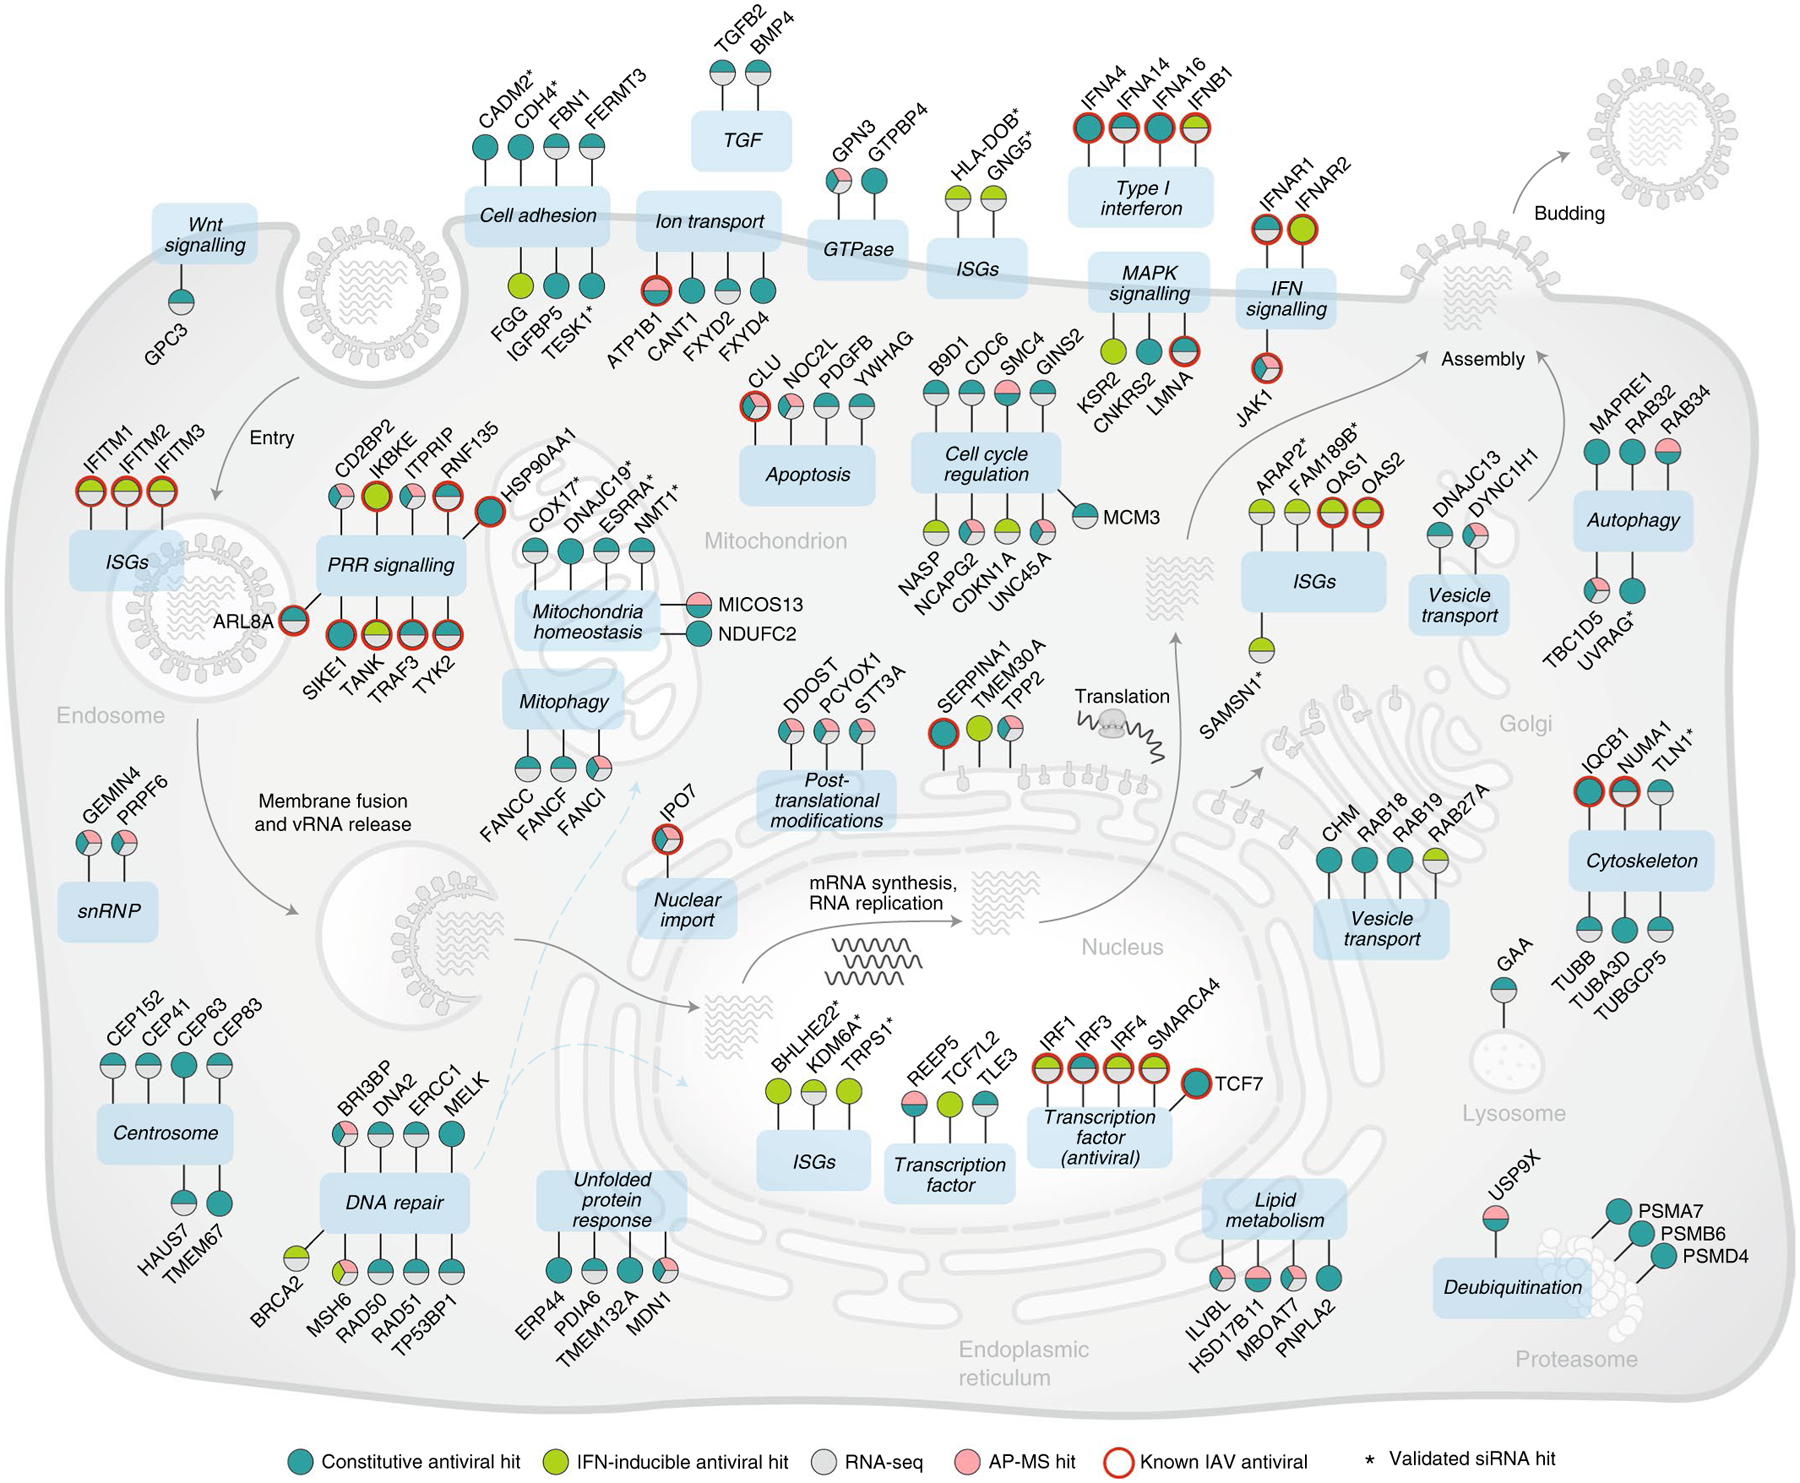
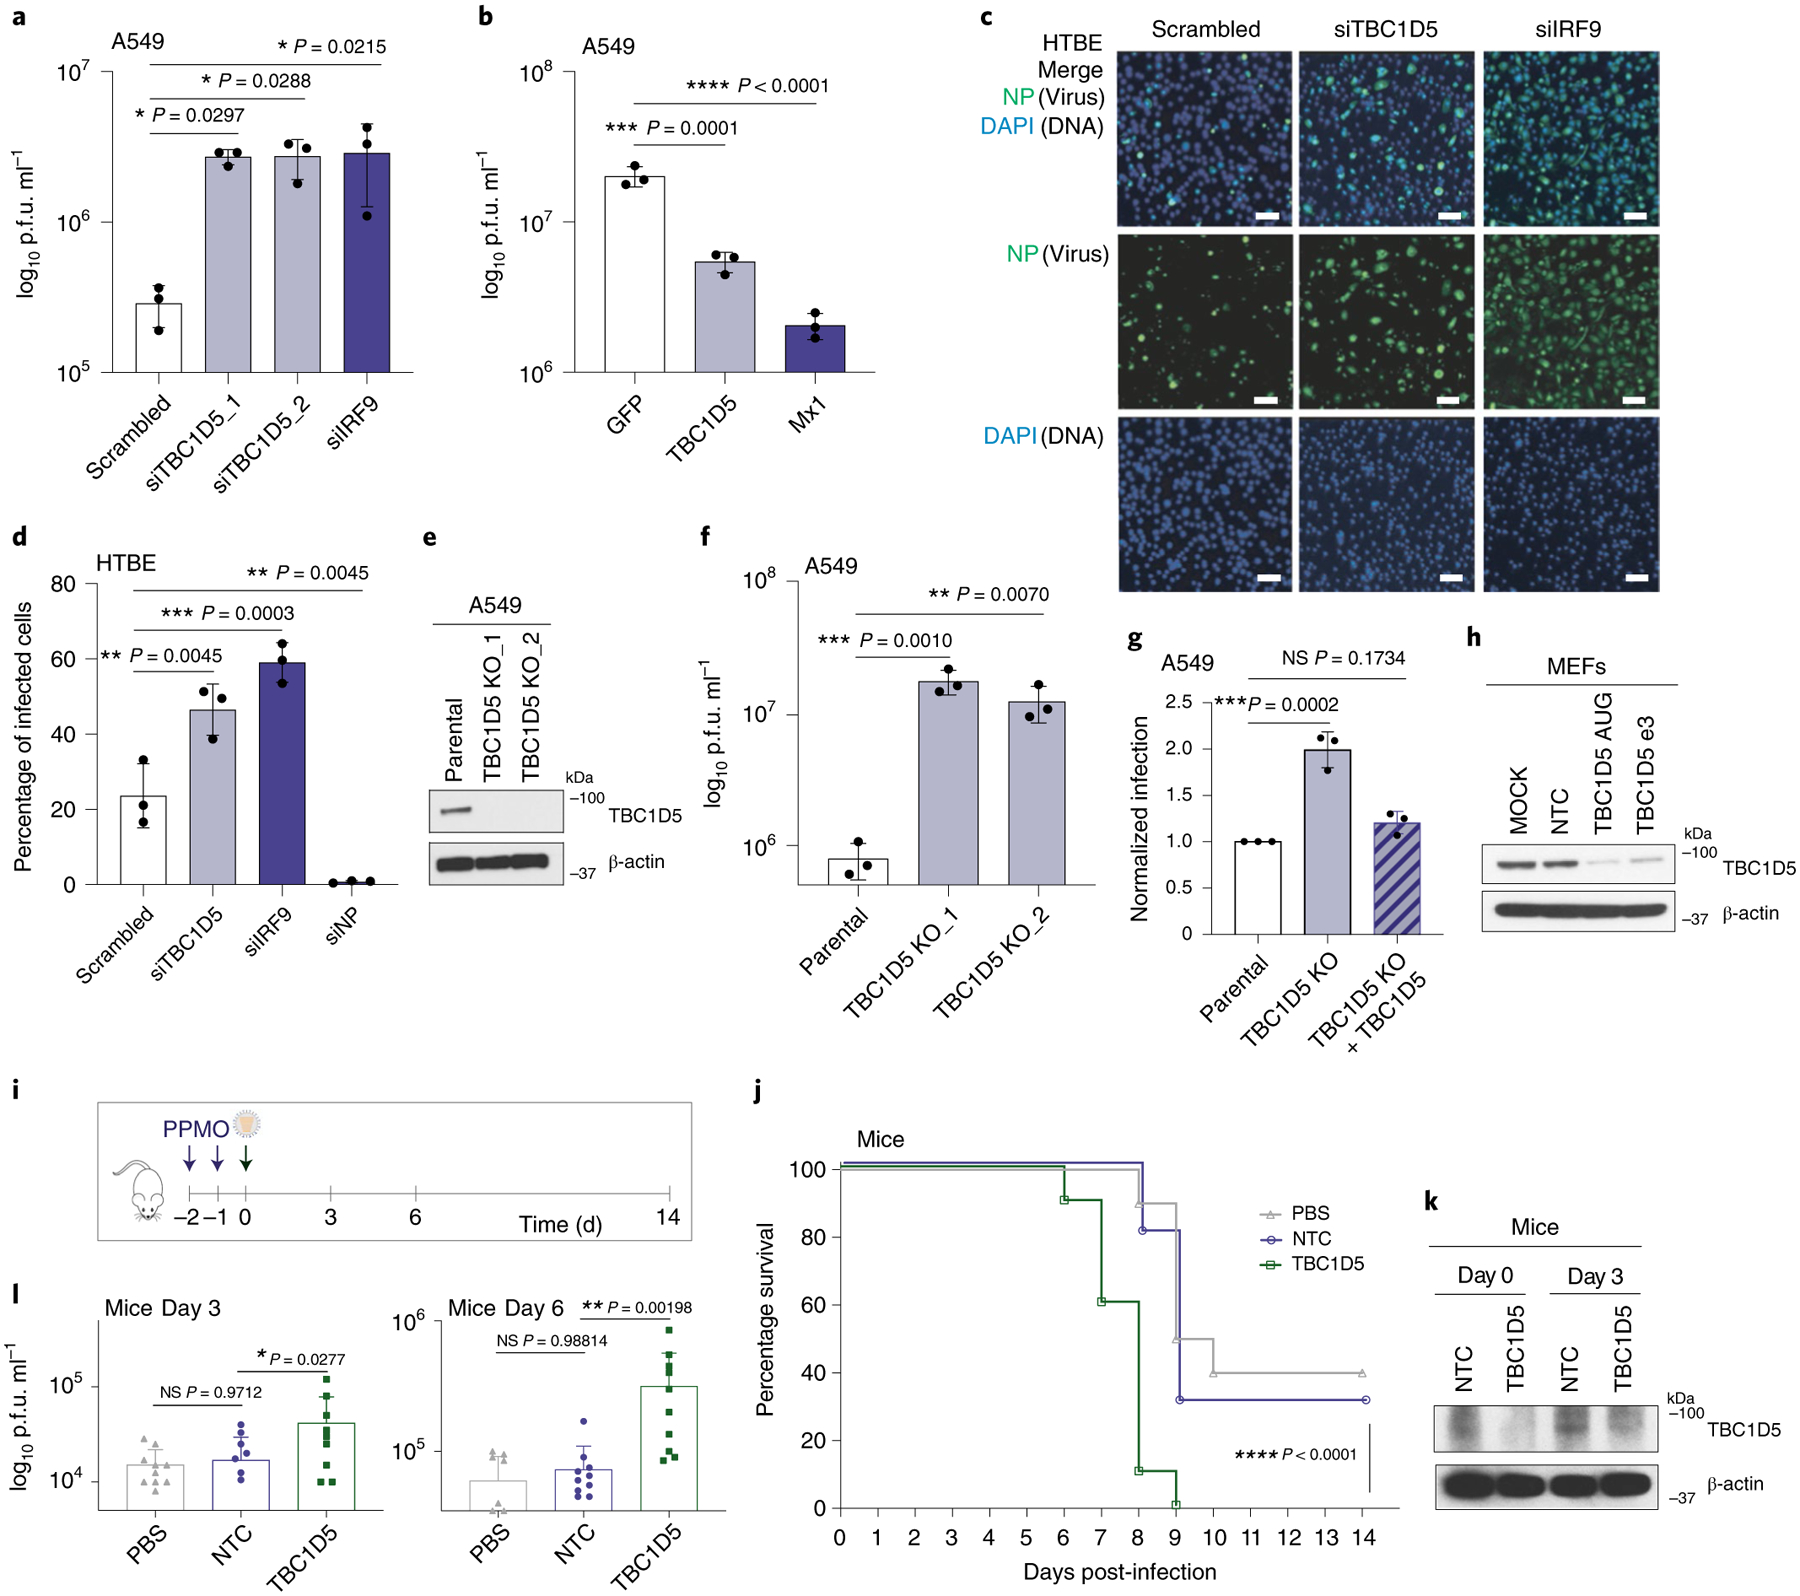
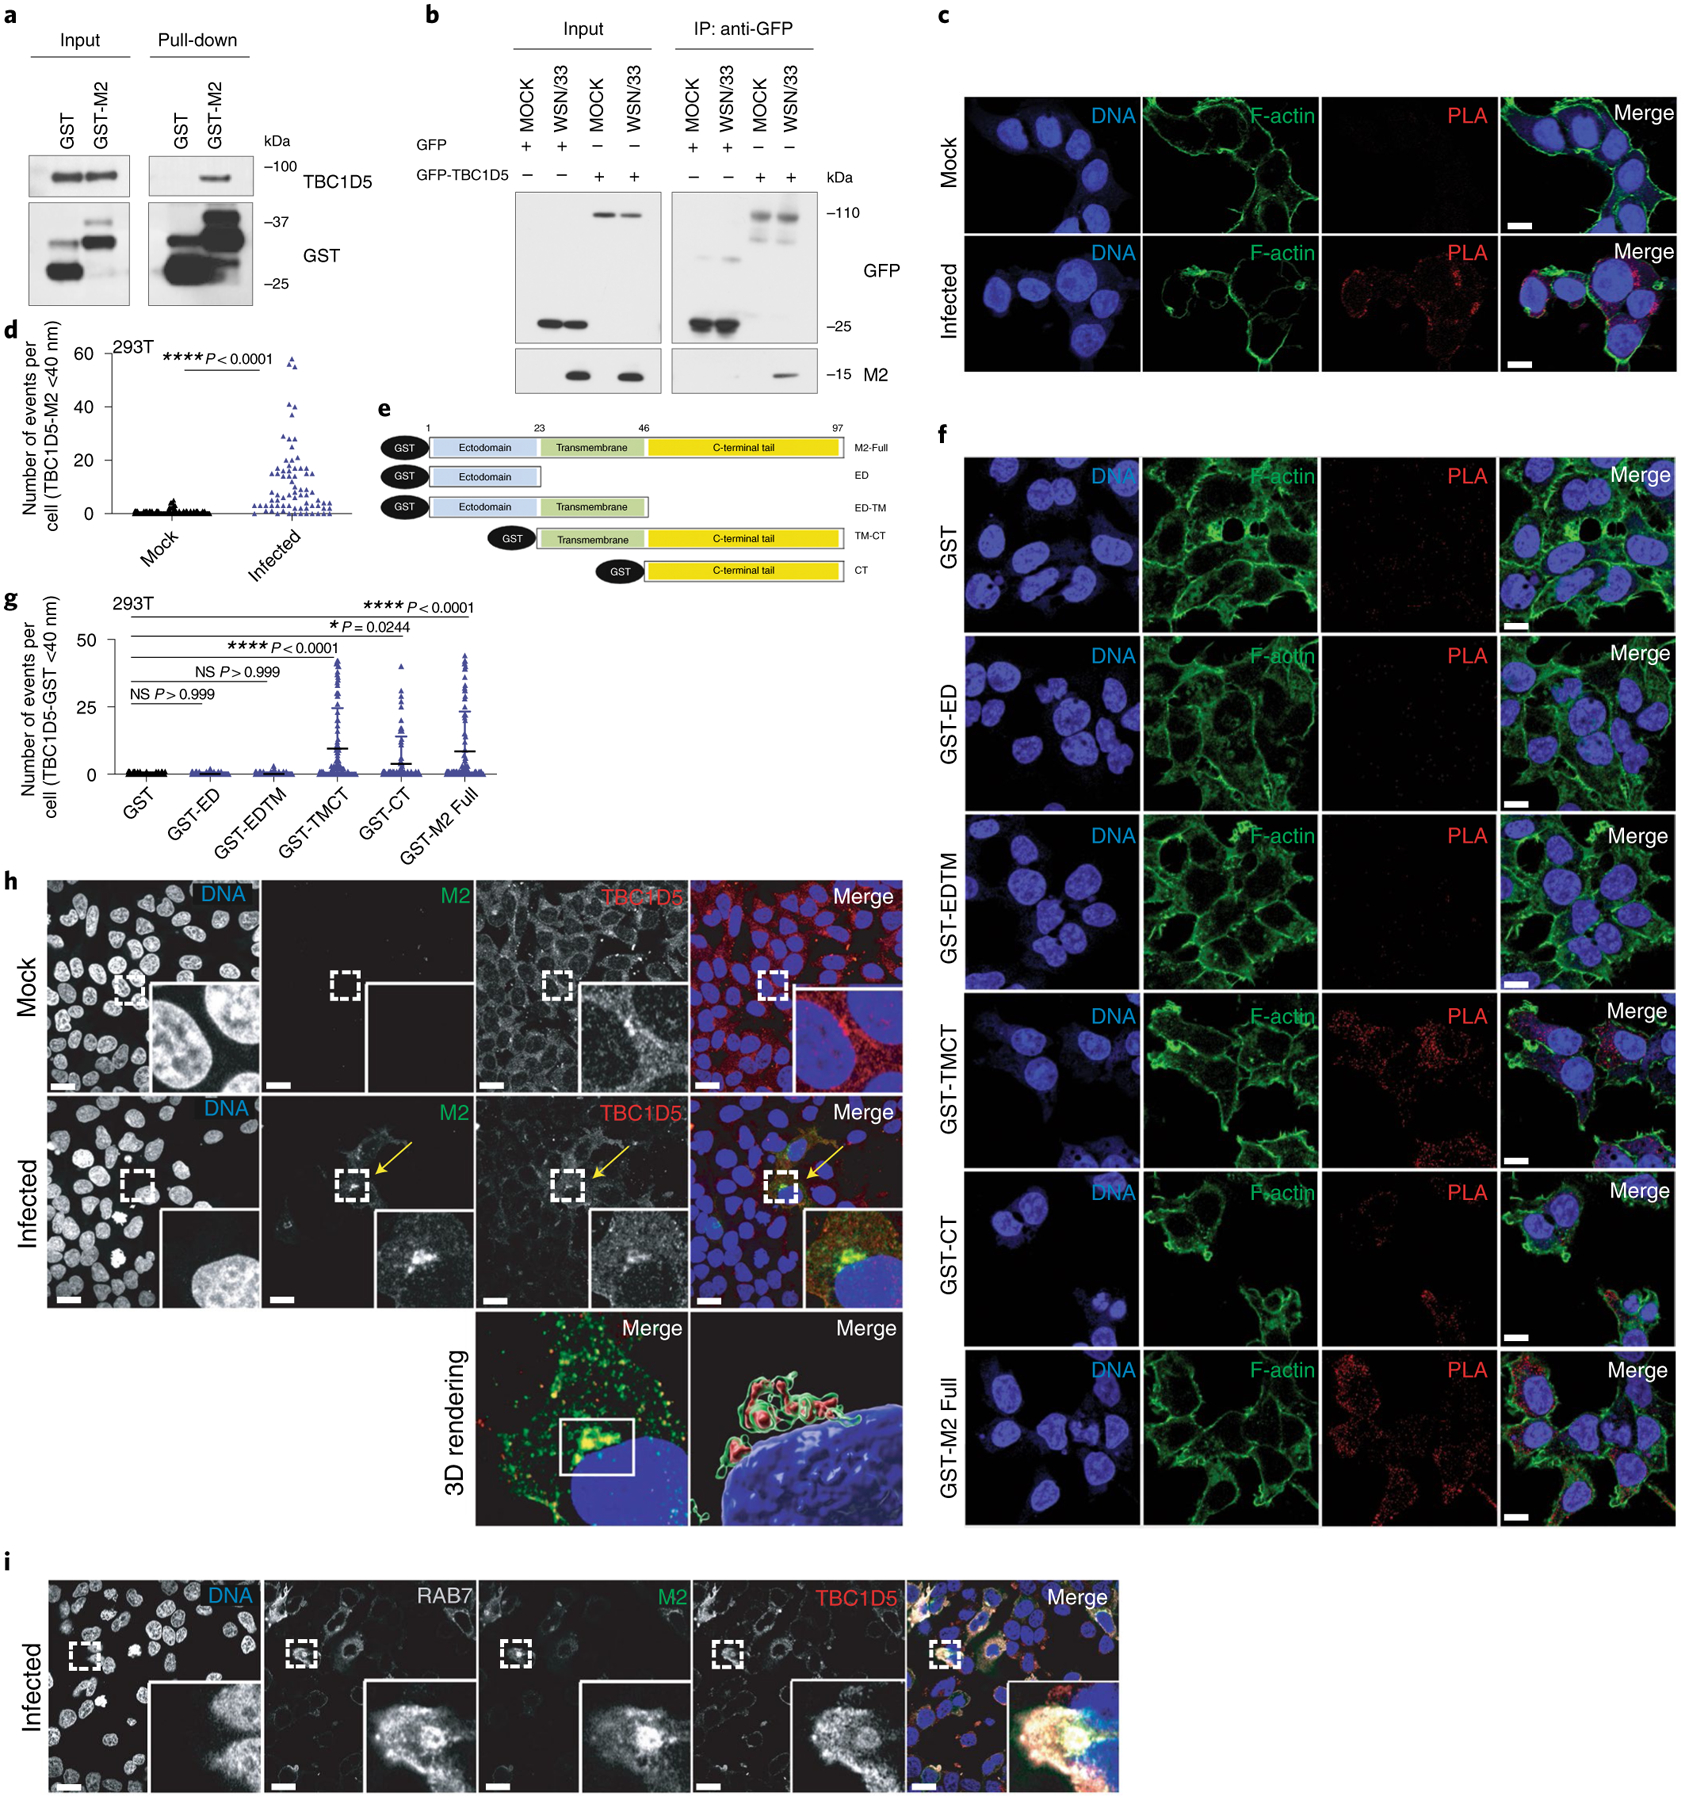
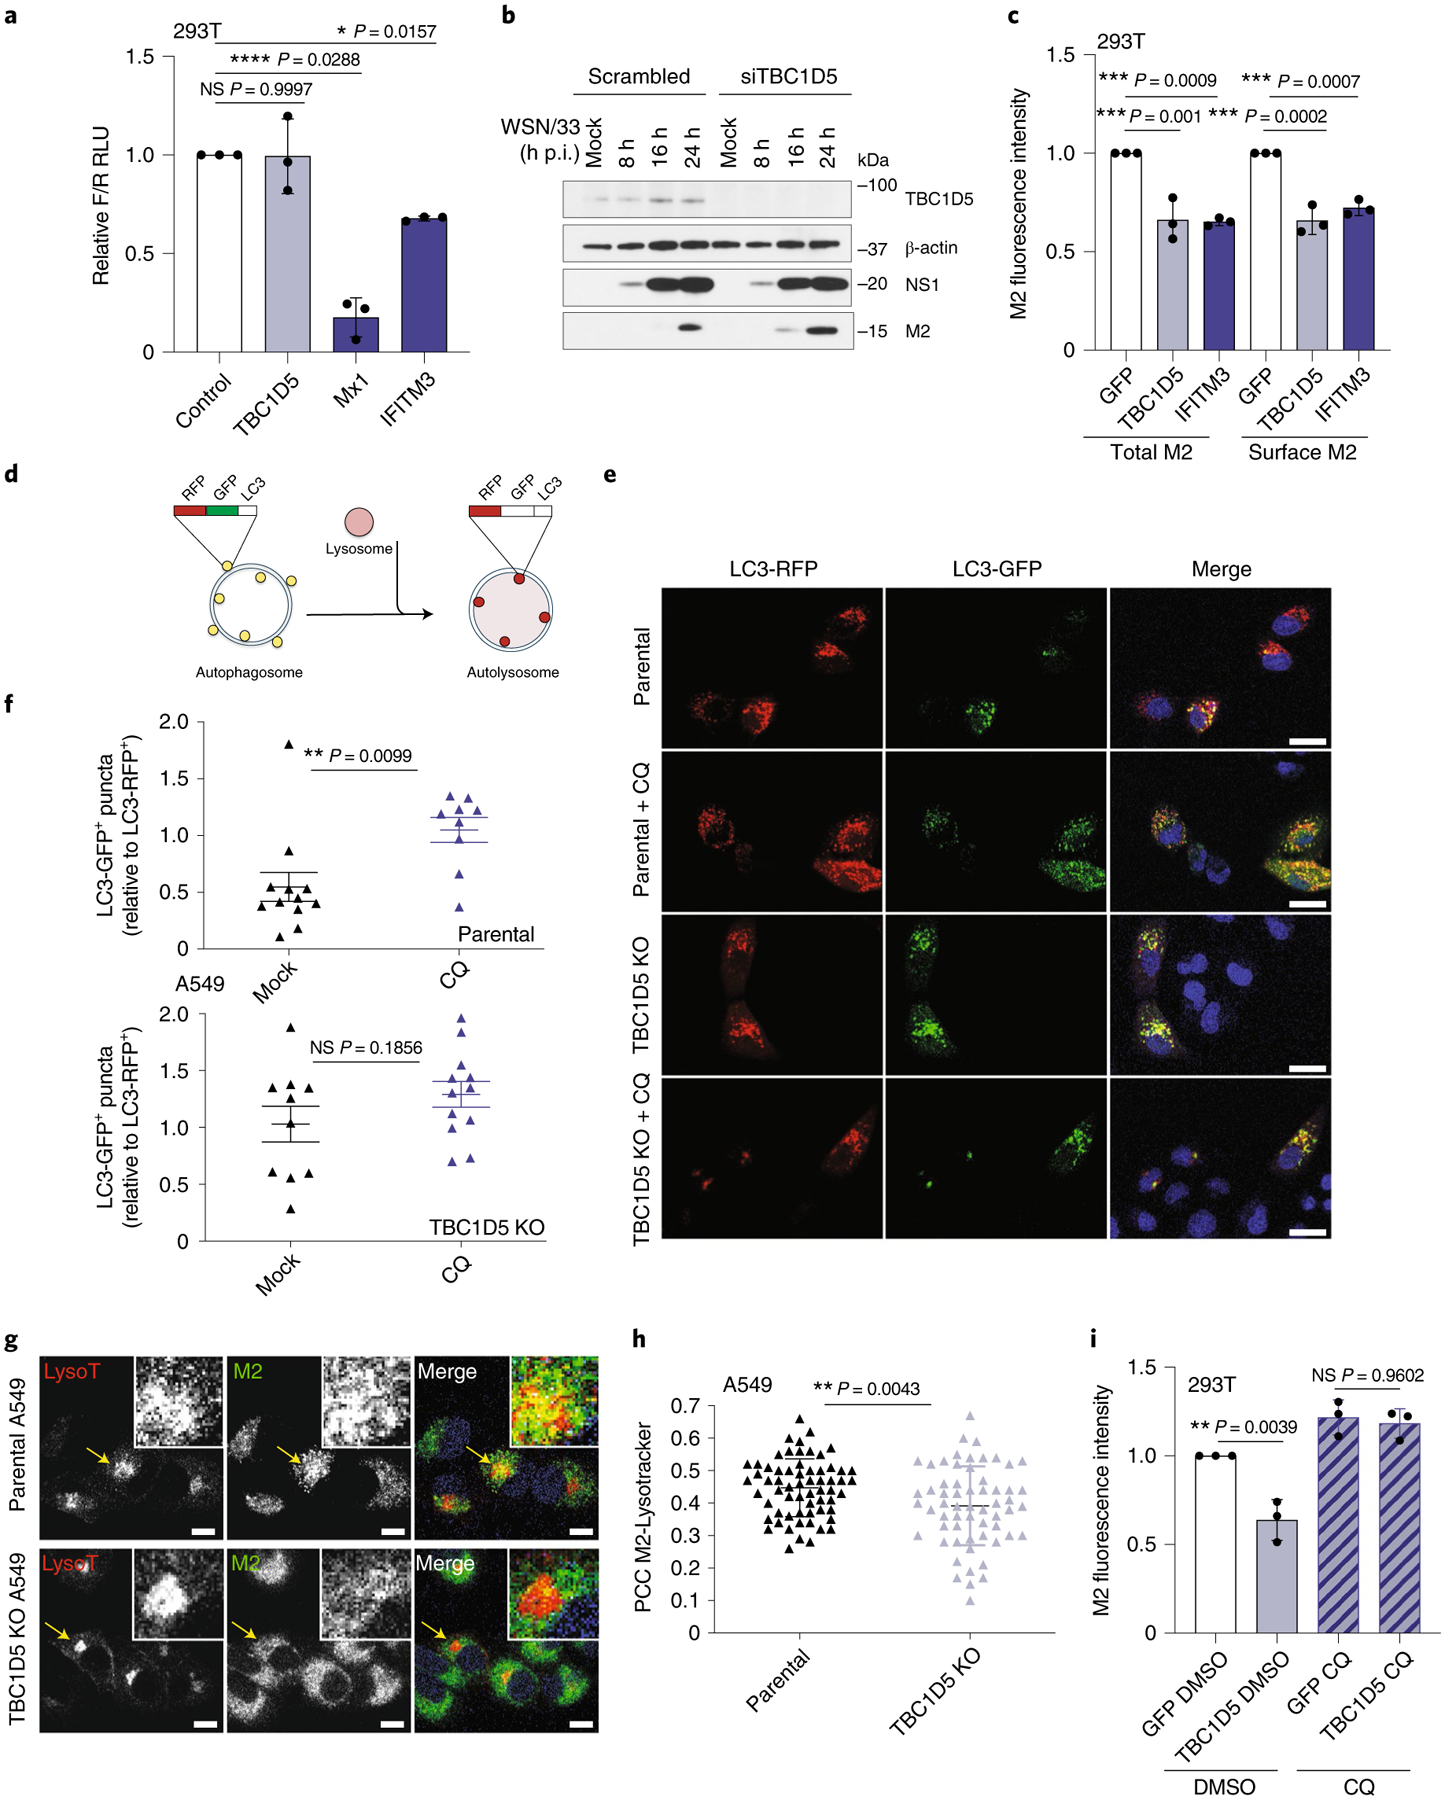
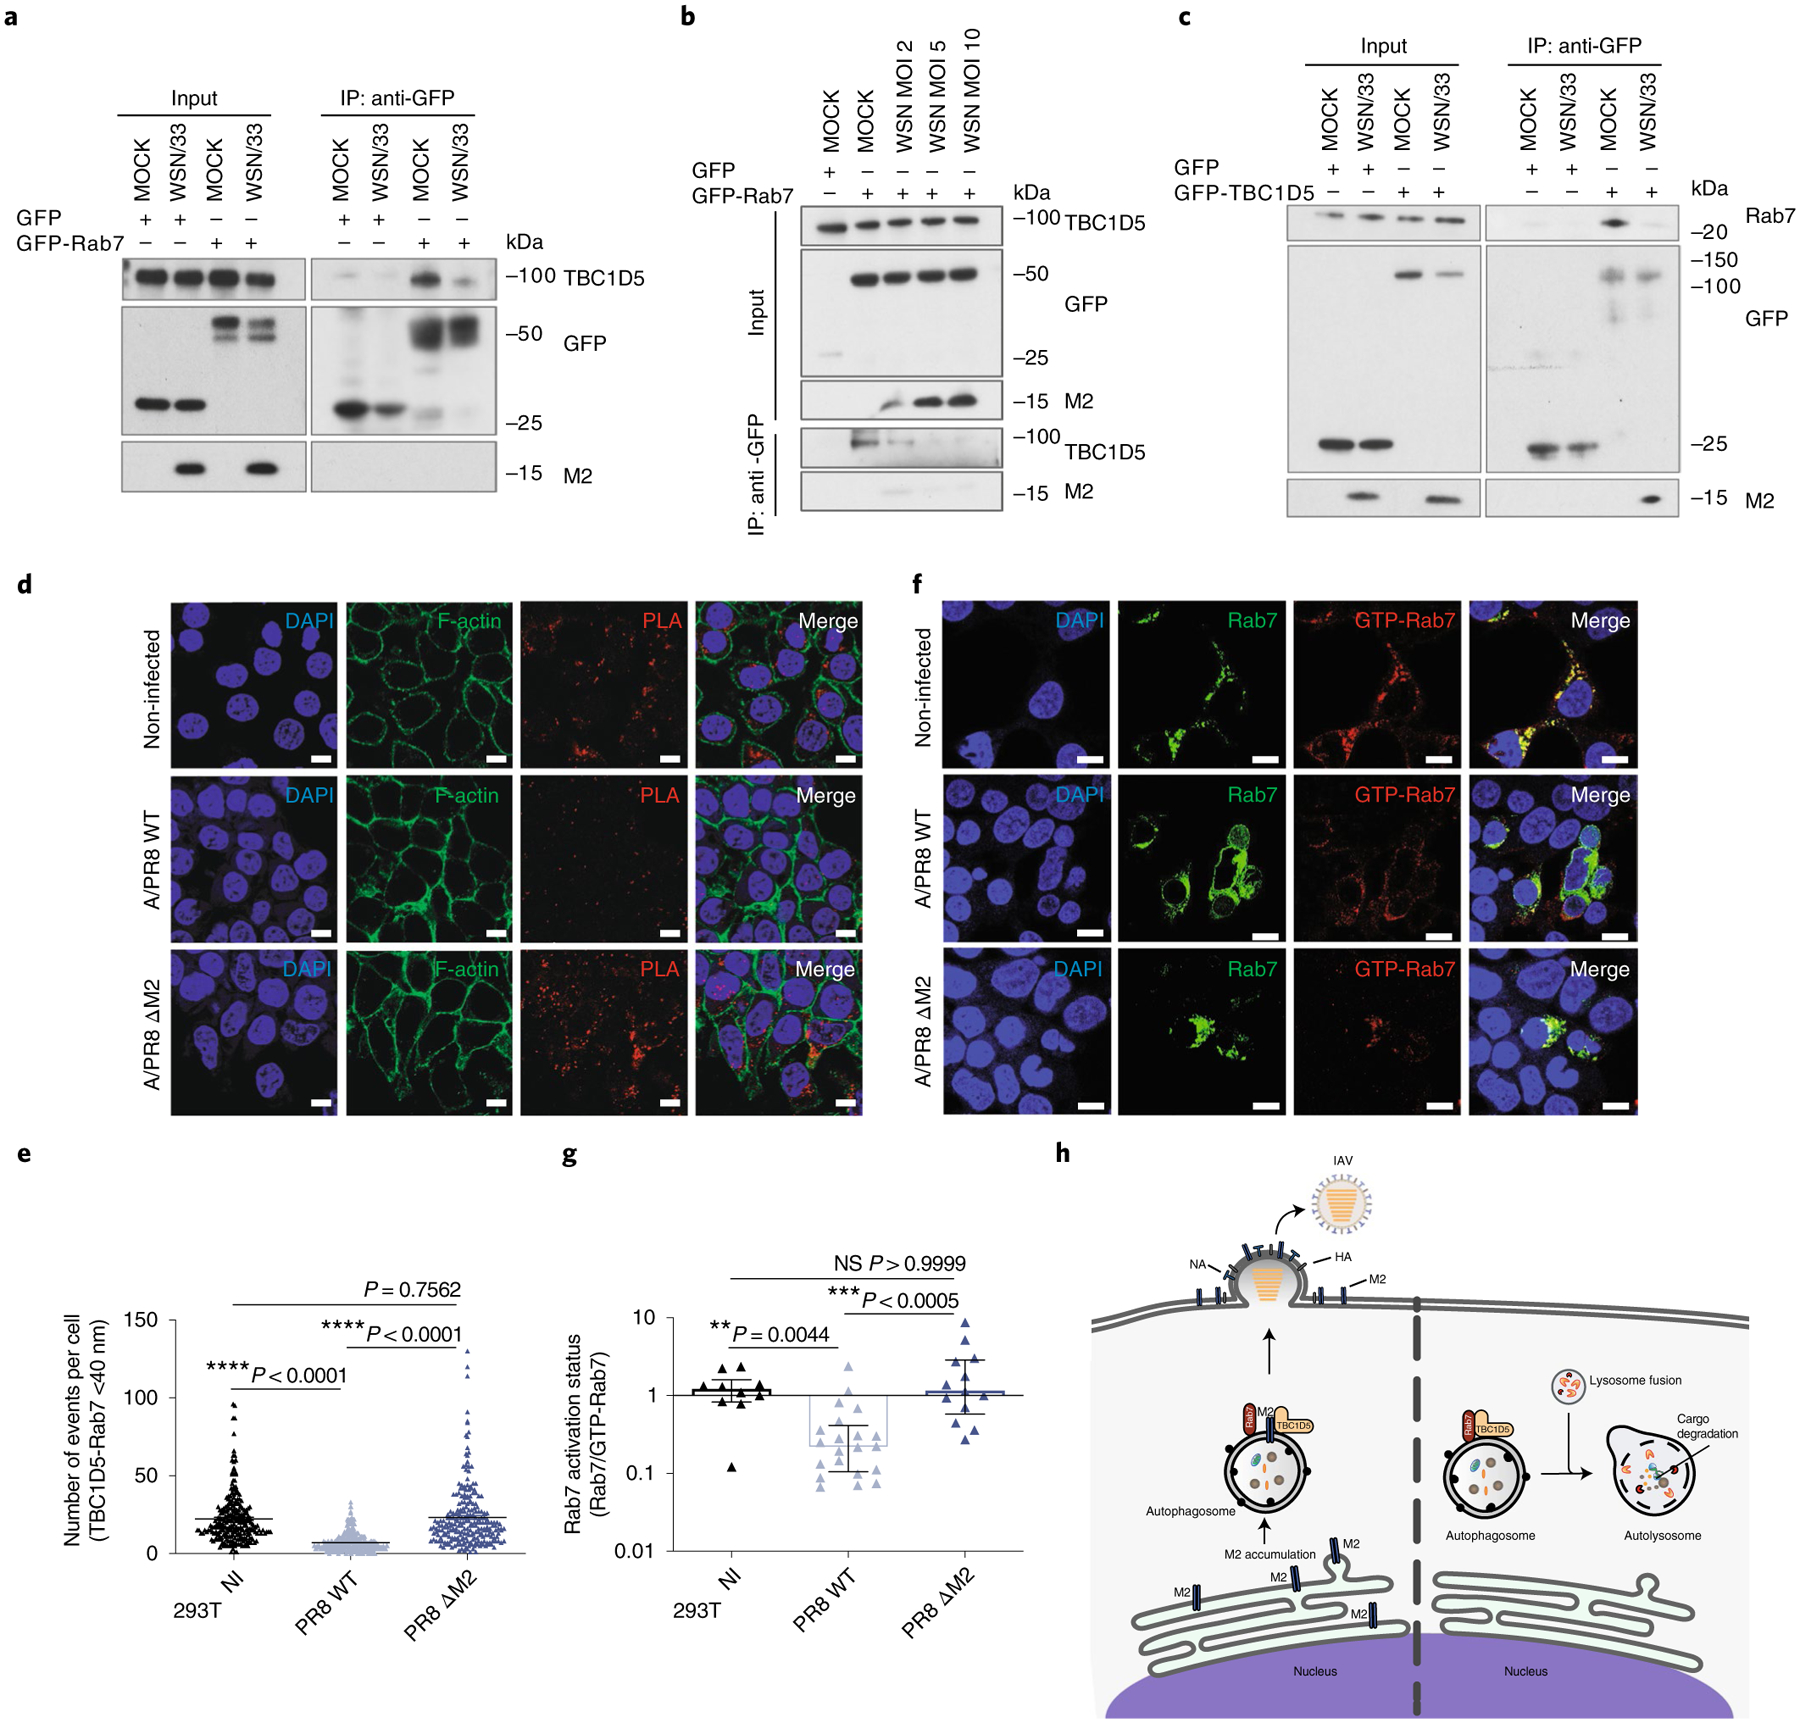
The fate of influenza A virus (IAV) infection in the host cell depends on the balance between cellular defence mechanisms and viral evasion strategies. To illuminate the landscape of IAV cellular restriction, we generated and integrated global genetic loss-of-function screens with transcriptomics and proteomics data. Our multi-omics analysis revealed a subset of both IFN-dependent and independent cellular defence mechanisms that inhibit IAV replication. Amongst these, the autophagy regulator TBC1 domain family member 5 (TBC1D5), which binds Rab7 to enable fusion of autophagosomes and lysosomes, was found to control IAV replication in vitro and in vivo and to promote lysosomal targeting of IAV M2 protein. Notably, IAV M2 was observed to abrogate TBC1D5-Rab7 binding through a physical interaction with TBC1D5 via its cytoplasmic tail. Our results provide evidence for the molecular mechanism utilised by IAV M2 protein to escape lysosomal degradation and traffic to the cell membrane, where it supports IAV budding and growth.


Figures

Extended Data Fig. 1 |
Extended Data Fig. 1 |. Global genetic screen to identify host-restriction factors for IAV.
(a) THP-1 cells were seeded overnight and then treated with 100 IU/ml universal interferon or mock-treated for 6 h. Cells were then treated with 1 μM oseltamivir for 2 h before infection with A/Wyoming/03/03 H3N2 (MOI = 0.50). At 24 h post-infection the percentage (%) of infected cells was calculated based on DAPI staining and viral nucleoprotein (NP) immunostaining. Data show mean ± SD from one representative experiment in triplicate (n = 3) of at least two independent experiments. Statistical significance was calculated using two-way ANOVA with Sidak’s multiple comparison test. (b) Correlation plots of z-score values for genome-wide siRNA screens of IFN- or mock-treated THP-1 cells infected with H3N2 or H5N1 IAVs. (c) Venn diagram shows the overlap between the genome-wide siRNA screen conducted in this study and previously published proviral (left) or antiviral (right) cellular factors identified by Tripathi, Pohl et al., Karlas et al.,, Brass et al.,, Konig et al., 2010, Shapira et al., 2010, Han et al. and Watanabe et al.,.
Extended Data Fig. 2 |
Extended Data Fig. 2 |. Global analysis of IAV cellular restriction.
The list of factors identified by siRNA screening (z-score ≥ 0.5), or RNA-seq (log2FC ≥ 1.0 or ≤ −1.0 and P value < 0.005) were subjected to supervised community detection,. The resultant hierarchy is shown. Here, each node represents a community of densely interconnected proteins, and each edge (arrow) denotes containment of one community (edge target) by another (edge source). Enriched biological processes are indicated. The percentage of each community that corresponds to siRNA hits is shown in green, and RNA-seq in grey. Nodes indicate proteins, and edges indicate interactions as defined by STRING (High Confidence (Score ≥ 0.7), available at NDEx. (a) Hierarchy of IFN-inducible antiviral factors. (b) Hierarchy of constitutive expressed antiviral factors.
Extended Data Fig. 3 |
Extended Data Fig. 3 |. Prioritized antiviral factors.
Prioritized antiviral factors clustered by functional category and proposed/known role in IAV replication. Factors with * represent those identified as M2 interactors. Factors in bold represent those not previously associated with IAV restriction,,,,–.
Extended Data Fig. 4 |
Extended Data Fig. 4 |. TBC1D5 restricts IAV replication and growth in vitro, ex vivo and in vivo.
A549 cells were transfected with indicated siRNAs. At 48 h post-transfection, cells were (a) subjected to SDS–PAGE and immunoblotted using antibodies specific for TBC1D5 and β-actin (loading control). Blot is representative of two independent experiments, or (b) Cell viability was assessed using Cell Titer Glo and compared to scrambled (non-targeting, negative control) and Allstars (toxic siRNA, positive control). Data show mean ± SD from one representative experiment in triplicate (n = 3) of at least two independent experiments. (c) A549 cells were transfected with a plasmid encoding TBC1D5 (0–50 ng) for 36 h. Cells were then subjected to SDS–PAGE and immunoblotted using antibodies specific for TBC1D5 and β-actin. Blot is representative of two independent experiments. (d) HTBE cells were transfected for 36 h with indicated siRNAs. At 48 h post-transfection, cell lysates were subjected to SDS–PAGE and immunoblotted using antibodies specific for TBC1D5 and Cox IV (loading control). Blot is representative of two independent experiments. (e) A549 parental and two TBC1D5 KO clones cell numbers were determined 48 h post-seeding using image-based analysis of DAPI (nuclei) staining. Data show mean ± SD from one representative experiment in triplicate (n = 3) of at least two independent experiments. Five-week old female BALB/c mice were administered 100 μg PBS, NTC or TBC1D5 PPMOs (equivalent of 5 mg/kg) intranasally for 2 consecutive days and (f) Mice were monitored over the course of 5 days in the absence of IAV infection to evaluate PPMO-derived cytotoxicity. Data represent percent body weight ± SD from 2 independent experiments each with 3 mice per condition (n = 6). (g) Mice were infected with A/Puerto Rico/8/34 (40 p.f.u.) intranasally and were monitored for body weight over the course of 14 days. Graphs show percent body weight ± SD from 2 independent experiments each with 15 mice per condition (n = 30). (b, e) Statistical significance was calculated using one-way ANOVA with Dunnett’s post hoc test, or Tukey’s multiple comparison post hoc (f, g).
Extended Data Fig. 5 |
Extended Data Fig. 5 |. SDS–PAGe analysis of GST-tagged M2 constructs.
(a) 293 T cells were transfected with a series of N-terminally GST-tagged M2 constructs. At 16 h post-transfection, cells were lysed and levels of TBC1D5, and GST were analysed using SDS–PAGE. Blot is representative of two independent experiments.
Extended Data Fig. 6 |
Extended Data Fig. 6 |. TBC1D5 promotes lysosomal targeting of M2 protein.
(a) 293 T cells were treated with negative control scrambled siRNA or siTBC1D5 for 48 h. Cells were then infected with A/WSN/33 (MOI 2), and at 8 and 16 h p.i. cells were lysed and levels of TBC1D5, NS1, and β-actin were analysed using SDS–PAGE. Blot is representative of two independent experiments. (b) 293 T cells were transfected with indicated siRNAs followed by infection with A/WSN/33 (MOI 1). At 8, 16 and 24 h p.i., cells were subjected to immunolabeling with anti-M2 in the absence of permeabilization agent (surface M2), and M2 relative fluorescence mean intensity levels were recorded by flow cytometry. Data represent mean ± s.d. of two independent experiments (n = 2). Statistical significance was calculated using two-way ANOVA with Bonferroni’s multiple comparisons post hoc test.
Extended Data Fig. 7 |
Extended Data Fig. 7 |. IAV M2 protein abrogates TBC1D5 and Rab7 interaction.
(a) 293 T cells were transfected with scrambled or TBC1D5 siRNAs. At 48 h post-transfection, cells were subjected to proximity ligand assays (PLA) staining. Quantification of number of PLA signal events where TBC1D5 proteins interact with Rab7. Data show mean ± s.d. from one representative experiment of at least two independent experiments where at least 50 cells per condition (n = 50) were quantified. Statistical significance was calculated using unpaired two-tailed Student’s t-test. (b) In parallel to PLA experiments (Fig. 6d,e) 293 T cells were subjected to transfection with indicated siRNAs for 48 h, or infected with A/PR8 WT or A/PR8 ΔM2 (MOI 3) for 18 h. Cells were then lysed and levels of TBC1D5, Rab7, NP, M2 and β-actin analysed using SDS–PAGE. Blot is representative of two independent experiments. (c) 293 T cells were mock treated, infected with A/PR8 WT or A/PR8 ΔM2 (MOI 3). At 18 h p.i. cells were lysed and levels of NP, β-actin and M2 were analysed using SDS–PAGE. Blot is representative of two independent experiments. (d) 293 T cells were mock-treated, infected with A/WSN/33, A/PR8 WT or A/PR8 ΔM2 (MOI 3), or treated with 100 μM chloroquine (CQ) or 1 μM Rapamycin for 18 h. Cells were then lysed and levels of NP, β-actin and LC3 were analysed using SDS–PAGE. Blot is representative of two independent experiments. (e) To test the specificity of the GTP-Rab7 antibody, Total- and GTP-bound Rab7 intensities were simultaneously acquired in cells that are either transfected with eGFP-Rab7 WT, a dominant negative Rab7 mutant with higher GDP affinity (eGFP-Rab7 T22N), or a constitutively active GTP-bound Rab7 mutant (eGFP-Rab7 Q67L) for 24 h. Representative images from two independent experiments show Rab7 (GFP, green) and GTP-Rab7 (red) staining. Scale bar = 10 μm. (f) Representation of generation of mask to detect nuclei and cells positive for eGFP-Rab7 signal (see material and methods). Images are representative of two independent experiments. Scale bar = 10 μm.
Fig. 1 |
Fig. 1 |. Multi-omics analysis of IAV cellular restriction.
a, Schematic representation of the genome-wide siRNA screen to identify cellular factors affecting IAV replication. b, Ranked z-scores from the genome-wide siRNA screen (blue, mock-treated cells; pink, IFN-treated cells). Dashed lines illustrate z-score cut-off: z-score >1.5 indicates antiviral factors, z-score <–1.5 indicates proviral factors. Controls are shown (scrambled, negative; siIRF9 and siNP, positive), as well as known negative (STAT2) and positive (NXF1) regulators of IAV replication. c, Integration of antiviral siRNA hits (light green, IFN-inducible; dark green, constitutive), RNA-seq (grey) and IAV M2 protein AP-MS (pink) reveals cellular networks associated with IAV restriction supported by orthogonal measurements. Nodes indicate proteins and edges indicate interactions from STRING. Hexagons represent IAV M2 viral protein. Network visualization generated by Cytoscape v.3.8.0.
Fig. 2 |
Fig. 2 |. Integrated model of IAV cellular restriction.
IAV restriction factors identified in this study were placed at specific subcellular localizations on the basis of curated literature research as well as Gene Ontology, KEGG and Reactome databases (Methods). Antiviral siRNA hits are shown in green (light green, IFN-inducible; dark green, constitutive), RNA-seq in grey and IAV M2 protein interactors in pink. Red circles denote antiviral factors previously associated with IAV restriction, and * shows subsequently validated siRNA hits.
Fig. 3 |
Fig. 3 |. TBC1D5 restricts IAV replication in vitro, ex vivo and in vivo.
a, A549 cells were transfected with indicated siRNAs for 48 h before infection with A/WSN/33 (MOI 0.01). Supernatants were analysed at 48 h postinfection (h p.i.) by plaque assay. Data represent mean ± s.d. of three independent experiments (n = 3). b, A549 cells were transfected with indicated plasmids (10 ng) for 36 h and infected with A/WSN/33 (MOI 0.01). At 48 h p.i., supernatants were analysed by plaque assay. Data show mean ± s.d. from one representative experiment in triplicate (n = 3). c,d, HTBE cells were transfected for 36 h with indicated siRNAs before A/WSN/33 infection (MOI 1). At 24 h p.i., cells were immunolabelled with NP antibody. Representative images are shown in c. Scale bar, 10 μm. Quantification (d) shows mean ± s.d. of three independent experiments (n = 3). e, Protein analysis of A549 parental and TBC1D5 KO clones. Blot is representative of three independent experiments. f, A549 parental and TBC1D5 KO cells were infected with A/WSN/33 (MOI 0.01) for 48 h and supernatants analysed by plaque assay. Data show mean ± s.d. from one representative experiment in triplicate (n = 3). g, Parental, TBC1D5 KO and TBC1D5 KO + 10 ng of TBC1D5 cells were infected with A/WSN/33 (MOI 0.1) for 24 h before immunolabelling with NP antibody. Data show mean ± s.d. normalized infection from one representative experiment in triplicate (n = 3). h, MEFs were treated with indicated PPMOs or PBS for 72 h and subjected to SDS–polyacrylamide gel electrophoresis (SDS–PAGE) and immunoblotting. Blot is a representative from two independent experiments. i, Schematic representation of mouse experiments. j, Mice survival was monitored for 14 d p.i. Shown is percentage survival ± s.d. from two independent experiments, each with five mice per condition (n = 10). k,l, On days 3 and 6 p.i., mice were euthanized to harvest the lungs and determine TBC1D5 expression (k) and virus titre (l). Blot is a representative from two independent experiments (k). Graph shows mean lung virus titre ± s.d. from two independent experiments each with five mice per condition (n = 10) (l). Statistical significance was calculated using one-way analysis of variance (ANOVA) with Dunnett’s post hoc test (a,b,d,f,g) or log rank Mantel–Cox test (j). l, Two-way ANOVA test and Dunnett post hoc test were conducted by adding experiment batch as a covariate along with PPMO treatment effect. NS, not significant.
Fig. 4 |
Fig. 4 |. TBC1D5 interacts with the cytoplasmic tail of IAV M2 protein.
a, 293T cells were transfected with GST or GST-M2 and subjected to GST-affinity pull-down. Input and pull-down samples were analysed by SDS–PAGE using indicated antibodies. Blot is a representative from two independent experiments. b, 293T cells were transfected with indicated plasmids and infected with A/WSN/33 (MOI 3) for 24 h. Immunoprecipitation (IP) was carried out using GFP-trap resin. Inputs and IP samples were analysed by SDS–PAGE using indicated antibodies. Blot is a representative from three independent experiments. 293T cells were mock-treated or infected with A/WSN/33 (MOI 3) for 1 h on ice. At 12 h p.i., cells were subjected to PLA staining. c, Representative images show PLA signal events (red) where TBC1D5 and M2 proteins interact, Phalloidin (F-actin, green) and Hoechst (DNA, blue). Scale bar, 10 μm. d, Quantification of PLA signal events per cell. Data show mean ± s.d. from one representative experiment where at least 80 cells per condition (n = 80) were quantified. Statistical significance was calculated using unpaired two-tailed Student’s t-test. e, GST-tagged M2 constructs. 293T cells were transfected with indicated constructs for 16 h before PLA staining using TBC1D5 and GST primary antibodies. f, Representative images are shown. Scale bar, 10 μm. g, Quantification of PLA signal events per cell. Data show mean ± s.d. from one representative experiment where at least 100 cells per condition (n = 100) were quantified. Statistical significance was calculated using one-way ANOVA with Dunnett’s post hoc test. h, 293T cells were infected with A/WSN/33 (MOI 0.5) for 9 h. Cells were then fixed, stained with DAPI (blue) and immunostained with anti-M2 (green) and anti-TBC1D5 (red). Arrow locates areas of colocalization between TBC1D5 and M2. Scale bar, 10 μm. Images are representative of two independent experiments where at least 100 cells per condition were measured. i, 293T cells were infected with A/WSN/33 (MOI 1) for 9 h. Cells were then stained with DAPI (blue), anti-M2 (green), anti-TBC1D5 (red) and anti-Rab7A (white). Images are representative of two independent experiments. Scale bar, 10 μm.
Fig. 5 |
Fig. 5 |. TBC1D5 promotes lysosomal targeting of IAV M2 protein.
a, 293T cells were transfected with indicated plasmids, a firefly (F) influenza minigenome reporter and transfection control renilla (R). At 24 h post-transfection, cells were infected with A/WSN/33 (MOI 5) for 16 h and the levels of F/R measured. Data represent mean ± s.d. of F/R RLU from three independent experiments (n = 3). b, 293T cells were treated with indicated siRNAs for 48 h before infection with A/WSN/33 (MOI 2). At indicated h p.i., protein levels were analysed using SDS–PAGE. Blot is representative of two independent experiments. c, 293T cells were transfected with indicated expression constructs and infected with A/WSN/33 (MOI 1). At 18 h p.i., cells were immunolabelled with anti-M2 in the presence (total M2) or absence (surface M2) of cell permeabilization agent and M2 fluorescence levels measured by flow cytometry. Data represent mean ± s.d. of three independent experiments (n = 3). d, RFP-GFP-LC3B reporter. e, Parental and TBC1D5 KO cells were transduced with BacMam 2.0 RFP-GFP-LC3B for 24 h, infected with A/WSN/33 (MOI 3) or treated with 100 μM CQ and, 16 h later, the relative number of LC3-GFP+ /LC3-RFP+ puncta per cell were quantified. Images are representative of three independent experiments. Scale bar, 10 μm. f, Data show mean ± s.e.m. LC3-GFP+ /LC3-RFP+ puncta per cell from one representative experiment where at least nine cells per condition were quantified (n = 9). g, A549 parental and TBC1D5 KO cells were infected with A/WSN/33 (MOI 3). At 7 h p.i., cells were treated with 70 nM Lysotracker, incubated for 1 h and then labelled with anti-M2. Images are representative of two independent experiments. Scale bar, 10 μm. h, PCC of M2-Lysotracker colocalization. Data show mean ± s.d. from one representative experiment where at least 50 cells per condition were quantified (n = 50). i, 293T cells were transfected with indicated expression constructs and infected with A/WSN/33 (MOI 1). At 4 h p.i., cells were treated with 100 μM CQ for 12 h p.i. and subjected to M2 immunolabelling in the absence of permeabilization agent. M2 mean fluorescence levels were recorded by flow cytometry. Data represent mean ± s.e.m. of three independent experiments (n = 3). Statistical significance was calculated using one-way ANOVA with Dunnett’s (a,c) or Tukey’s multiple comparisons post hoc (i) or two-tailed unpaired Student’s t-test (f,h).
Fig. 6 |
Fig. 6 |. M2 protein abrogates TBC1D5 and Rab7 interaction.
a, 293T cells were transfected with GFP or GFP-Rab7 and infected with A/WSN/33 (MOI 3) for 24 h. IP was carried out using GFP-trap resin. Inputs and IP samples were analysed by SDS–PAGE using indicated antibodies. b, 293T cells were transfected with GFP or GFP-Rab7 and infected with A/WSN/33 (MOI 2, 5 and 10) for 24 h. IP was carried out using GFP-trap resin, and inputs and IP samples were analysed by SDS–PAGE using indicated antibodies. c, 293T cells were transfected with GFP or GFP-TBC1D5 and infected with A/WSN/33 (MOI 3). At 24 h p.i. cell lysates were subjected to IP using GFP-trap resin and inputs and IP samples were analysed by SDS–PAGE using indicated antibodies. In ac, blots are representatives from at least two independent experiments. In d and e, 293T cells were infected with A/PR8 WT or A/PR8 ΔM2 (MOI 3) and subjected to PLA staining. d, Representative images from three independent experiments show PLA signal events (red) where TBC1D5 and Rab7 proteins interact, Phalloidin (F-actin, green) and Hoechst (DNA, blue). Scale bar, 10 μm. e, Quantification of PLA signal events. Data show mean ± s.d. from one representative experiment of at least three independent experiments where at least 100 cells per condition (n = 100) were quantified. Statistical significance was calculated using one-way ANOVA with Tukey’s multiple comparisons test. f, Representative images from two independent experiments show Rab7 (green) and GTP-Rab7 (red) staining across 293T cells that express GFP-Rab7 WT and are either mock-infected or infected with A/PR8 WT or A/PR8 ΔM2 (MOI 3) for 14 h. Scale bar, 10 μm. g, Quantification of GTP-Rab7/total Rab7 ratio. Data show mean ± s.d. from one representative experiment of at least two independent experiments where at least 100 cells per condition (n = 100) were quantified. Statistical significance was calculated using one-way ANOVA with Kruskal–Wallis multiple comparisons test. h, Proposed model. IAV M2 protein abrogates interaction of TBC1D5 with Rab7, which in turn prevents fusion of autophagosomes with lysosomes. By escaping degradation at the lysosome, M2 can now assist IAV budding at the plasma membrane and support viral growth.

References

    1. Brass AL et al. The IFITM proteins mediate cellular resistance to influenza A H1N1 virus, West Nile virus, and Dengue virus. Cell 139, 1243–1254 (2009). - PMC - PubMed
    1. Han J et al. Genome-wide CRISPR/Cas9 screen identifies host factors essential for influenza virus replication. Cell Rep. 23, 596–607 (2018). - PMC - PubMed
    1. Hao L et al. Drosophila RNAi screen identifies host genes important for influenza virus replication. Nature 454, 890–893 (2008). - PMC - PubMed
    1. Karlas A et al. Genome-wide RNAi screen identifies human host factors crucial for influenza virus replication. Nature 463, 818–822 (2010). - PubMed
    1. König R et al. Human host factors required for influenza virus replication. Nature 463, 813–817 (2010). - PMC - PubMed

Publication types