. 2021 Oct;22(10):1245-1255.
doi: 10.1038/s41590-021-01024-x. Epub 2021 Sep 23.

Reciprocal transcription factor networks govern tissue-resident ILC3 subset function and identity

Affiliations

Reciprocal transcription factor networks govern tissue-resident ILC3 subset function and identity

Rémi Fiancette et al. Nat Immunol. 2021 Oct.

Abstract

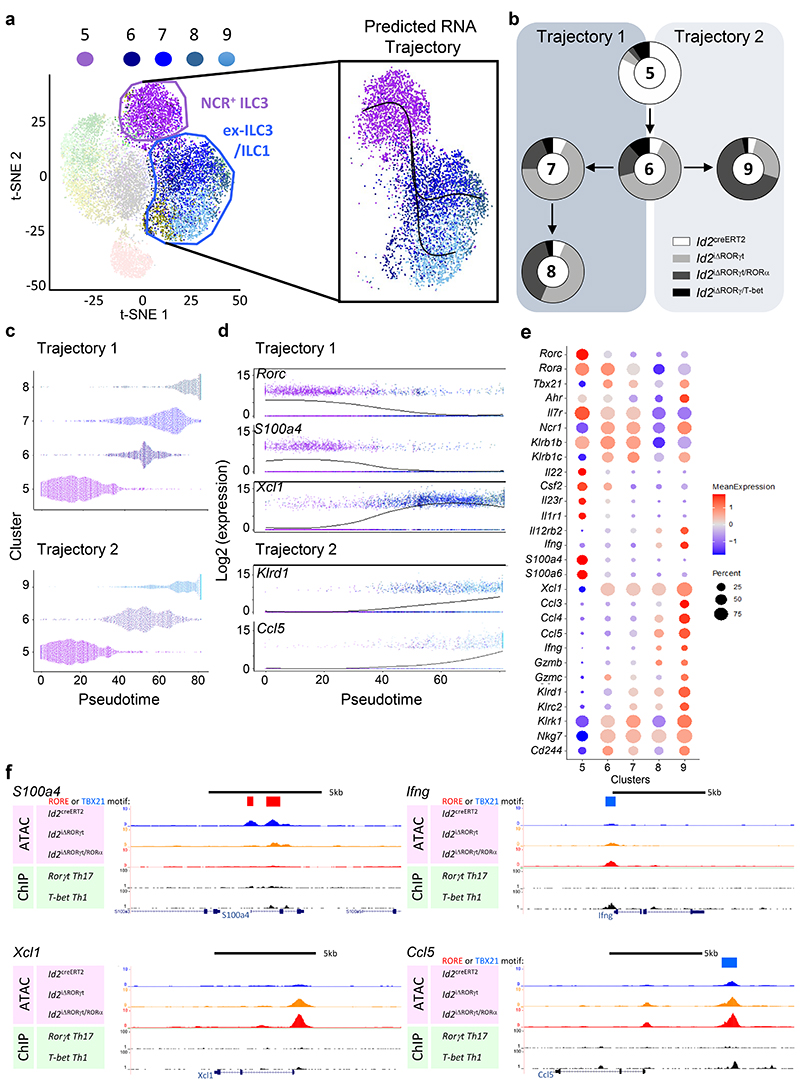
Innate lymphoid cells (ILCs) are guardians of mucosal immunity, yet the transcriptional networks that support their function remain poorly understood. We used inducible combinatorial deletion of key transcription factors (TFs) required for ILC development (RORγt, RORα and T-bet) to determine their necessity in maintaining ILC3 identity and function. Both RORγt and RORα were required to preserve optimum effector functions; however, RORα was sufficient to support robust interleukin-22 production among the lymphoid tissue inducer (LTi)-like ILC3 subset, but not natural cytotoxicity receptor (NCR)+ ILC3s. Lymphoid tissue inducer-like ILC3s persisted with only selective loss of phenotype and effector functions even after the loss of both TFs. In contrast, continued RORγt expression was essential to restrain transcriptional networks associated with type 1 immunity within NCR+ ILC3s, which coexpress T-bet. Full differentiation to an ILC1-like population required the additional loss of RORα. Together, these data demonstrate how TF networks integrate within mature ILCs after development to sustain effector functions, imprint phenotype and restrict alternative differentiation programs.


Conflict of interest statement

Competing Interests statement

The authors declare no competing interests.

Figures

Extended Data Fig. 1
Extended Data Fig. 1. ILC3 subset-specific deletion of TFs reveals that LTi-like cells express normal levels of IL-22 in the absence of both RORγt and RORα.
Il-17a cre mice were used to enable ILC3 subset specific targeting of TF-deletion. a Gating strategy for identification of tdRFP+ ILCs from SILP of Il17a cre mice. b Expression of RORγt versus NKp46 by tdRFP- and tdRFP+ ILCs from SILP of Il17a cre mice. c Proportion of ILCs in the SILP of Il17a cre mice that express tdRFP at different ages (wks) post birth. d Representative CCR6, CD4, c-Kit, NK1.1 and NKp46 expression by tdRFP+ ILCs from SILP of Il17a cre mice. e Proportion of tdRFP+ ILCs from SILP of Il17a cre mice expressing molecules assessed in ‘d’. f Representative expression of RORγt versus CD127 by tdRFP- and tdRFP+ ILCs from SILP of Il17a cre, Il17a ΔRORγt and Il17a ΔRORγt/RORα mice. g Percentage of tdRFP- and tdRFP+ ILCs expressing RORγt (Il17a cre: n=12; Il17a ΔRORγt: n=11; from 4 independent experiments). h Representative expression of RORγt versus IL-17A and IL-22 by tdRFP+ ILCs from SILP of Il17a cre, Il17a ΔRORγt and Il17a ΔRORγt/RORα mice. i Total number of tdRFP+ ILCs from SILP of Il17a cre, Il17a ΔRORγt and Il17a ΔRORγt/RORα mice expressing IL-17A (top) and IL-22 (bottom) (Il17a cre: n=19; Il17a ΔRORγt: n=14; Il17a ΔRORγt/RORα: n=19; from 6 independent experiments). Each data point on graphs is a mouse, horizontal bars denote the median. Statistical significance in ‘g’ was tested using unpaired two-tailed Student’s t tests, and in ‘i’ an ordinary one-way ANOVA with Tukey’s test for multiple comparisons. ns = not significant, **P ≤ 0.01, ****P ≤ 0.0001. Exact P values are provided in the source data.
Extended Data Fig. 2
Extended Data Fig. 2. Efficient inducible deletion of targeted transcription factors in Id2 creERT2, Id2 iΔRORγt, Id2 iΔRORγt/RORα and Id2 iΔRORγt/Tbet mice.
a Representative histograms showing expression of RORγt (upper row) and T-bet (lower row) by tdRFP+KLRG1- ILCs from SILP of Id2 creERT2, Id2 iΔRORγt, Id2 iΔRORγt/RORα and Id2 iΔRORγt/Tbet mice, dotted line denotes positive/negative staining. b Proportion of tdRFP+KLRG1- ILCs expressing RORγt and T-bet in Id2 creERT2 (n=20), Id2 iΔRORγt (n=13), Id2 iΔRORγt/RORα (n=8) and Id2 iΔRORγt/Tbet (n=17) mice (Data are representative of 7 independent experiments). c Schematics of Rorc and Rora cDNA showing exons, the location of LoxP sites and the qPCR primer annealing sites, floxed exons removed by cre-mediated deletion are in light grey. Relative expression of transcripts for the exon3-exon4, exon7-exon8 and exon8-exon9 junctions of the Rorc locus (d) and for the exon3-exon4, exon7-exon8 and exon9-exon10 junctions of the Rora locus (e) as depicted in ‘c’, determined by qPCR analysis of cDNA prepared from tdRFP+ ILCs sorted from SILP of Id2 creERT2 (n=5), Id2 iΔRORγt (n=7), Id2 iΔRORγt/RORα (n=4) and Id2 iΔRORγt/Tbet (n=2) mice (Data are representative of 3 independent experiments). f Mapping of the reads detected by scRNA-seq along the Rorc locus in tdRFP+ ILCs from SILP of Id2 creERT2, Id2 iΔRORγt, Id2 iΔRORγt/RORα and Id2 iΔRORγt/Tbet mice. The localisation of LoxP-flanked exons is depicted by a grey box. Each data point on graphs is a mouse, horizontal bars in ‘b’ denote the median, bars in ‘d’ and ‘e’ denote the mean, with error bars denoting the SEM. Statistical significance in ‘b’ was tested using an ordinary one-way ANOVA with Dunnett’s test for multiple comparisons. ****P ≤ 0.0001.
Extended Data Fig. 3
Extended Data Fig. 3. Expression of key genes associated with ILC superclusters.
a t-SNE plot showing ILC superclusters within all samples (Id2 creERT2, Id2 iΔRORγt, Id2 iΔRORγt/RORα and Id2 iΔRORγt/Tbet mice). b Gene expression (ALRA-imputed values) of core ILC genes unique and shared amongst ILC superclusters.
Extended Data Fig. 4
Extended Data Fig. 4. Binary regulon activity within ILC clusters.
a t-SNE plots generated from transcriptome (normalised and log-transformed counts) and b binary regulon activity (On/Off) generated via SCENIC analysis of cells within the 4 samples. c Heatmap of the mean binary regulon activity for all cells within each of the 11 transcriptomically-defined clusters. Regulons were filtered to exclude those which were rarely (< 4%) or constitutively (> 60%) active across all cells in the dataset. d Regulon specificity score for each of the 5 superclusters generated from regulon enrichment scores in each cell calculated using AUCell step of the SCENIC pipeline. Top 8 most specific regulons in each supercluster, relative to the entire dataset, are highlighted in red. e Gata3, Rorc and Tbx21 mRNA expression (ALRA-imputed values, top) and binary regulon activity (bottom).
Extended Data Fig. 5
Extended Data Fig. 5. RORγt and RORα combine to regulate the chromatin landscape of ILC3s.
To further investigate how transcriptomic changes after TF deletion might be influenced by alterations to the chromatin landscape, FACS-isolated tdRFP+ KLRG1- ILCs from Id2 creERT2, Id2 iΔRORγt, Id2 iΔRORγt/RORα and Id2iΔRORγt/Tbet mice were assessed by ATAC-seq. a Principal component analysis of all samples using merged MACS2 broad peaks quantitated with size factor normalized reads per million (RPM). b Heat map showing all initial comparison of 10,910 significant changes in areas of open chromatin. c Primary genomic location of peaks and relative peak abundance around transcription start sites. d Heatmap of differentially enriched peaks between all knockouts (n = 2306) based on median centered size factor normalized log2RPM values, also showing the abundance of ROR response elements (RORE) and TBX21 motifs. Groups A to E refer to the distinct patterns of changes to open chromatin across the mouse models. e UCSC genome browser display of mouse Id2, Il17a/Il17f and Il22 loci with average traces from ILCs from Id2 creERT2 (blue), Id2 iΔRORγt (yellow), Id2 iΔRORγt/RORα (red) and Id2 iΔRORγt/Tbet (green) mice, alongside RORγt (49) and T-bet (50) ChIP-seq data, with RORE and TBX21 motifs marked.
Extended Data Fig. 6
Extended Data Fig. 6. Altered metabolism profile in LTi-like ILC3s lacking RORγt and RORα.
a Relative expression (z-score) of key genes associated with LTi-like ILC3 identification and function in clusters 2-4 (LTi-like supercluster) versus clusters 5 (NCR+ ILC3) and 9 (ILC1-like cells enriched in Id2 iΔRORγt/RORα mice). b Representative expression of CCR6, c-Kit and NRP1 by NCR- ILC3s, identified as tdRFP+ KLRG1- NKp46- cells from SILP of Id2 creERT2, Id2 iΔRORγt and Id2 iΔRORγt/RORα mice, grey shaded histograms show expression by NCR+ ILC3s as a control. c Representative contour plots showing expression of MHCII by NCR- ILC3s from the SILP of Id2 creERT2, Id2 iΔRORγt and Id2 iΔRORγt/RORα mice. d Heatmap (z-score) of differentially expressed genes identified via a three way comparison of LTi-like ILC3 cells (clusters 2-4 combined) derived from Id2 creERT2, Id2 iΔRORγt and Id2 iΔRORγt/RORα mice and selected on the basis of a mean expression ≥0.1 fpkm, False Discovery Rate ≤0.001 and Fold Change in cluster average Z-score > +/− 0.4. e Relative expression (z-score) of selected metabolism associated genes in total LTi-like ILC3 cells (cluster 2-4 combined) derived from Id2 creERT2, Id2 iΔRORγt and Id2 iΔRORγt/RORα mice. f Representative protein expression of ARG1 in tdRFP+ LTi-like ILC3s from SILP of Id2 creERT2, Id2 iΔRORγt and Id2 iΔRORγt/RORα mice. g Enumeration of % ARG1+ LTi-like ILCs and of the mean fluorescence intensity (MFI) of ARG1 expression assessed in ‘f’ (Id2 cre: n=3; Id2 iΔRORγt: n=3; Id2 iΔRORγt/RORα: n=2. Data from one representative experiment out of two independent experiments). Each data point on the graph is a mouse, horizontal bars denote the median. Statistical significance was tested using an ordinary one-way ANOVA with Tukey’s test for multiple comparisons. ns = not significant, *P ≤ 0.05, **P ≤ 0.01, ***P ≤ 0.001, ****P ≤ 0.0001. Exact P values are provided in the source data.
Extended Data Fig. 7
Extended Data Fig. 7. Continued RORα expression maintains optimum Arg1 expression by ILC2s.
a Differentially expressed genes amongst ILC2 clusters in Id2 creERT2 and Id2 iΔRORγt/RORα. Log fold change ≥1.0, mean expression ≥0.1 fpkm, False Discovery Rate ≤0.02. Core ILC2 genes (no significant change) included for comparison. b Violin plots showing Arg1 expression (normalised and log-transformed counts) within the ILC2 cluster identified in Id2 creERT2, Id2 iΔRORγt, Id2 iΔRORγt/RORα and Id2 iΔRORγt/Tbet samples. c Representative protein expression of ARG1 in tdRFP+ ILC2s (KLRG1+ ILCs) from SILP of control Id2 creERT2 and Id2 iΔRORγt/RORα mice. d Percentage of ARG1+ ILC2s (tdRFP+ KLRG1+ ILCs) and MFI of ARG1 expression by ARG1+ ILC2s isolated from the SILP of control Id2 creERT2 and Id2 iΔRORγt/RORα mice (Id2 creERT2: n=5; Id2 iΔRORγt/RORα: n=3). Each data point on graphs is a mouse, horizontal bars denote the median. Statistical significance was tested using unpaired two-tailed Student’s t tests, *P ≤ 0.05. Exact P values are provided in the source data.
Extended Data Fig. 8
Extended Data Fig. 8. Validation of transcriptomic changes induced by deletion of RORγt and RORα.
Relative expression of S100a4 (a) and Xcl1 (b) transcripts determined by qPCR analysis of cDNA prepared from tdRFP+ ILCs sorted from SILP of Id2 creERT2 (n=5), Id2 iΔRORγt (n=7), Id2 iΔRORγt/RORα (n=4) and Id2 iΔRORγt/Tbet (n=2) mice (Data are representative of 3 independent experiments). c Representative expression of CD94, NKG2, CD244 and NKp46, versus NK1.1, by tdRFP+ ILCs from SILP of Id2 creERT2, Id2 iΔRORγt, Id2 iΔRORγt/RORα and Id2 iΔRORγt/Tbet mice. d UCSC genome browser display of mouse Klrc1, Klrd1, Gzma and Ccl3/4 loci with average traces from ILCs from Id2 creERT2 (blue), Id2 iΔRORγt (yellow), Id2 iΔRORγt/RORα (red) and Id2 iΔRORγt/Tbet (green) mice, alongside RORγt (49) and T-bet (50) ChIP-seq data, with RORE and TBX21 motifs marked. e Violin plots of Ikzf1 and Ikzf3 expression across clusters 1-11. f Representative expression of Aiolos by ILC2s, NCR+ ILC3s, ILC1s/ex-ILC3s, DN ILC3s and LTi-like ILC3s using flow cytometry. g Percentage of ILC2s, NCR+ ILC3s, ILC1s/ex-ILC3s, DN ILC3s and LTi-like ILC3s expressing Aiolos (n=4 for each ILC group/subset, data are representative of two independent experiments). Each data point on graphs is a mouse, horizontal bars in ‘a’ and ‘b’ denote the mean, with error bars denoting the SEM; horizontal bars in ‘g’ denote the median. Statistical significance in ‘g’ was tested using an ordinary one-way ANOVA with Tukey’s test for multiple comparisons. ns = not significant, **P ≤ 0.01, ****P ≤ 0.0001. Exact P values are provided in the source data.
Extended Data Fig. 9
Extended Data Fig. 9. Id2 İΔRORγt/Tbet mice are able to control and clear Citrobacter rodentium infection.
To functionally test whether protective intestinal mechanisms were maintained in Id2 iΔRORγt/Tbet mice, infection with Citrobacter rodentium was used. a C. rodentium counts expressed as CFU/g feces over the time course of infection in Id2 iΔRORγt (n=4) and Id2 iΔRORγt/Tbet (n=5 or 6 depending on the time point) mice versus littermate ‘no cre’ controls (n=8; to ensure comparable microbiome). b Relative expression of RegIIIb and RegIIIg in Id2 iΔRORγt and Id2 iΔRORγt/Tbet mice versus littermate ‘no cre’ controls at 21 dpi with C. rodentium (no cre control: n=8; Id2 iΔRORγt: n=4; Id2 iΔRORγt/Tbet: n=6). c Histological analysis of colon isolated from Id2 creERT2, Id2 iΔRORγt and Id2 iΔRORγt/Tbet mice at 15 dpi with C. rodentium (n=3 for each strain, one representative picture from one representative animal per strain). Each data point on graphs is a mouse, bars denote the mean with error bars denoting the SEM. Statistical significance was tested using a one-sided Kruskal-Wallis test with a Dunn’s test for multiple comparisons. *P ≤ 0.05. Exact P values are provided in the source data.
Figure 1
Figure 1. RORα and RORγt combine to preserve functions in NCR+, but not LTi-like, ILC3 subsets
To investigate the requirements for continued expression of RORγt and RORα in supporting ILC3 functions, mouse models enabling the inducible deletion of RORγt alone (Id2 iΔRORγt) or in combination with RORα (Id2 iΔRORγt/RORα) were established, with expression of tdRFP used to reveal activity of cre-recombinase. ILCs were isolated from SILP in all experiments. Cytokine expression was assessed after ex vivo stimulation with a cocktail of cytokines (IL-1β, IL-2, IL-6, IL-23) then PMA/Ionomycin/BFA. a Schematic outlining experimental design. b Gating strategy for identification of tdRFP+ ILCs from SILP. c Expression of IL-17A versus IL-22 by tdRFP+ ILCs. The percentage (d) and total number (e) of tdRFP+ ILCs expressing IL-22 (top) and IL-17A (bottom) (Id2 creERT2: n=17; Id2 iΔRORγt: n=15; Id2 iΔRORγt/RORα: n=14; from 7 independent experiments). f Expression of IL-17A and IL-22 versus RORγt by tdRFP+ ILCs. g Analysis of CCR6, c-Kit and NKp46 expression by tdRFP+ ILC3s from the SILP of Id2 creERT2 mice. h Representative expression of IL-17A and IL-22 by tdRFP+ KLRG1- ILCs split into the LTi-like, NCR+ and DN ILC3 subsets. i Total number of tdRFP+ ILCs isolated from SILP of Id2 creERT2, Id2 iΔRORγt and Id2 iΔRORγt/RORα mice (Id2 creERT2: n=17; Id2 iΔRORγt: n=16; Id2 iΔRORγt/RORα: n=15; from 8 independent experiments). Each data point on graphs is a mouse, horizontal bars denote the median. Statistical significance was tested using an ordinary one-way ANOVA with Tukey’s test for multiple comparisons, ns = not significant, *P ≤ 0.05, **P ≤ 0.01, ***P ≤ 0.001, ****P ≤ 0.0001. Exact P values are provided in the source data.
Figure 2
Figure 2. NCR+ ILC3s undergo extensive transcriptomic changes upon TF deletion
To better understand the transcriptional changes and cellular heterogeneity amongst ILC3 subsets upon TF deletion, scRNA-seq was used to compare control (Id2 creERT2) ILCs with ILCs after inducible deletion of RORγt alone (Id2 iΔRORγt) or in combination with RORα (Id2 iΔRORγt/RORα) or T-bet (Id2 iΔRORγt/Tbet). a t-SNE plot showing ILCs derived from all samples by unsupervised clustering analysis (n = 17,347 cells of tdRFP+ ILCs isolated from 3 pooled SILP preps derived from Id2 creERT2, Id2 iΔRORγt, Id2 iΔRORγt/RORα and Id2 iΔRORγt/Tbet mice). b t-SNE plots showing a total of 11 ILC clusters across the 4 samples: Id2 creERT2 (n = 4194 cells), Id2 iΔRORγt (n = 5006 cells), Id2 iΔRORγt/RORα(n = 3921 cells) and Id2 iΔRORγt/Tbet (n = 4226 cells). c t-SNE plots of log-normalised counts (ALRA-imputed values) demonstrating expression of canonical ILC and ILC subset signature genes. d t-SNE plot with inferred ILC subset identity across all sequenced cells. e Relative enrichment of individual ILC clusters (z-scores) across genotypes. f Curated heatmap of highly differentially expressed genes amongst ILC clusters across all cells sequenced (z-scores). Heatmap shows significantly enriched genes expressed on average ≥0.5 fold higher within the specific cluster. Data representative of one independent experiment, cells sequenced within each experimental group derived from a pool of n=3 mice.
Figure 3
Figure 3. Loss of both RORγt and RORα expression within NCR+ ILC3s drives full differentiation to mature ILC1-like phenotype
To further understand how loss of RORγt and RORα expression affected the NCR+ ILC3 subset specifically, we sought to order the differentiation of these cells after TF deletion. a Trajectory analysis of clusters 5-9 using Slingshot. b Composition of clusters 5-9 based upon the proportion of cells contributed by the different samples: Id2 creERT2, Id2 iΔRORγt, Id2 iΔRORγt/RORα and Id2iΔRORγt/Tbet. c Emergence of clusters in Trajectories 1 and 2 over pseudotime. d Changes in expression of Rorc, S100a4, Xcl1 (Trajectory 1) and Klrd1, Ccl5 (Trajectory 2) over pseudotime. e Mean expression values of key genes associated with ILC3 and ILC1 cells. f UCSC genome browser display of mouse S100a4, Ifng, Xcl1 and Ccl5 loci with average traces of Id2 creERT2 (blue), Id2 iΔRORγt (yellow) and Id2 iΔRORγt/RORα(red) mice, alongside RORγt (49) and T-bet (50) ChIP-seq data, with RORE and TBX21 motifs marked.
Figure 4
Figure 4. Ex-ILC3s and ILC1s exhibit comparable spectrum of phenotypes within the SILP
The transcriptomic changes induced upon deletion of RORγt and RORα in NCR+ ILC3s were assessed at the protein level using flow cytometry. a Representative expression of NKp46, NK1.1 and IFNγ by tdRFP+ KLRG1- ILCs from SILP of Id2 creERT2 and Id2 iΔRORγt/RORα mice after ex vivo stimulation with IL-12, IL-18 and PMA/Ionomycin/BFA. b Representative expression of CCL5 and XCL1 by tdRFP+ ILC subsets identified in ‘a’, gating on NKp46+ NK1.1hi IFNγ+ populations except where compared to DN/LTi-like ILC3s. c t-SNE plots showing tdRFP+ ILCs derived from SILP of Id2 creERT2 (turquoise), Id2 iΔRORγt (pink) and Id2 iΔRORγt/RORα(green) mice after ex vivo stimulation as shown in ‘a’ and ‘b’, by unsupervised clustering analysis (performed with the native platforms in FlowJo). d Relative expression of KLRG1, NKp46, NK1.1, NKG2A/C/E, CD94, IFNγ, CCL5, XCL1 and T-bet by tdRFP+ ILCs within clusters identified in ‘c’. To determine whether ex-ILC3s and ILC1s in the SILP exhibit comparable phenotypes, RORγt expression was fate-mapped using Rorc cre x Rosa26 tdRFP mice, enabling a definitive comparison of ex-ILC3s and bona fide ILC1s within the SILP. e Representative expression of NKp46, NK1.1 and IFNγ by tdRFP+ RORγt+ ILC3s (blue), tdRFP+ RORγt- ex-ILC3s (red) and tdRFP- RORγt- ILC1s (yellow) from SILP after ex vivo stimulation with IL-12, IL-18 and PMA/Ionomycin/BFA. f Representative expression of CD94 and NKG2A/C/E by NKp46+ NK1.1lo IFNγ+ ILC3, and NKp46+ NK1.1hi IFNγ+ ex-ILC3 and ILC1 populations. g Representative expression of CCL5 and XCL1 by populations identified in ‘f’. h Percentage of ILCs identified in ‘f’ expressing CCL5 or XCL1 (n=7 per cell type, data are representative of 3 independent experiments). Each data point on graphs is a mouse, horizontal bars denote the median.
Figure 5
Figure 5. RORα expression is sufficient to preserve IL-23 mediated expression of IL-22 by non LTi-like ILC3s in the absence of RORγt and T-bet
To investigate whether ILC3 effector functions were preserved in non-LTi-like ILC3 subsets in the absence of T-bet mediated differentiation towards an ILC1 state, ILC3 populations from SILP of Id2 creERT2 control, Id2 iΔRORγt and Id2 iΔRORγt/Tbet mice were assessed. a Representative flow cytometry plots showing NKp46 vs c-Kit expression by tdRFP+ KLRG1- ILCs, with further gating on ILC3 subsets and analysis of T-bet expression. b Representative histograms showing expression of NK1.1, NKG2A/C/E and CD49a by NCR+ ILC3s (blue) from Id2 creERT2 and Id2 iΔRORγt mice versus DN ILC3s (purple) from Id2 iΔRORγt/Tbet mice, compared with LTi-like ILC3s (grey). c Enumeration of expression of NK1.1 (MFI), NKG2A/C/E (%) and CD49a (MFI) (Id2 creERT2: n=4; Id2 iΔRORγt: n=3; Id2 iΔRORγt/T-bet: n=3; from one representative experiment). d Relative expression of key cytokine receptors across clusters 5 (Id2 creERT2), 6-8 (Id2 iΔRORγt) and 11 (Id2 iΔRORγt/Tbet). e UCSC genome browser display of mouse Il23r//l12rb2 loci with average traces of Id2 creERT2 (blue), Id2 iΔRORγt (yellow), Id2 iΔRORγt/RORα (red) and Id2 iΔRORγt/Tbet (green) mice, alongside RORγt (49) and T-bet (50) ChIP-seq data, with RORE and TBX21 motifs marked. f Representative expression of IL-22, IFNγ and XCL1 by c-Kit- (red) and c-Kit+ (grey) tdRFP+ KLRG1- RORγt+ ILCs from Id2 creERT2 mice and RORγt- ILCs from Id2 iΔRORγt and Id2 iΔRORγt/Tbet mice, after ex vivo stimulation with either IL-23 or IL-12 and IL-18. g Proportion of IL-22, IFNγ and XCL1 expressing ILCs from ‘f’ (Top graph Id2 creERT2: n=14; Id2 iΔRORγt: n=13; Id2 iΔRORγt/T-bet: n=12. Middle and bottom graphs n=4 for each genotype. Data representative of 2 independent experiments). h Representative expression of IFNγ versus IL-22 by tdRFP+ KLRG1- c-Kit-RORγt+, RORγt- and RORγt- T-bet- ILCs from Id2 creERT2, Id2 iΔRORγt/Tbet and Id2 iΔRORγt/Tbet/RORα mice, respectively, after stimulation with IL-23. i Proportion of tdRFP+ KLRG1- c-Kit- ILCs expressing IL-22 and MFI of IL-22 expression from ‘h’ (n=4 for each genotype, data representative of one experiment). Each data point on graphs is a mouse, horizontal bars denote the median. Statistical significance was tested using an ordinary one-way ANOVA with Tukey’s test for multiple comparisons. ns = not significant, * P ≤ 0.05, **P ≤ 0.01, ***P ≤ 0.001, ****P ≤ 0.0001. Exact P values are provided in the source data.

Comment in

References

    1. Artis D, Spits H. The biology of innate lymphoid cells. Nature. 2015;517:293–301. doi: 10.1038/nature14189. - DOI - PubMed
    1. Withers DR, Hepworth MR. Group 3 Innate Lymphoid Cells: Communications Hubs of the Intestinal Immune System. Front Immunol. 2017;8:1298. doi: 10.3389/fimmu.2017.01298. - DOI - PMC - PubMed
    1. Walker JA, Barlow JL, McKenzie AN. Innate lymphoid cells--how did we miss them? Nat Rev Immunol. 2013;13:75–87. doi: 10.1038/nri3349. - DOI - PubMed
    1. Spits H, et al. Innate lymphoid cells--a proposal for uniform nomenclature. Nat Rev Immunol. 2013;13:145–149. doi: 10.1038/nri3365. - DOI - PubMed
    1. Shih HY, et al. Developmental Acquisition of Regulomes Underlies Innate Lymphoid Cell Functionality. Cell. 2016;165:1120–1133. doi: 10.1016/j.cell.2016.04.029. - DOI - PMC - PubMed

Publication types

MeSH terms

Substances