. 2021 Sep 7:15:726476.
doi: 10.3389/fnins.2021.726476. eCollection 2021.

Characterizing the Retinal Phenotype of the Thy1-h[A30P]α-syn Mouse Model of Parkinson's Disease

Affiliations

Characterizing the Retinal Phenotype of the Thy1-h[A30P]α-syn Mouse Model of Parkinson's Disease

Lien Veys et al. Front Neurosci. .

Abstract

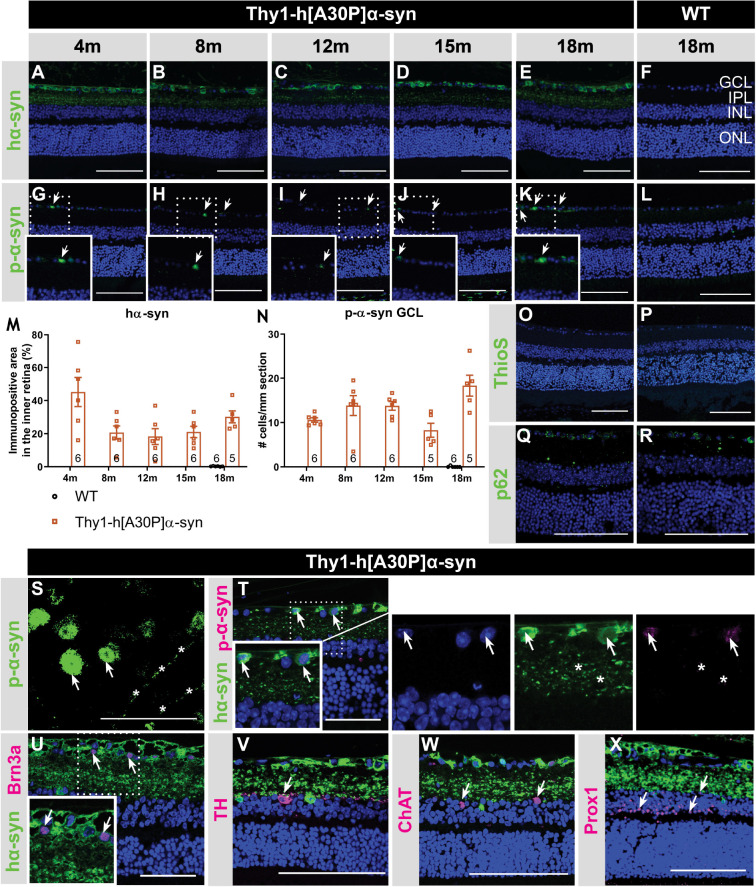
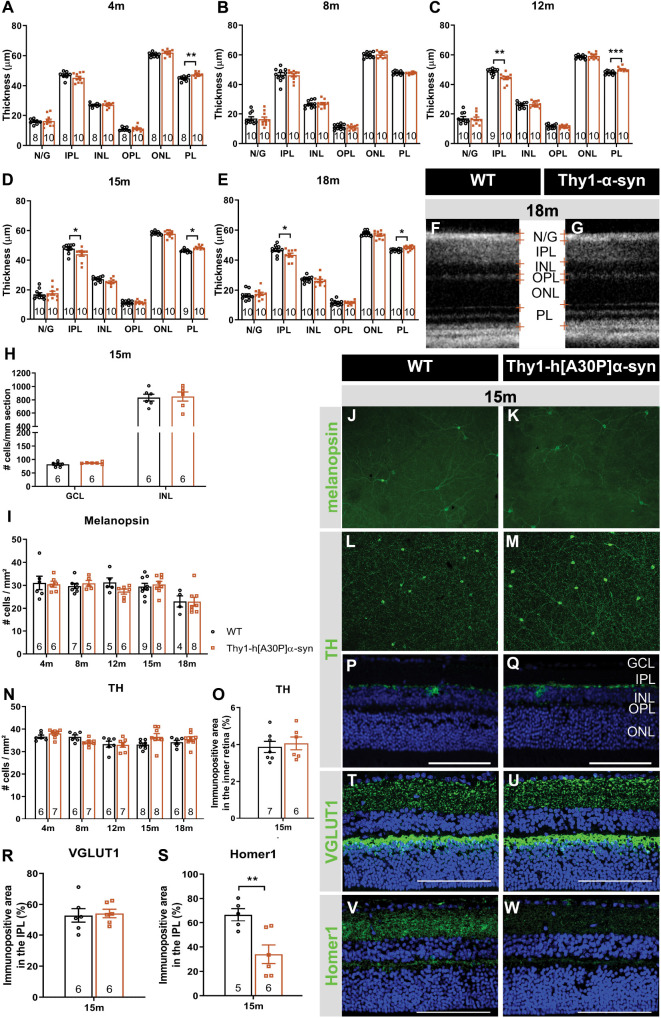
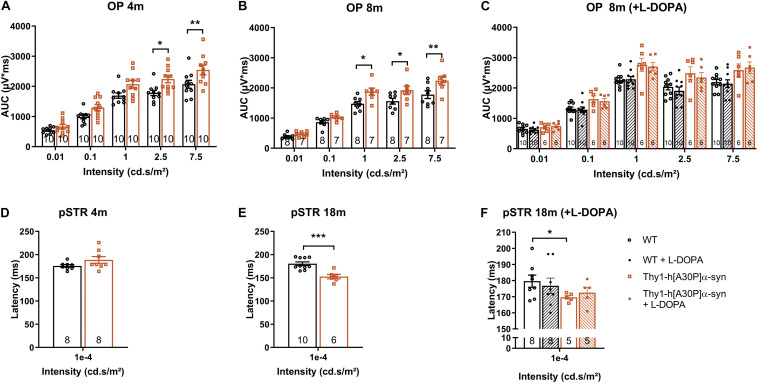
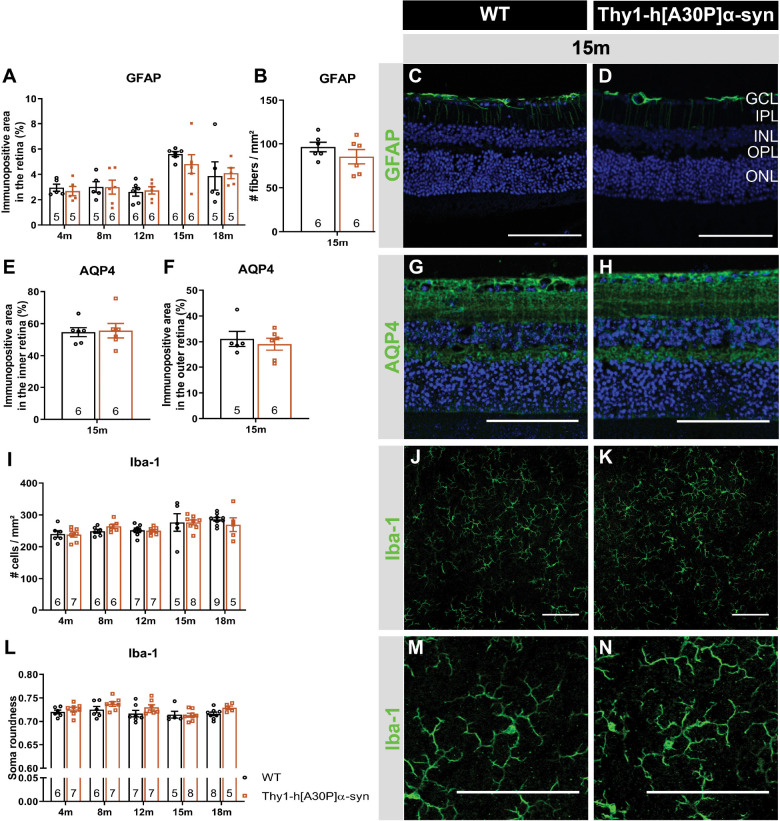
Despite decades of research, disease-modifying treatments of Parkinson's disease (PD), the second most common neurodegenerative disease worldwide, remain out of reach. One of the reasons for this treatment gap is the incomplete understanding of how misfolded alpha-synuclein (α-syn) contributes to PD pathology. The retina, as an integral part of the central nervous system, recapitulates the PD disease processes that are typically seen in the brain, and retinal manifestations have emerged as prodromal symptoms of the disease. The timeline of PD manifestations in the visual system, however, is not fully elucidated and the underlying mechanisms are obscure. This highlights the need for new studies investigating retinal pathology, in order to propel its use as PD biomarker, and to develop validated research models to investigate PD pathogenesis. The present study pioneers in characterizing the retina of the Thy1-h[A30P]α-syn PD transgenic mouse model. We demonstrate widespread α-syn accumulation in the inner retina of these mice, of which a proportion is phosphorylated yet not aggregated. This α-syn expression coincides with inner retinal atrophy due to postsynaptic degeneration. We also reveal abnormal retinal electrophysiological responses. Absence of selective loss of melanopsin retinal ganglion cells or dopaminergic amacrine cells and inflammation indicates that the retinal manifestations in these transgenic mice diverge from their brain phenotype, and questions the specific cellular or molecular alterations that underlie retinal pathology in this PD mouse model. Nevertheless, the observed α-syn accumulation, synapse loss and functional deficits suggest that the Thy1-h[A30P]α-syn retina mimics some of the features of prodromal PD, and thus may provide a window to monitor and study the preclinical/prodromal stages of PD, PD-associated retinal disease processes, as well as aid in retinal biomarker discovery and validation.

Keywords: Parkinson’s disease; alpha-synuclein; retina; transgenic mouse model; visual system.


Conflict of interest statement

The authors declare that the research was conducted in the absence of any commercial or financial relationships that could be construed as a potential conflict of interest.

Figures

FIGURE 1
FIGURE 1
Inner retinal hα-syn expression is accompanied by α-syn phosphorylation, yet no ThioS positive aggregation or p62 accumulation, in the retina of Thy1-h[A30P]α-syn mice. Representative images of hα-syn immunostainings (A–E); p-α-syn immunostainings (G–K); and ThioS staining (O) on retinal sections of α-syn mice at 4, 8, 12, 15 and 18 months of age. (F,L,P) No staining was observed in the WT controls, at any age (only 18 months shown here). (M,N) Quantitative analysis of the hα-syn fluorescent area and counting of the p-α-syn positive cells did not reveal an increase of hα-syn expression in the inner retina or p-α-syn cell density in α-syn mice with age. (O,P) No ThioS positive inclusions were found in the retina of transgenic nor wild type animals in any of the age groups. (Q,R) No difference in retinal p62 accumulation or localization was detected between transgenic and wild type animals at 18 months of age. (S) p-α-syn immunostaining on a retinal wholemount of an α-syn mouse showed p-α-syn localization in cell bodies (arrows) and neurites (asterisks). (T) Double staining of hα-syn with p-α-syn revealed clear colocalization. (U–X) Double staining of hα-syn with Brn3a, TH, ChAT and Prox1 revealed expression of Brn3a in hα-syn positive cells, yet no colocalization in dopaminergic and cholinergic cells. Scale bar: 100 μm (A–R, V–X) or 50 μm (S–U); GCL, ganglion cell layer; INL, inner nuclear layer; IPL, inner plexiform layer; and ONL, outer nuclear layer.
FIGURE 2
FIGURE 2
Outer retinal thickening and inner retinal thinning, associated with loss of postsynaptic labeling, in Thy1-h[A30P]α-syn mice. (A–E) Longitudinal OCT measurements in 4- (A), 8- (B), 12- (C), 15- (D), and 18-month-old (E–G) mice, revealed significant differences in retinal layer thickness between α-syn and WT mice of 4 months (PL thickening), 15 months (PL thickening and IPL thinning), and 12 and 18 months of age (PL thickening and IPL thinning). (H) Cell counts on hematoxylin and eosin-stained sections in the GCL and in the INL did not reveal significant differences between transgenic animals and WT controls at 15 months of age. (I–W) Representative images of retinal wholemounts stained for melanopsin (J,K) and TH (L,M), and of retinal sections stained for TH (P,Q), VGLUT1 (T,U), and Homer-1 (V,W), of 15-month-old α-syn and WT mice. Counting the number of melanopsin- (I) and TH- (N) positive cells on retinal wholemounts revealed no significant differences between transgenic and WT animals. No significant differences were uncovered in TH plexus (O) and VGLUT1 (R) immunopositive area, yet a strong decrease of the Homer1 (S) signal was seen. Scale bar: 100 μm; Two-Way ANOVA with Tukey multiple comparisons post hoc test (I–N). Unpaired t-test (per retinal layer; A–F,O,R,S): *p < 0.05; **p < 0.01; and ***p < 0.001. N/G, retinal nerve fiber layer + GCL; GCL, ganglion cell layer; INL, inner nuclear layer; IPL, inner plexiform layer; ONL, outer nuclear layer; OPL, outer plexiform layer; and PL, photoreceptor layer.
FIGURE 3
FIGURE 3
Electrophysiological changes in the retina of older Thy1-h[A30P]α-syn mice cannot be alleviated by L-DOPA treatment. ERG was used to measure the electrophysiological responses of different retinal cell types. (A,B) Quantification of the OPs, measured as the area under the curve (AUC), revealed larger OPs in 4- and 8-month-old α-syn mice as compared to WT controls for light stimuli with high intensity. (D,E) Quantification of pSTR response did not reveal any differences at 4 months of age, yet a shorter pSTR latency time was observed in 18-month-old transgenic mice as compared to WTs. (C,F) L-DOPA treatment did not have an overt rescue effect on observed OP (C) and pSTR (F) differences in α-syn mice. Repeated measures Two-Way ANOVA (A–C) with Bonferroni’s multiple comparisons post hoc test or unpaired t-test (D–F): *p < 0.05; **p < 0.01; and ***p < 0.001. Full ERG data is shown in Supplementary Figure 1.
FIGURE 4
FIGURE 4
Macroglia and microglia reactivity and water homeostasis appear normal in Thy1-h[A30P]α-syn mice. Representative images of retinal cross-sections stained for GFAP (C,D) and wholemounts stained for Iba-1 (J,K,M,N) and cross-sections stained for AQP4 (G,H) in 15-month-old α-syn and WT mice. (A,B) When measuring the GFAP immunopositive area and the number of radial fibers in the inner retina, no differences in macroglia reactivity were uncovered between transgenic and WT animals in any of the age groups. (I,L) No differences in Iba-1+ cell density and cell soma roundness, indicative of microgliosis, were observed. (E,F) AQP4 immunopositive area or localization in the inner versus outer retina of α-syn mice versus age-matched WT animals was similar. Two-Way ANOVA with Sidak’s multiple comparisons post hoc test (A,I,L) or unpaired t-test (B,E,F). Scale bar: 100 μm.

References

    1. Adam C. R., Shrier E., Ding Y., Glazman S., Bodis-Wollner I. (2013). Correlation of inner retinal thickness evaluated by spectral-domain optical coherence tomography and contrast sensitivity in Parkinson disease. J. Neuro Ophthalmol. 33 137–142. 10.1097/WNO.0b013e31828c4e1a - DOI - PubMed
    1. Amann B., Kleinwort K. J. H., Hirmer S., Sekundo W., Kremmer E., Hauck S. M., et al. (2016). Expression and distribution pattern of aquaporin 4, 5 and 11 in retinas of 15 different species. Int. J. Mol. Sci. 17:1145. 10.3390/ijms17071145 - DOI - PMC - PubMed
    1. Araya J., Bello F., Shivashankar G., Neira D., Durán-Aniotz C., Acosta M. L., et al. (2021). Retinal ganglion cells functional changes in a mouse model of Alzheimer’s disease are linked with neurotransmitter alterations. J. Alzheimers Dis. 82 S5–S18. 10.3233/jad-201195 - DOI - PubMed
    1. Archibald N. K., Clarke M. P., Mosimann U. P., Burn D. J. (2009). The retina in Parkinson’s disease. Brain 132 1128–1145. 10.1093/brain/awp068 - DOI - PubMed
    1. Archibald N. K., Clarke M. P., Mosimann U. P., Burn D. J. (2011). Visual symptoms in Parkinson’s disease and Parkinson’s disease dementia. Mov. Disord. 26 2387–2395. 10.1002/mds.23891 - DOI - PubMed

LinkOut - more resources