. 2021 Jul 1;2(3):100141.
doi: 10.1016/j.xinn.2021.100141. eCollection 2021 Aug 28.

clusterProfiler 4.0: A universal enrichment tool for interpreting omics data

Affiliations

clusterProfiler 4.0: A universal enrichment tool for interpreting omics data

Tianzhi Wu et al. Innovation (Camb). .

Abstract

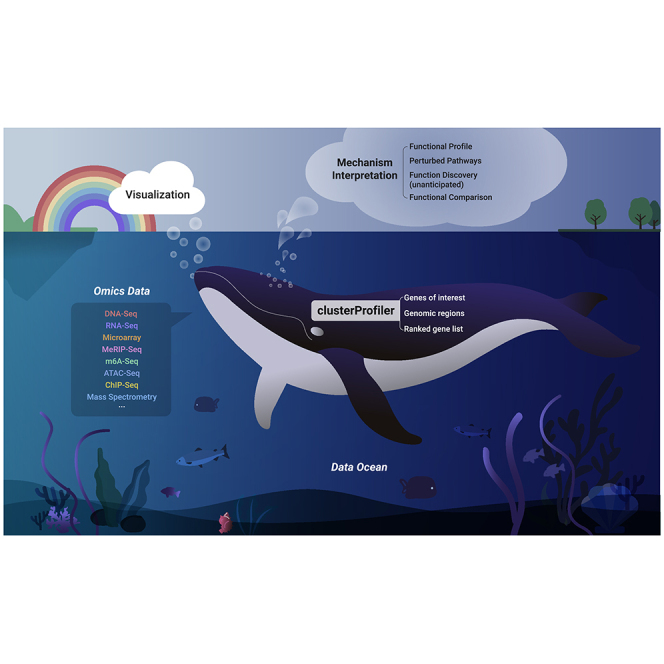
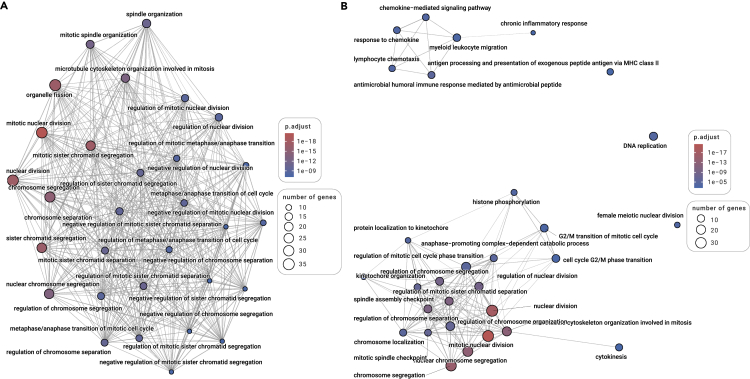
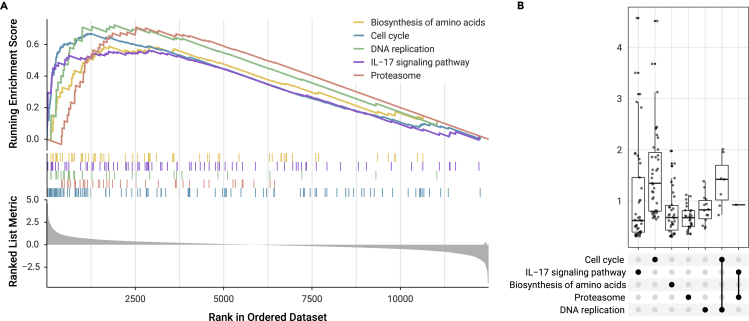
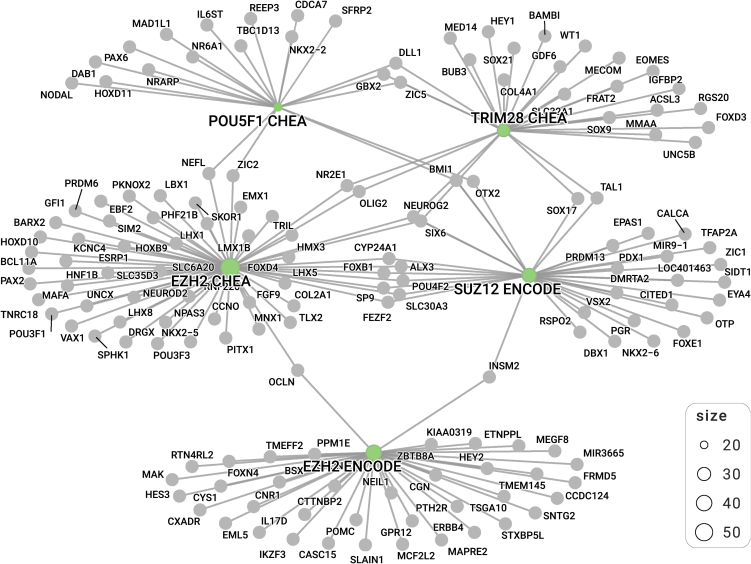
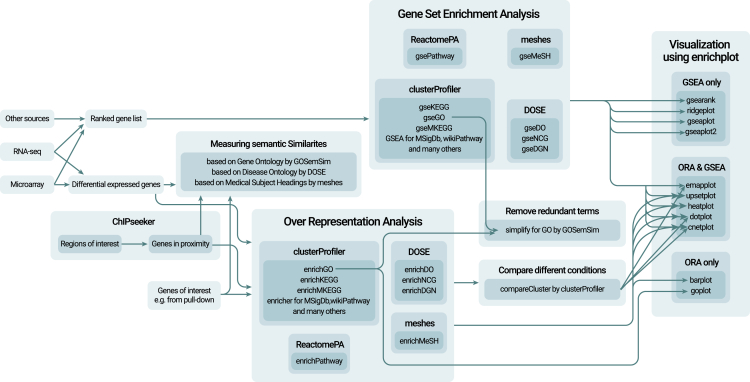
Functional enrichment analysis is pivotal for interpreting high-throughput omics data in life science. It is crucial for this type of tool to use the latest annotation databases for as many organisms as possible. To meet these requirements, we present here an updated version of our popular Bioconductor package, clusterProfiler 4.0. This package has been enhanced considerably compared with its original version published 9 years ago. The new version provides a universal interface for functional enrichment analysis in thousands of organisms based on internally supported ontologies and pathways as well as annotation data provided by users or derived from online databases. It also extends the dplyr and ggplot2 packages to offer tidy interfaces for data operation and visualization. Other new features include gene set enrichment analysis and comparison of enrichment results from multiple gene lists. We anticipate that clusterProfiler 4.0 will be applied to a wide range of scenarios across diverse organisms.

Keywords: biological knowledge mining; clusterProfiler; enrichment analysis; functional analysis; visualization.


Conflict of interest statement

The authors declare no competing interests.

Figures

None
Graphical abstract
Figure 1
Figure 1
Gene ontology enrichment analysis The original result (A) and a simplified version (B) were visualized as enrichment map networks. Each node represents a gene set (i.e., a GO term) and each edge represents the overlap between two gene sets.
Figure 2
Figure 2
KEGG pathway enrichment analysis In GSEA enrichment plot (A), the curves represent the running sum of the enrichment scores, the middle part of the graph shows the position of genes that are related to certain pathways, and the bottom part of the graph displays how the metric (e.g., fold change) is distributed along with the list. The UpSet plot (B) visualizes the metric distribution of core enrichment genes. It differentiates genes that uniquely belong to a pathway or are associated with two or more pathways.
Figure 3
Figure 3
Functional enrichment analysis of genomic regions of interest Genomic regions are linked to coding genes, which are then used to identify transcript cofactors by testing significant overlap of target genes.
Figure 4
Figure 4
Comparing functional profiles among different levels of conditions The compareCluster function performed enrichment analysis simultaneously for eight lists of DEGs. The results were visualized as a dot plot with an x axis representing one level of conditions (time course) and a facet panel indicating another level of conditions (drug treatments).
Figure 5
Figure 5
Visualizing enrichment results using ggplot2 A lollipop chart to visualize the rich factors from ORA (A) and a bar chart to visualize normalized enrichment scores from GSEA (B).
Figure 6
Figure 6
A package suite for mining biological knowledge clusterProfiler is an essential core for functional analysis, the functionalities of which are enhanced by several companion packages.

References

    1. Dozmorov M.G. Epigenomic annotation-based interpretation of genomic data: from enrichment analysis to machine learning. Bioinformatics. 2017;33:3323–3330. - PubMed
    1. Priebe S., Kreisel C., Horn F., et al. FungiFun2: a comprehensive online resource for systematic analysis of gene lists from fungal species. Bioinformatics. 2015;31:445–446. - PMC - PubMed
    1. Yi X., Du Z., Su Z. PlantGSEA: a gene set enrichment analysis toolkit for plant community. Nucleic Acids Res. 2013;41:W98–W103. - PMC - PubMed
    1. Nam D., Kim S.-Y. Gene-set approach for expression pattern analysis. Brief. Bioinform. 2008;9:189–197. - PubMed
    1. Wadi L., Meyer M., Weiser J., et al. Impact of outdated gene annotations on pathway enrichment analysis. Nat. Methods. 2016;13:705–706. - PMC - PubMed

LinkOut - more resources