. 2021 Oct 15;148(20):dev199591.
doi: 10.1242/dev.199591. Epub 2021 Oct 19.

Trp53 ablation fails to prevent microcephaly in mouse pallium with impaired minor intron splicing

Affiliations

Trp53 ablation fails to prevent microcephaly in mouse pallium with impaired minor intron splicing

Alisa K White et al. Development. .

Abstract

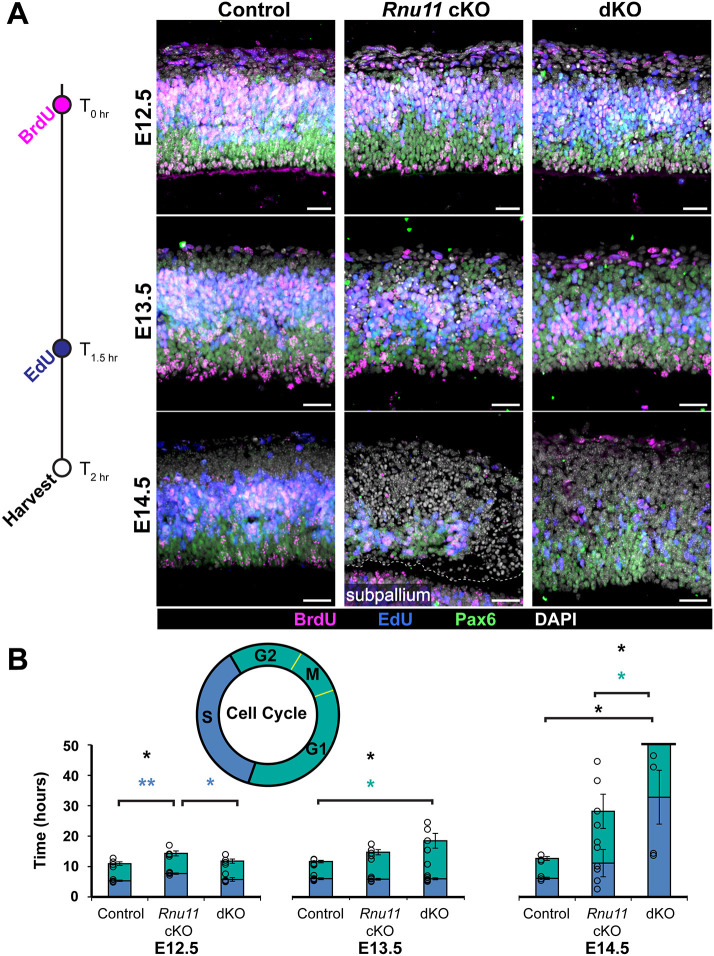
Minor spliceosome inhibition due to mutations in RNU4ATAC are linked to primary microcephaly. Ablation of Rnu11, which encodes a minor spliceosome snRNA, inhibits the minor spliceosome in the developing mouse pallium, causing microcephaly. There, cell cycle defects and p53-mediated apoptosis in response to DNA damage resulted in loss of radial glial cells (RGCs), underpinning microcephaly. Here, we ablated Trp53 to block cell death in Rnu11 cKO mice. We report that Trp53 ablation failed to prevent microcephaly in these double knockout (dKO) mice. We show that the transcriptome of the dKO pallium was more similar to the control compared with the Rnu11 cKO. We find aberrant minor intron splicing in minor intron-containing genes involved in cell cycle regulation, resulting in more severely impaired mitotic progression and cell cycle lengthening of RGCs in the dKO that was detected earlier than in the Rnu11 cKO. Furthermore, we discover a potential role of p53 in causing DNA damage in the developing pallium, as detection of γH2aX+ was delayed in the dKO. Thus, we postulate that microcephaly in minor spliceosome-related diseases is primarily caused by cell cycle defects.

Keywords: Cell cycle; Cortical development; Microcephaly; Minor spliceosome; U11 snRNA.


Conflict of interest statement

Competing interests The authors declare no competing or financial interests.

Figures

Fig. 1.
Fig. 1.
Removal of Trp53 in the Rnu11 cKO mouse does not fully rescue microcephaly. (A) Schematic of the impacts of U11 loss in the Rnu11 cKO mouse pallium, in which the mis-splicing of MIGs leads to cell cycle defects, DNA damage and p53-mediated cell death, ultimately resulting in microcephaly. Model informed by Baumgartner et al. (2018). (B) Agarose gels for genotype verification of control, Rnu11 cKO and dKO mice (left to right within each gel) for Rnu11 (left), Trp53 (middle) and Emx1-Cre (right). Ladder 100 bp MW (Promega). (C) Images of P0 brains of control (left), Rnu11 cKO (middle) and dKO (right), with left cortices traced in black dotted lines. (D) Bar graph of P0 cortical weights of control (left, white; n=5), Rnu11 cKO (middle, dark gray; n=4) and dKO (right, light gray; n=3). (E) Top: quantification metrics of hemi-cortical area, anterior-posterior (A-P) length and length. Bottom: bar graphs of hemi-cortical area, A-P length and length for control (white; n=5), Rnu11 cKO (dark gray; n=10) and dKO (light gray; n=5). (F) Representative brightfield images of Nissl-stained 50 µm thick cryosections of control (left), Rnu11 cKO (middle) and dKO (right) brains from rostral (top) to caudal (bottom). Data are mean±s.e.m. ****P<0.0001, ***P<0.001, **P<0.01 (one-way ANOVA followed by post-hoc Tukey test). n.s., not significant. Scale bars: 1 mm (C,E); 200 µm (F).
Fig. 2.
Fig. 2.
Removal of p53 rescues the pro-apoptotic molecular phenotype observed in the Rnu11 cKO pallium. (A) IHC for p53 (green) in E14.5 sagittal sections of the control (left), Rnu11 cKO (middle) and dKO (right) pallium. Nuclei are marked by DAPI (blue). Scale bars: 20 µm. (B) PCA of all expressed (TPM≥1) protein-coding genes in control (green, n=4), Rnu11 cKO (blue, n=4) and dKO (purple, n=4). Shapes represent different biological replicates and colored prediction ellipses are drawn such that the probability is 95% that a new observation from the same genotype falls inside the ellipse. (C) UpSet plot representing the intersection of genes that are differentially expressed in the Rnu11 cKO and dKO compared with the control. The bottom matrix represents the different categories of genes expression, including genes upregulated, downregulated and NonDR in the Rnu11 cKO and the dKO compared with the control. The black circle represents the category represented in the bar graph above. Two connected black circles represents genes common to those two categories with the bar graph representing the number of genes. Green bars represent all protein-coding genes and gray bars indicate the number of MIGs within that category. Asterisks correspond to boxes on the right listing the specific MIGs within that intersection. (D) Table of top 5 GO terms with significant enrichment by genes upregulated in the E13.5 Rnu11 cKO compared with the control, identified by DAVID analysis. The term ‘intrinsic apoptotic signaling pathway in response to DNA damage by p53 class mediator’ is highlighted in green. (E) Bar chart of Log2FC values of the seven genes enriching for the green highlighted GO term in the Rnu11 cKO versus control comparison (black), and their Log2FC in the dKO versus control comparison (red). The gray horizontal bar indicates the range of non-differential expression (NonDR) calls.
Fig. 3.
Fig. 3.
Primary defect of mis-splicing of minor intron-containing genes involved in cell cycle is comparable in the Rnu11 cKO and dKO. (A) Boxplot showing the 10th to 90th percentiles of the median MSI for all (n=402) minor introns that show retention in any of the three conditions. ***P<0.001 (Kruskal–Wallis H test). n.s., not significant. (B) PCA of minor intron retention (minor intron MSI) in control (blue, n=4), Rnu11 cKO (green, n=4) and dKO (purple, n=4). Shapes represent different biological replicates and colored prediction ellipses are drawn such that the probability is 95% that a new observation from the same genotype falls inside the ellipse. (C) Left: charts of predicted consequences of minor intron retention on the ORF of MIGs with elevated minor intron retention in the Rnu11 cKO (top left, grayscale) and the dKO (bottom left, grayscale) relative to control. Right: charts representing whether premature stop codons due to minor intron retention are predicted to trigger NMD or novel protein production in the Rnu11 cKO (top right, blue) and dKO (bottom right, blue). (D) Bar graph of AS events around minor introns in the control, Rnu11 cKO and dKO. Schematics of the different types of AS events color-coded in the bar graph are displayed in the key on the right. (E) Agarose gel images of selected AS events around the minor intron of cell cycle-related MIGs as detected by RT-PCR. n=4 per genotype. (F) Left: table of Biological Process GO terms enriched by MIGs with shared upregulation of minor intron retention and/or AS in both the Rnu11 cKO and dKO compared with the control. Right: cell cycle schematic showing MIGs enriching for the top biological process (‘cell cycle’; green text), located within the specific cell cycle stage(s)/transition(s) they associate. MIGs listed in black text also regulate cell cycle, do not enrich for the specific GO term and are similarly distributed in the cell cycle schematic.
Fig. 4.
Fig. 4.
Mitotic progression of RGCs is significantly impacted in both Rnu11 cKO and dKO by E12.5. (A) IHC for Aurora B (green) and Pax6 (magenta) on sagittal sections of control (left), Rnu11 cKO (middle) and dKO (right) pallium across E12.5 (top), E13.5 (middle) and E14.5 (bottom). Nuclei are marked by DAPI (blue). Scale bars: 30 µm. (B) Quantification of the percentage of Aurora B+ mitotic RGCs (Pax6+) across prometaphase (left) and telophase (right) in control, Rnu11 cKO and dKO across E12.5, E13.5 and E14.5. E12.5 control n=5, Rnu11 cKO n=5, dKO n=5. E13.5 control n=5, Rnu11 cKO n=5, dKO n=5. E14.5 control n=3, Rnu11 cKO n=3, dKO n=3. Data are mean±s.e.m. *P<0.05, **P<0.01, ***P<0.001 (one-way ANOVA, followed by post-hoc Tukey test).
Fig. 5.
Fig. 5.
Total cell cycle length of RGCs is significantly extended in the dKO by E13.5 and E14.5. (A) BrdU/EdU injection paradigm adapted from Martynoga et al. (2005) to quantify total cell cycle speed and S-phase length of RGCs. A single BrdU injection (magenta) was performed at T=0 h, followed by a single EdU injection (blue) at T=1.5 h, with collection at T=2 h (white). Subsequent IHC detection for BrdU and Pax6 (green) was performed in conjunction with EdU detection in sagittal pallial sections of the control (left), Rnu11 cKO (middle) and dKO (right) at E12.5 (top), E13.5 (middle) and E14.5 (bottom). Nuclei are stained by DAPI (white). Scale bars: 30 µm. (B) Quantification of S-phase (blue), G2-G1 (turquoise) and total cell cycle (full bar, outlined in black) length in the control, Rnu11 cKO and dKO pallium across E12.5, E13.5 and E14.5, calculated using the method in Martynoga et al. (2005). E12.5 control n=4, Rnu11 cKO n=4, dKO n=4. E13.5 control n=5, Rnu11 cKO n=5, dKO n=5. E14.5 control n=3, Rnu11 cKO n=5, dKO n=4. Data are mean± s.e.m. *P<0.05, **P<0.01 (one-way ANOVA, followed by post-hoc Tukey test). n.s., not significant. Asterisk color indicates the specific comparison tested for statistical significance, corresponding to the bar color-coding scheme.
Fig. 6.
Fig. 6.
Removal of p53 in the Rnu11 cKO inhibits cell death and delays DNA damage. (A) IHC for γH2AX (green), CC3 (magenta) and TUNEL (yellow) on sagittal sections of control (left), Rnu11 cKO (middle) and dKO (right) pallium across E12.5 (A′), E13.5 (A″) and E14.5 (A‴). Nuclei are marked by DAPI (blue). Scale bars: 30 µm. (B) Quantification of cell death via TUNEL (top) and CC3 (bottom) signal in control, Rnu11 cKO and dKO pallium across E12.5, E13.5 and E14.5. (C) Quantification of DNA damage via γH2AX signal in control, Rnu11 cKO and dKO pallium across E12.5, E13.5 and E14.5. E12.5 control n=4, Rnu11 cKO n=4, dKO n=4. E13.5 control n=5, Rnu11 cKO n=5, dKO n=5. E14.5 control n=4, Rnu11 cKO n=4, dKO n=4. Data are mean±s.e.m. *P<0.05, **P<0.01, ***P<0.001 (one-way ANOVA, followed by post-hoc Tukey test). n.s., not significant.
Fig. 7.
Fig. 7.
Model of microcephaly progression upon disruption of the minor spliceosome in the context of p53-mediated cell death. (A) Summary of microcephaly progression upon the disruption of the minor spliceosome in the Rnu11 cKO, with insights from previous work and this study (Baumgartner et al., 2018; Olthof et al., 2021). (B) Microcephaly progression upon the disruption of the minor spliceosome in the absence of cell death via Trp53 ablation in the dKO. Grayed out regions indicate nodes rescued upon genetic ablation of Trp53. Dashed arrow indicates potential, but unproven, relationship. Color coding of cell cycle defects determines temporal kinetics (red, first to blue, last) of cellular defects that occur as a result of mis-splicing of MIGs.

References

    1. Bartolini, G., Ciceri, G. and Marín, O. (2013). Integration of GABAergic interneurons into cortical cell assemblies: lessons from embryos and adults. Neuron 79, 849-864. 10.1016/j.neuron.2013.08.014 - DOI - PubMed
    1. Baumgartner, M., Lemoine, C., Al Seesi, S., Karunakaran, D. K. P., Sturrock, N., Banday, A. R., Kilcollins, A. M., Mandoiu, I. and Kanadia, R. N. (2015). Minor splicing snRNAs are enriched in the developing mouse CNS and are crucial for survival of differentiating retinal neurons. Dev. Neurobiol. 75, 895-907. 10.1002/dneu.22257 - DOI - PubMed
    1. Baumgartner, M., Olthof, A. M., Aquino, G. S., Hyatt, K. C., Lemoine, C., Drake, K., Sturrock, N., Nguyen, N., Al Seesi, S. and Kanadia, R. N. (2018). Minor spliceosome inactivation causes microcephaly, owing to cell cycle defects and death of self-amplifying radial glial cells. Development 145, dev166322. 10.1242/dev.166322 - DOI - PMC - PubMed
    1. Baumgartner, M., Drake, K. and Kanadia, R. N. (2019). An integrated model of minor intron emergence and conservation. Front. Genet. 10, 1113. 10.3389/fgene.2019.01113 - DOI - PMC - PubMed
    1. Bazzi, H. and Anderson, K. V. (2014). Acentriolar mitosis activates a p53-dependent apoptosis pathway in the mouse embryo. Proc. Natl. Acad. Sci. USA 111, E1491-E1500. 10.1073/pnas.1400568111 - DOI - PMC - PubMed

Publication types