

Imaging modalities for diagnosis and monitoring of cancer cachexia
- PMID: 34557972
- PMCID: PMC8460705
- DOI: 10.1186/s13550-021-00834-2
Imaging modalities for diagnosis and monitoring of cancer cachexia
Abstract
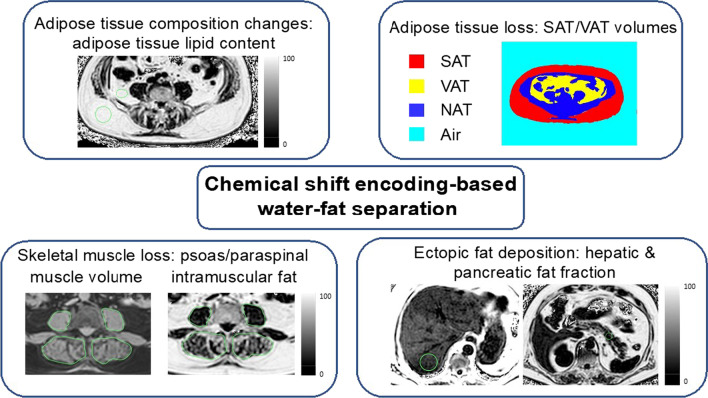
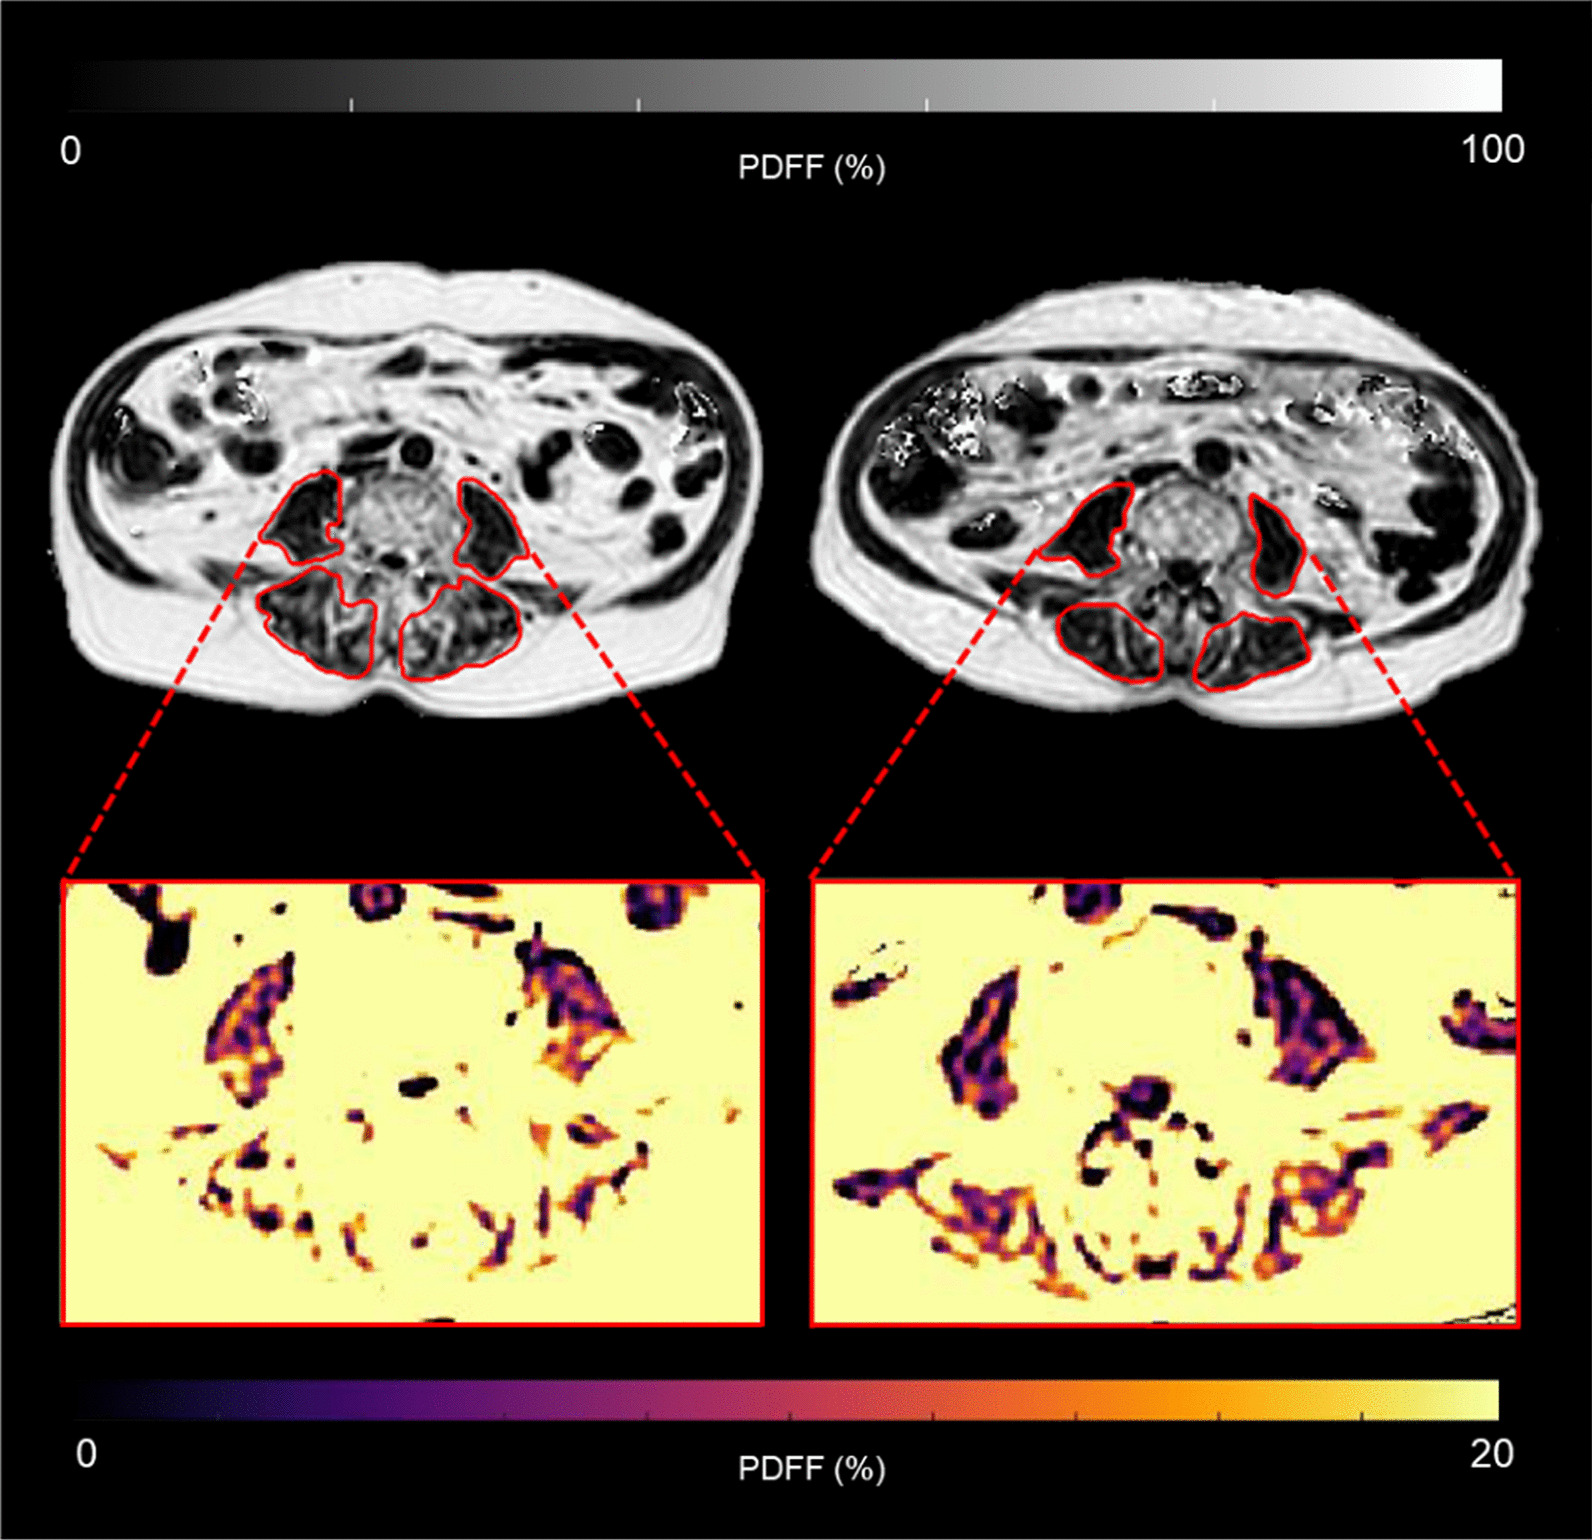
Cachexia, a multifactorial wasting syndrome, is highly prevalent among advanced-stage cancer patients. Unlike weight loss in healthy humans, the progressive loss of body weight in cancer cachexia primarily implicates lean body mass, caused by an aberrant metabolism and systemic inflammation. This may lead to disease aggravation, poorer quality of life, and increased mortality. Timely detection is, therefore, crucial, as is the careful monitoring of cancer progression, in an effort to improve management, facilitate individual treatment and minimize disease complications. A detailed analysis of body composition and tissue changes using imaging modalities-that is, computed tomography, magnetic resonance imaging, (18F) fluoro-2-deoxy-D-glucose (18FDG) PET and dual-energy X-ray absorptiometry-shows great premise for charting the course of cachexia. Quantitative and qualitative changes to adipose tissue, organs, and muscle compartments, particularly of the trunk and extremities, could present important biomarkers for phenotyping cachexia and determining its onset in patients. In this review, we present and compare the imaging techniques that have been used in the setting of cancer cachexia. Their individual limitations, drawbacks in the face of clinical routine care, and relevance in oncology are also discussed.
Keywords: Adipose tissue; Cancer cachexia progression; Computed tomography (CT); Imaging biomarkers; Imaging-based phenotyping; Magnetic resonance imaging (MRI); Skeletal muscle.
© 2021. The Author(s).
Conflict of interest statement
Dimitrios Karampinos receives grant support from Philips Healthcare. All other authors declare no competing interests.
Figures


References
-
- Argiles JM, et al. Cancer cachexia: understanding the molecular basis. Nat Rev Cancer. 2014;14(11):754–762. - PubMed
-
- Baracos VE, et al. Cancer-associated cachexia. Nat Rev Dis Primers. 2018;4(1):17105. - PubMed
-
- Fearon K, et al. Definition and classification of cancer cachexia: an international consensus. Lancet Oncol. 2011;12(5):489–495. - PubMed
-
- Hébuterne X, et al. Prevalence of malnutrition and current use of nutrition support in patients with cancer. JPEN J Parenter Enteral Nutr. 2014;38(2):196–204. - PubMed
Publication types
Grants and funding
LinkOut - more resources
Full Text Sources
