. 2021 Dec;232(6):2353-2368.
doi: 10.1111/nph.17753. Epub 2021 Oct 11.

The role of pollination in controlling Ginkgo biloba ovule development

Affiliations

The role of pollination in controlling Ginkgo biloba ovule development

Greta D'Apice et al. New Phytol. 2021 Dec.

Abstract

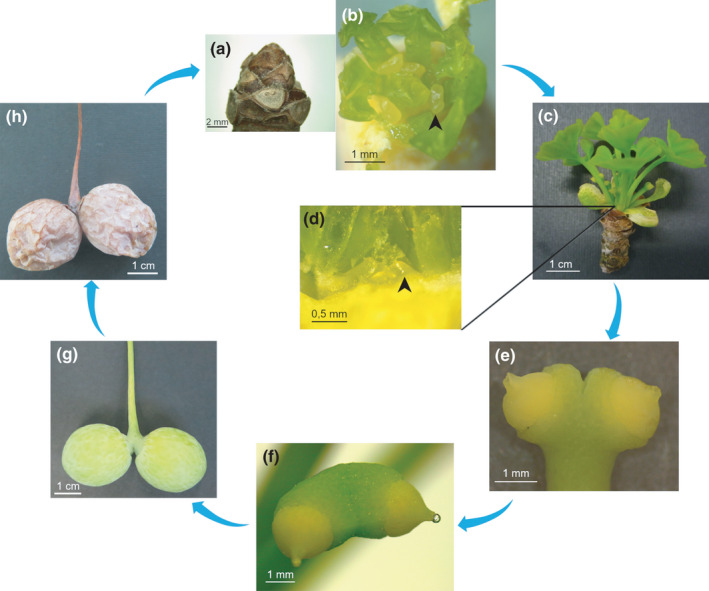
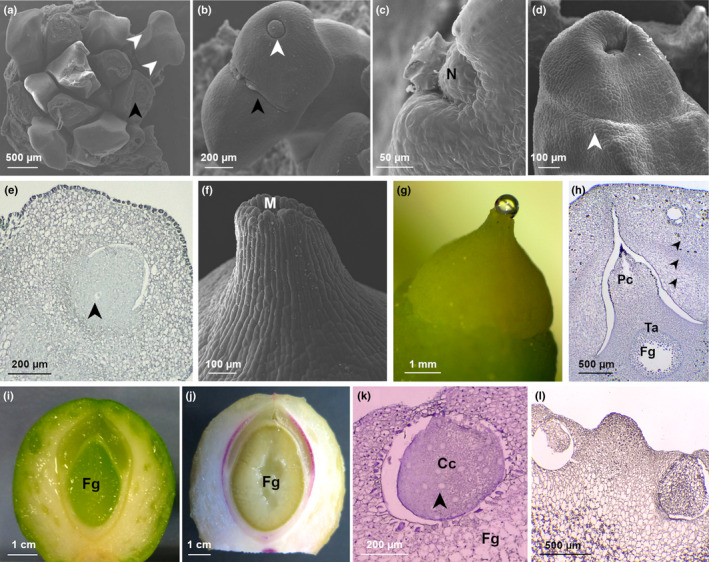
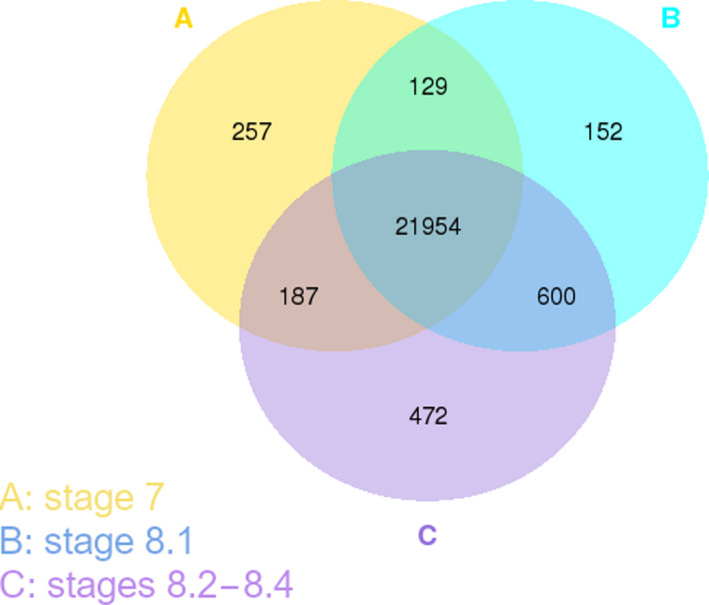
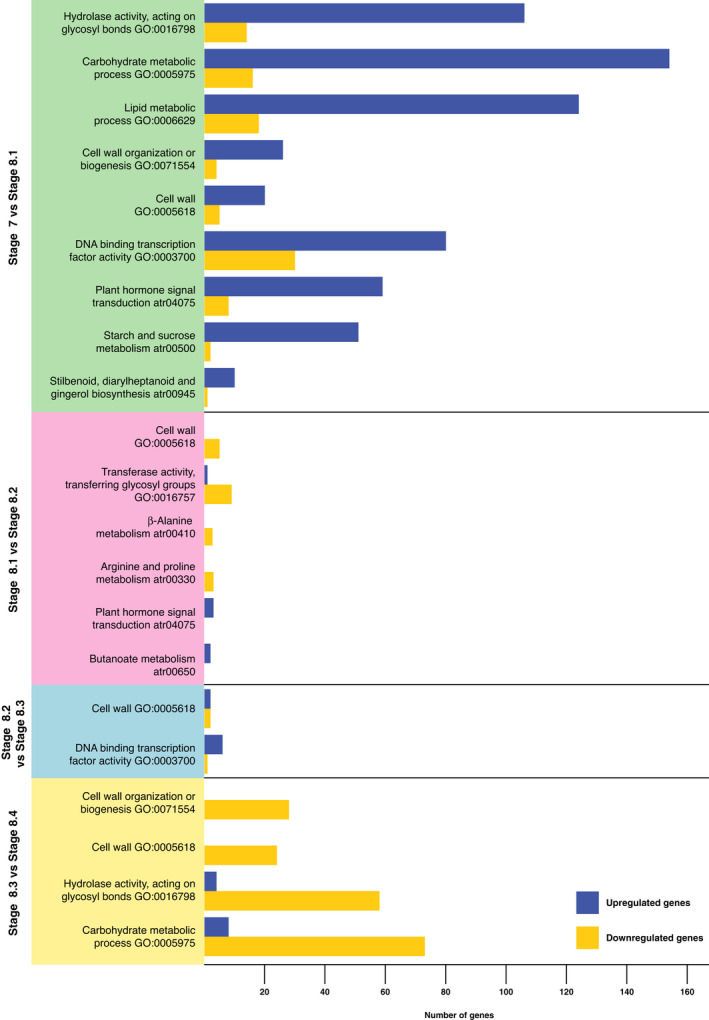
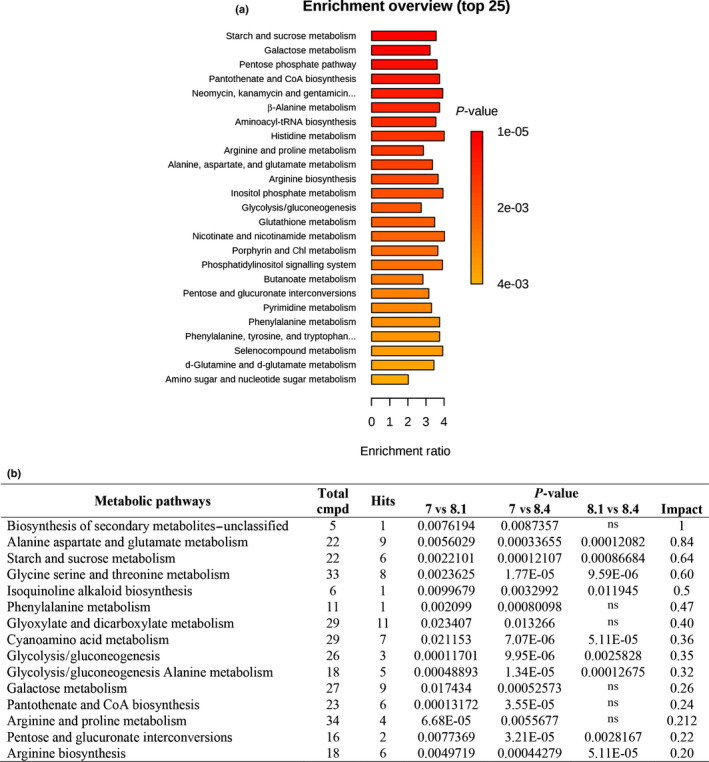
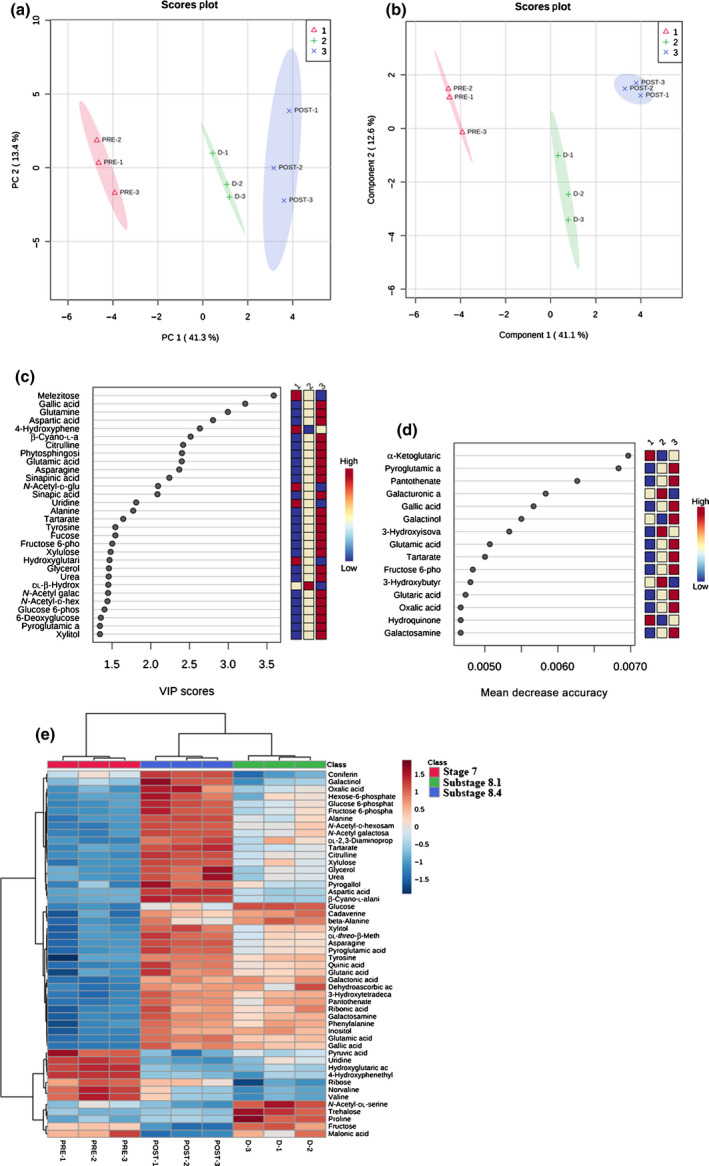
Generally, in gymnosperms, pollination and fertilization events are temporally separated and the developmental processes leading the switch from ovule integument into seed coat are still unknown. The single ovule integument of Ginkgo biloba acquires the typical characteristics of the seed coat long before the fertilization event. In this study, we investigated whether pollination triggers the transformation of the ovule integument into the seed coat. Transcriptomics and metabolomics analyses performed on ovules just prior and after pollination lead to the identification of changes occurring in Ginkgo ovules during this specific time. A morphological atlas describing the developmental stages of ovule development is presented. The metabolic pathways involved in the lignin biosynthesis and in the production of fatty acids are activated upon pollination, suggesting that the ovule integument starts its differentiation into a seed coat before the fertilization. Omics analyses allowed an accurate description of the main changes that occur in Ginkgo ovules during the pollination time frame, suggesting the crucial role of the pollen arrival on the progression of ovule development.

Keywords: Ginkgo biloba; gymnosperms; metabolomics; ovule development; ovule morphology; pollination; transcriptomics.


Figures

Fig. 1
Fig. 1
The entire development process of the ovule of Ginkgo biloba until seed maturation. Clockwise: (a) wintering bud; (b) opened wintering bud with ovules already present inside (black arrow‐head); (c) just opened bud with exposed leaves and ovules; (d) enlarged detail from (c): following year ovule primordia already recognizable under metabolically active leaves at the short‐shoot tip (black arrow‐head); Stage 1 of ovule development; (e) developing ovules; (f) developing ovules with pollination drops; (g) ovule development throughout the summer, until the fertilization takes place in late summer; (h) mature seeds.
Fig. 2
Fig. 2
Stages of Ginkgo biloba ovule development. (a) Stage 2: differentiation of ovule primordia. Scanning electron microscopy (SEM) image of a bud deprived of leaves primordia (black arrowhead) showing developing ovules (white arrowheads show the two ovule primordia borne on a single stalk). (b) Stage 3: nucellus and integument differentiation. SEM image of ovules in which the forming nucellus is visible (white arrowhead); the sulcus, which separates the two ovules, is also shown (black arrowhead); polar view. (c) Stage 4: integument growth begins to enclose the nucellus. SEM image showing the detail of the ovule integument growing and flanking the nucellus, polar view. (d) Stage 5: integument has completely enclosed the nucellus; ovular collar differentiation. SEM image of an ovule showing the integument engulfing the underlying nucellus. Ovular collar is recognizable (white arrowhead). (e) Stage 6: meiosis of the megaspore mother cell (MMC) and subsequent mitosis of the functional megaspore; development of the female gametophyte starts. Longitudinal section of a paraffin‐embedded ovule showing the MMC (black arrowhead) in the centre of the nucellus. (f) Stage 7: pre‐pollination stage. Micropyle, micropyle canal, and pollen chamber are completely formed. SEM detail of the micropyle. (g) Stage 8: pollination stage. Pollination drop exposed. (h) Stage 9: female gametophyte growing; integument layers are becoming distinguishable. Longitudinal section of a paraffin‐embedded ovule showing the three layers of the developing integument that are differentiating (indicated by black arrowheads). (i) Stage 10: cellularization of the female gametophyte. Longitudinal section of a fresh ovule showing the central green and cellularized female gametophyte. (j) Stage 11: sclerotesta lignification. Section of a fresh ovule showing the lignified sclerotesta (in purple) stained with phloroglucinol. (k) Stage 12: archegonia completely formed. Longitudinal section of a paraffin‐embedded ovule showing the archegonium that contains the differentiated archegonial central cell. Shortly before fertilization the central cell will divide to originate the egg cell that will be fertilized. Black arrowhead indicates lipid inclusions. (l) Stage 13: formed embryo. Longitudinal section of a paraffin‐embedded seed in which the embryo is visible within the archegonium on the right. The unfertilized archegonium on the left is degenerating. Cc, central cell; Fg, female gametophyte; M, micropyle; N, nucellus; Pc, pollen chamber; Ta, tapetum.
Fig. 3
Fig. 3
Coexpression Venn diagram from the RNA sequencing experiment performed on Ginkgo biloba ovules. Coexpression Venn diagram represents the significant Differentially expressed genes among the sequenced stages, considering the three postpollination drop substages (8.2, 8.3, and 8.4) as a unique postpollination stage.
Fig. 4
Fig. 4
Diagram of the enriched pathways resulted from the RNA sequencing experiments performed on Ginkgo biloba ovules at five stages of development. The Gene Ontology (GO) and the Kyoto Encyclopedia of Genes and Genomes (KEGG) analyses indicate which pathways are significantly associated with differentially expressed genes. The graph shows the paired comparisons between the five sequenced substages, and significant GO and KEGG enriched pathways are reported for each comparison. The bar length indicates the number of up (blue bars) and downregulated (yellow bars) genes belonging to the respective pathways.
Fig. 5
Fig. 5
Kyoto Encyclopedia of Genes and Genomes‐based enrichment analysis of Ginkgo biloba ovules during the pollination phase. (a) Pathway enrichment analysis reveals different metabolic pathways enriched during different ovule stages (P‐value cut off ≤ 0.05). (b) The result from ‘Pathway Analysis’ carried out with the web‐based tool MetPA using the concentrations of metabolite identified in Ginkgo ovules during the pre‐pollination (stage 7), pollination drop (substage 8.1) and postpollination drop (substage 8.4) stages. Total cmpd, the total number of compounds in the pathway; Hits, the matched number from the uploaded data; Raw P, the original P‐value; Impact, the pathway impact value calculated from pathway topology analysis. The complete pathway analysis, including the full list of the pathways, the False discovery rate applied to the P‐value) and Holm adjustment (used to counteract the problem of multiple comparisons) are reported in Supporting Information Table S4. ns, no significant statistical difference.
Fig. 6
Fig. 6
Discrimination through principal component analysis (PCA) and partial least square discriminant analysis (PLS‐DA) of Ginkgo biloba ovule samples in the three stages analysed based on metabolomics analysis. (a) PCA and (b) PLS‐DA showing score plots discriminating stage 7 (indicated in the legend with 1), substage 8.1 (indicated with 2), and substage 8.4 (indicated with 3) groups by virtue of the first two principal components (PCs). (c) Variable importance of projection (VIP) features for the groups from PLS‐DA analysis. (d) Random forest analysis displaying the mean decrease accuracies. (e) Overlay heatmap of the top 50 metabolites profiles (selected by ANOVA with P ≤ 0.05) in stage 7 (1), substage 8.1 (2), and substage 8.4 (3). PRE1–PRE3 are replicates of stage 7 (pre‐pollination stage); D1–D3 are replicates of substage 8.1 (pollination drop substage) and POST1–POST3 are replicates of substage 8.4 (postpollination‐drop substage). Each square represents the different stage's effect on every metabolite's relative abundance using a false‐colour scale. Colours dark red and blue indicate relative metabolite abundances, increased and decreased, respectively (n = 3).

References

    1. von Aderkas P, Prior NA, Little SA. 2018. The evolution of sexual fluids in gymnosperms from pollination drops to nectar. Frontiers in Plant Science 9: e1844. - PMC - PubMed
    1. Aoki D, Hanaya Y, Akita T, Matsushita Y, Yoshida M, Kuroda K, Yagami S, Takama R, Fukushima K. 2016. Distribution of coniferin in freeze‐fixed stem of Ginkgo biloba L. by cryo‐TOF‐SIMS/SEM. Scientific Reports 6: e31525. - PMC - PubMed
    1. Avanzi S, Cionini PG. 1971. A DNA cytophotometric investigation on the development of the female gametophyte of Ginkgo biloba . Caryologia 24: 105–116.
    1. Barro‐Trastoy D, Dolores Gomez M, Tornero P, Perez‐Amador MA. 2020. On the way to ovules: the hormonal regulation of ovule development. Critical Reviews in Plant Sciences 39: 431–456.
    1. Becker A, Winter KU, Meyer B, Saedler H, Theißen G. 2000. MADS‐box gene diversity in seed plants 300 million years ago. Molecular Biology and Evolution 17: 1425–1434. - PubMed

Publication types