. 2021 Dec;110(6):1253-1268.
doi: 10.1002/JLB.5MA0721-825R. Epub 2021 Sep 24.

Dynamic changes in human single-cell transcriptional signatures during fatal sepsis

Affiliations

Dynamic changes in human single-cell transcriptional signatures during fatal sepsis

Xinru Qiu et al. J Leukoc Biol. 2021 Dec.

Abstract

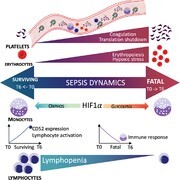
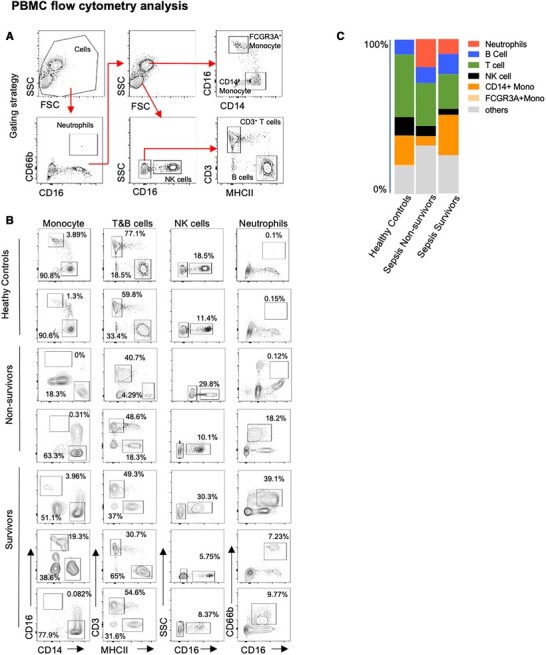
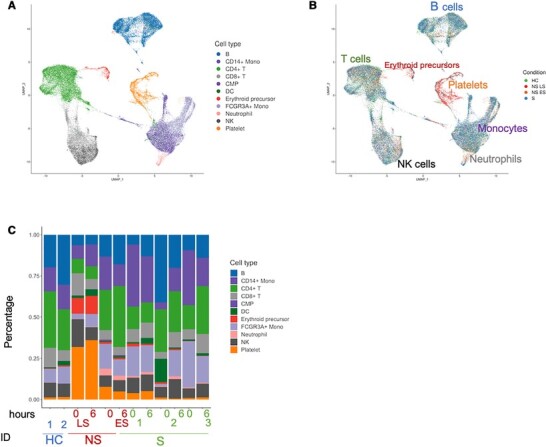
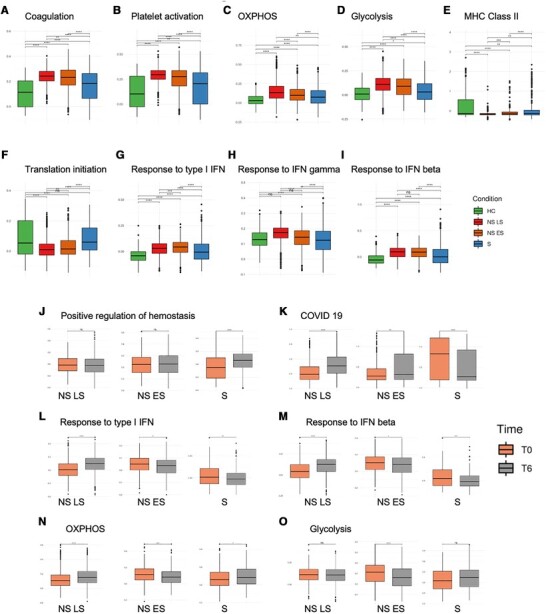
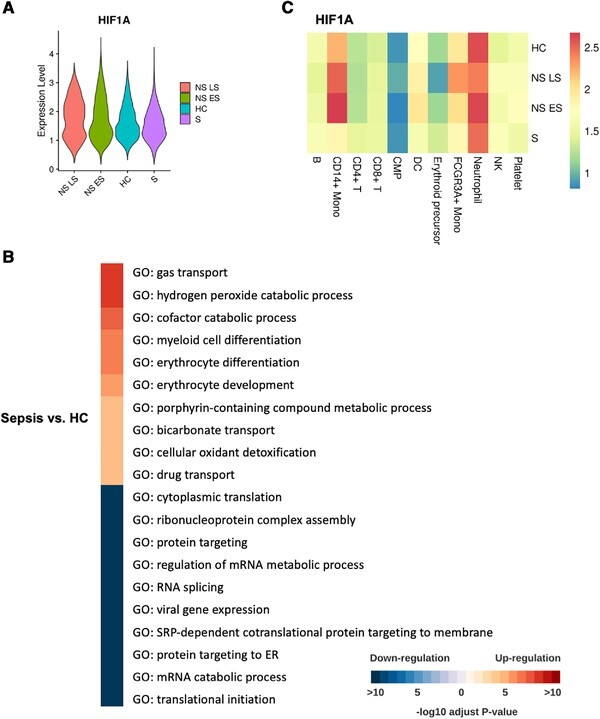
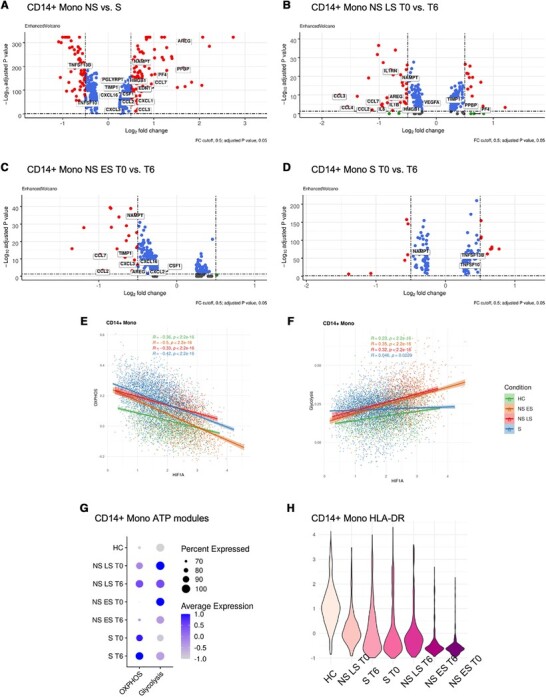
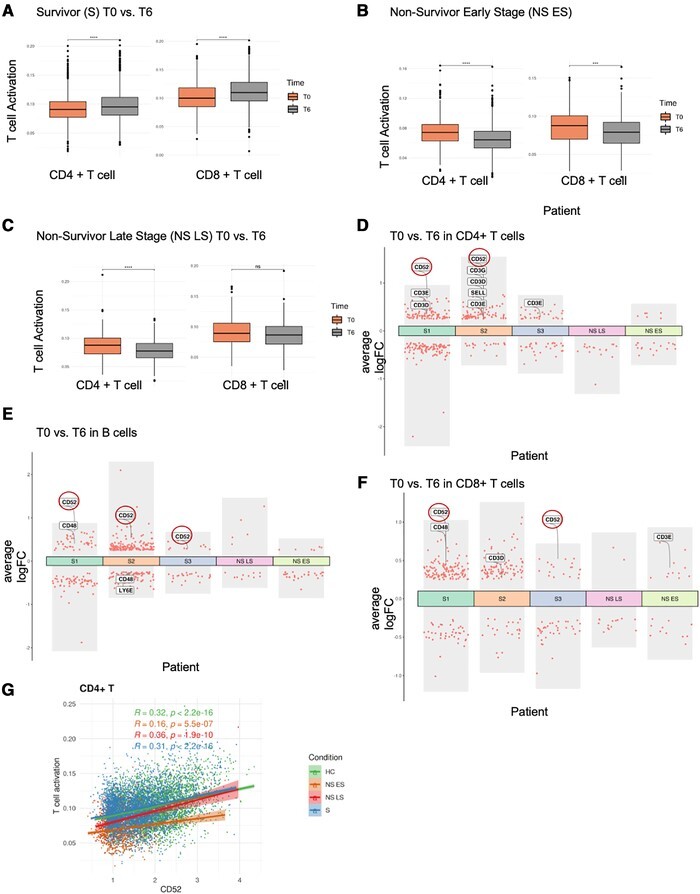
Systemic infections, especially in patients with chronic diseases, may result in sepsis: an explosive, uncoordinated immune response that can lead to multisystem organ failure with a high mortality rate. Patients with similar clinical phenotypes or sepsis biomarker expression upon diagnosis may have different outcomes, suggesting that the dynamics of sepsis is critical in disease progression. A within-subject study of patients with Gram-negative bacterial sepsis with surviving and fatal outcomes was designed and single-cell transcriptomic analyses of peripheral blood mononuclear cells (PBMC) collected during the critical period between sepsis diagnosis and 6 h were performed. The single-cell observations in the study are consistent with trends from public datasets but also identify dynamic effects in individual cell subsets that change within hours. It is shown that platelet and erythroid precursor responses are drivers of fatal sepsis, with transcriptional signatures that are shared with severe COVID-19 disease. It is also shown that hypoxic stress is a driving factor in immune and metabolic dysfunction of monocytes and erythroid precursors. Last, the data support CD52 as a prognostic biomarker and therapeutic target for sepsis as its expression dynamically increases in lymphocytes and correlates with improved sepsis outcomes. In conclusion, this study describes the first single-cell study that analyzed short-term temporal changes in the immune cell populations and their characteristics in surviving or fatal sepsis. Tracking temporal expression changes in specific cell types could lead to more accurate predictions of sepsis outcomes and identify molecular biomarkers and pathways that could be therapeutically controlled to improve the sepsis trajectory toward better outcomes.

Keywords: CD52; Gram-negative bacteria; inflammation; platelet; sepsis.


Figures

Graphical Abstract
Graphical Abstract
FIGURE 1
FIGURE 1
Flow cytometric analysis of PBMC from healthy control (HC), non-survivor (NS), and survivor (S) sepsis patients at first blood collection (T0). (A) Gating strategy. Neutrophils (CD66b+CD16+), FCGR3A+Monocytes (CD66bSSCHiCD16+CD14low), CD14+Monocytes (CD66bSSCHiCD16CD14hi), NK cells (CD66bSSClowCD16+), T cells (SSClowCD3+), and B cells (SSClowMHCII+). (B) Frequency of immune cell subsets in PBMC. (C) Immune cell proportions in PBMC
FIGURE 2
FIGURE 2
Single-cell transcriptional profiling of PBMC from healthy controls and gram-negative sepsis patients. (A) Cell type UMAP representation of all merged samples. A total of 11 cell types were identified by the consensus method. In total, 57,133 cells are depicted. (B) Sample of origin UMAP representation of all merged samples. Cells were colored by the condition. (C) Bar plots showing the fraction of each sample
FIGURE 3
FIGURE 3
Platelet transcriptional changes over 6 h are associated with sepsis severity.  (A– I) Comparisons of pathway module scores across four conditions in platelets. The included modules contain genes related to (A) Coagulation, (B) Platelet activation, (C) OXPHOS, (D) Glycolysis, (E) MHC Class II, (F) Translation initiation, (G) Response to type I IFN, (H) Response to IFN gamma, (I) Response to IFN beta. (J–O) Pathway module scores comparison between T0 vs. T6 in platelets. The included modules contain genes related to (J) positive regulation of hemostasis, (K) COVID-19, (L) response to type I IFN, (M) response to IFN-β, (N) OXPHOS, and (O) glycolysis. The differences in scores associated with adjusted P-values below 0.05, 0.01, 0.001, and 0.0001 are indicated as *, **, ***, and ****, respectively and “ns” – not significant. The significance analysis was performed using Wilcoxon tests
FIGURE 4
FIGURE 4
Elevated erythroid precursor cells are associated with hypoxic stress. (A) The expression of the HIF1A gene in erythroid precursors across four conditions. Violin plots are ordered according to the decreasing average value of HIF1A expression. (B) Pathway enrichment when comparing erythroid precursors in sepsis vs. HC. All the GO terms are aligned to representative ones by Revigo with a similarity of 0.4. The top 10 -log10 adjust P-values were selected shown in the heatmap. Color red are up-regulated pathways in sepsis patients. The color blue is downregulated pathways in sepsis patients. (C) The comparison of expression of HIF1A in the four conditions. Heatmap coloring represents log-normalized mean gene expression counts averaged across all cells
FIGURE 5
FIGURE 5
Fatal sepsis patients exhibit immunosuppressive pathways in monocytes. (A-D) Differential expression genes in CD14+ monocytes from (A) NS versus S, (B) NS LS T0 versus T6, (C) NS ES T0 versus T6, (D) S T0 versus T6. Volcano plots were prepared with R package EnhancedVolcano.  (E and F) The correlations between the HIF1A expression and module score for (E) OXPHOS and (F) glycolysis in CD14+ monocytes across each condition. R‑values from Pearson's correlation, exact 2-sided P-values, and the 95% confidence intervals are shown on each graph. Each dot represents a single cell. Only cells with HIF1A expression ≠ 0 were included in the analysis. Green, orange, red and blue points represent cells from HC, NS ES, NS LS, and S samples, respectively. (G) The percentage of cells with ATP-related pathway modules in CD14+ monocytes across healthy controls and sepsis conditions at T0 and T6. The color saturation indicates the average expression level, and the circle's size indicates the percentage of cells expressing a given module. (H) HLA-DR-related genes expression in CD14+ monocytes across healthy controls and sepsis conditions at T0 and T6. Violin plots are ordered with the decreasing expression average value of HLA-DR-associated genes. The color saturation indicates the average expression level, the darker the color, the lower the average expression level
FIGURE 6
FIGURE 6
CD52 expression correlates with lymphocyte activation. (A-C) T cell activation pathway module score comparison between T0 and T6 in T cells. (A) Survivors (S), (B) Nonsurvivor early stage (NS ES), and (C) Nonsurvivor late stage (NS LS). The differences in scores associated with adjusted P-values below 0.05, 0.01, 0.001, and 0.0001 are indicated as *, **, ***, and ****, respectively. The significance analysis was performed using Wilcoxon tests. (D-F) Differential gene expression analysis showing up- and down-regulated genes with |log2FC| > 0.25 and adjusted P-value < 0.05 across all 5 sepsis patients between T0 and T6 in (D) CD4+ T cells, (E) B cells, (F) CD8+ T cells. (G) CD52 expression and its correlation with the T cell activation pathway module score in CD4+ T cells across four conditions. R‑values from Pearson's correlation, exact 2-sided P-values, and the 95% confidence intervals are shown on each graph. Each dot represents a single cell. Only cells with CD52 expression ≠ 0 were included in the analysis. Green, orange. red and blue points represent cells from HC, NS ES, NS LS, and S samples, respectively

References

    1. Tiru B, Dinino EK, Orenstein A et al. The economic and humanistic burden of severe sepsis. Pharmacoeconomics. 2015;33:925–937. - PubMed
    1. Rudd KE, Johnson SC, Agesa KM et al. Global, regional, and national sepsis incidence and mortality, 1990–2017: analysis for the Global Burden of Disease Study. Lancet. 2020;395:200–211. - PMC - PubMed
    1. Aziz M, Jacob A, Yang W-L, Matsuda A, Wang P. Current trends in inflammatory and immunomodulatory mediators in sepsis. J Leukoc Biol. 2013;93:329–342. - PMC - PubMed
    1. Van Der Poll T, Van De Veerdonk FL, Scicluna BP, Netea MG. The immunopathology of sepsis and potential therapeutic targets. Nat Rev Immunol. 2017;17:407–420. - PubMed
    1. Pierrakos C, Velissaris D, Bisdorff M, Marshall JC, Vincent J-L. Biomarkers of sepsis: time for a reappraisal. Crit Care. 2020;24:287. - PMC - PubMed

Publication types