

Comparative efficacy and safety for second-line treatment with ramucirumab, regorafenib, and cabozantinib in patients with advanced hepatocellular carcinoma progressed on sorafenib treatment: A network meta-analysis
- PMID: 34559096
- PMCID: PMC8462645
- DOI: 10.1097/MD.0000000000027013
Comparative efficacy and safety for second-line treatment with ramucirumab, regorafenib, and cabozantinib in patients with advanced hepatocellular carcinoma progressed on sorafenib treatment: A network meta-analysis
Abstract
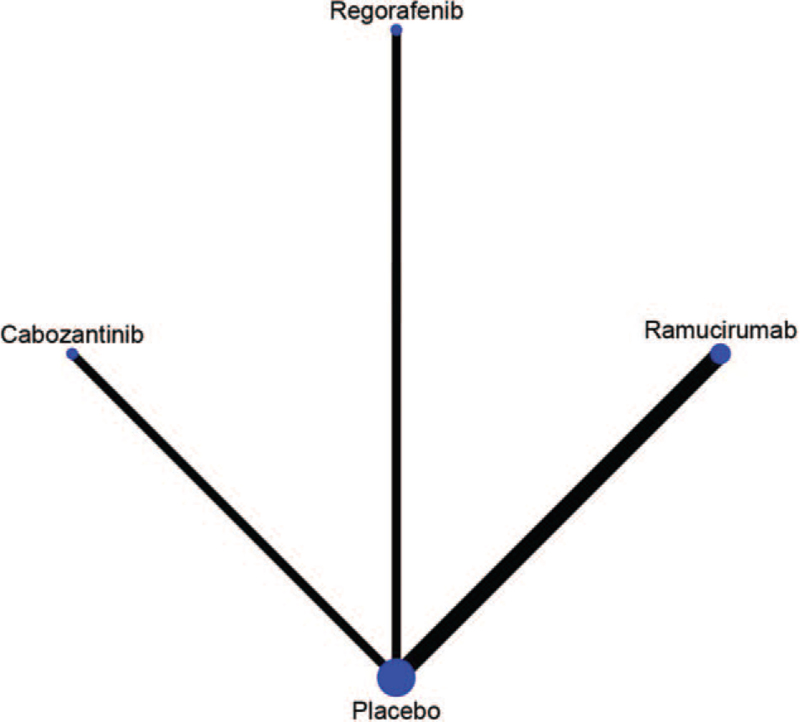
Background: The present network meta-analysis was conducted to perform an indirect comparison among ramucirumab, regorafenib, and cabozantinib in patients with advanced hepatocellular carcinoma (HCC) progressed on sorafenib treatment.
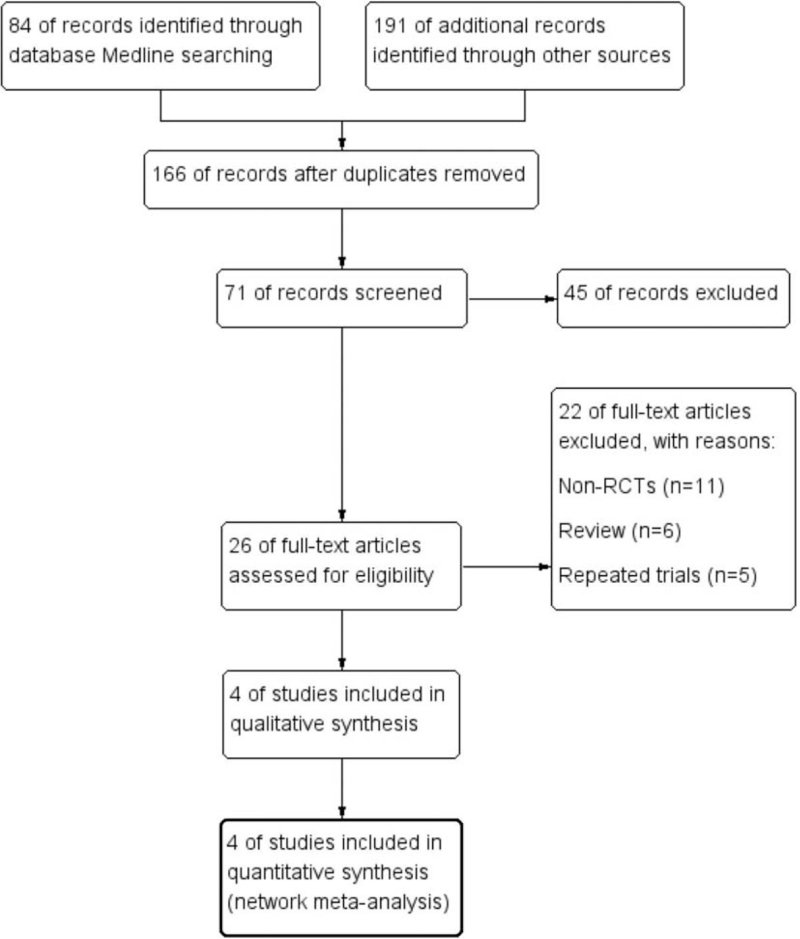
Methods: A systematic review through Medline, Embase, and Cochrane library was developed, with eligible randomized clinical trials been included. Hazard ratios (HRs) including progression-free survival (PFS), overall survival (OS), odds ratios of disease control rate (DCR), objective response rate (ORR), and adverse events were compared indirectly with network meta-analysis using random model in software STATA version 13.0.
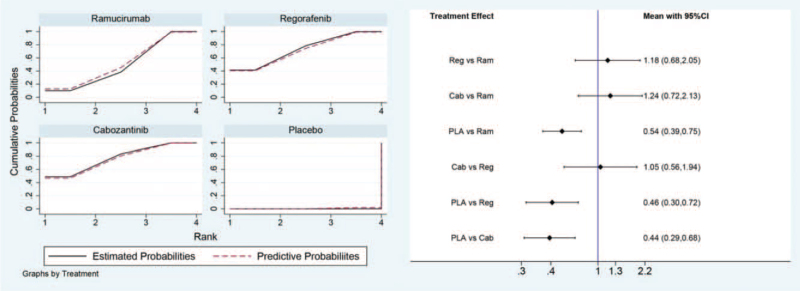
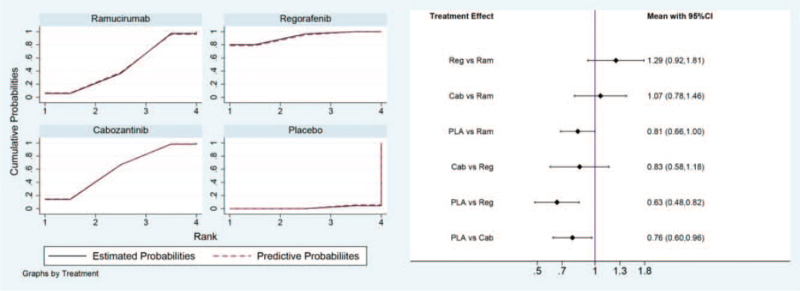
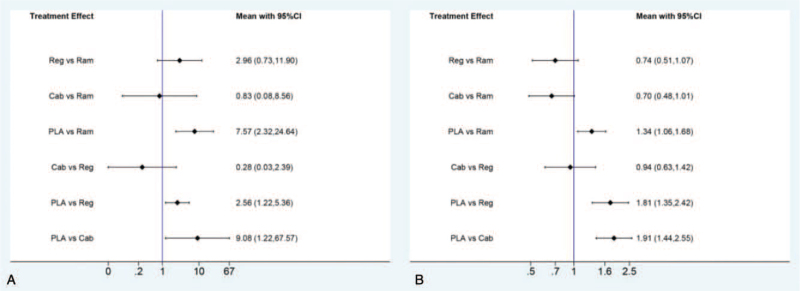
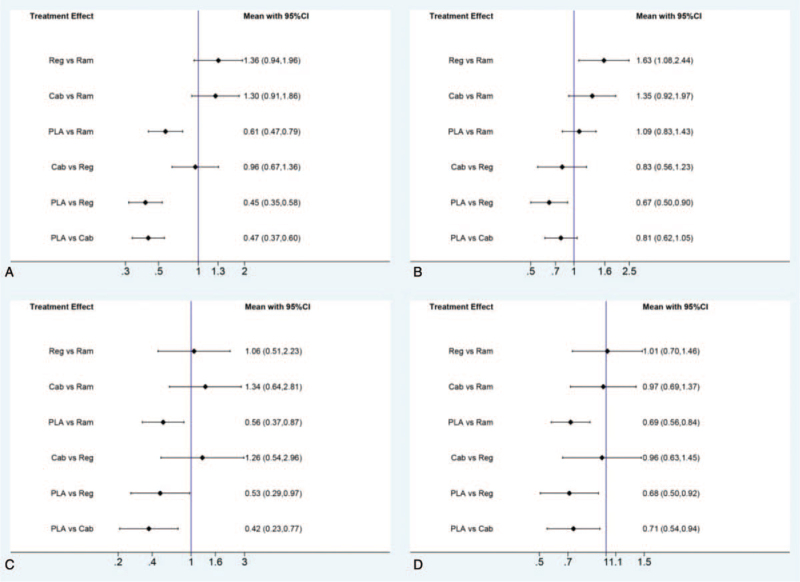
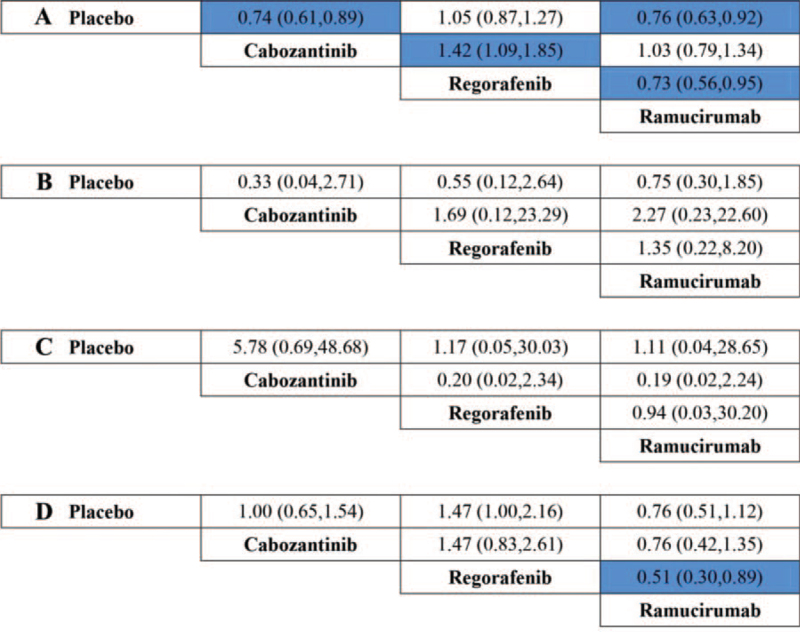
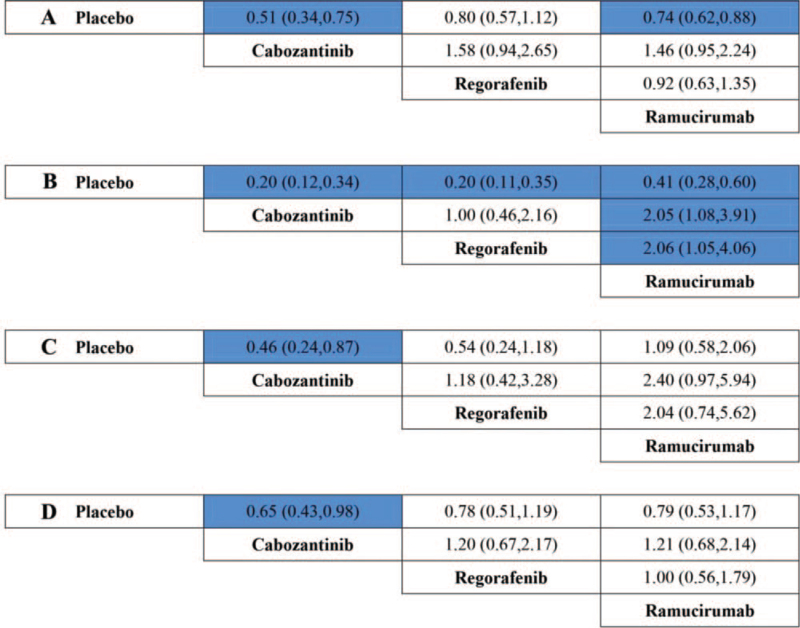
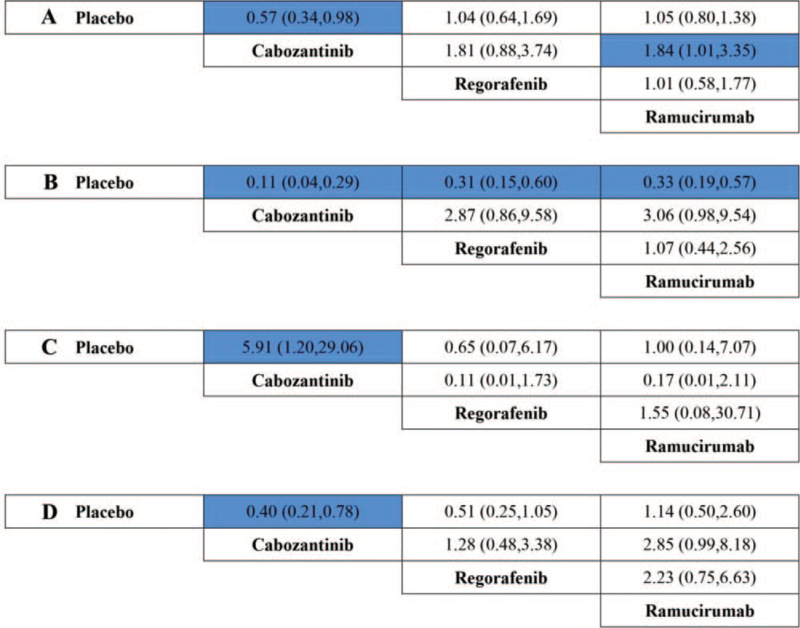
Results: A total of 4 randomized clinical trials including 2137 patients met the eligibility criteria and enrolled. Indirect comparisons showed that there was no statistical difference observed in the indirect comparison of PFS, OS, ORR, or DCR among agents of regorafenib, cabozantinib, and ramucirumab in advanced HCC patients with elevated α-fetoprotein (AFP) (400 ng/mL or higher). However, in patients with low-level AFP (lower than 400 ng/mL), regorafenib was the only agent associated with significant superiority in OS, compared with placebo (hazard ratio 0.67, 95% CI, 0.50-0.90).
Conclusions: The present network meta-analysis revealed that there might be no statistical difference observed in the indirect comparison of PFS, OS, ORR, or DCR among regorafenib, cabozantinib, or ramucirumab in advanced HCC patients with elevated AFP (400 ng/mL or higher). However, in patients with low-level AFP (lower than 400 ng/mL), regorafenib might be associated with significant superiority in OS, compared to placebo, which need further investigation in clinical practice.
Copyright © 2021 the Author(s). Published by Wolters Kluwer Health, Inc.
Conflict of interest statement
The authors have no funding and conflicts of interest to disclose.
Figures
Similar articles
-
Comparative Efficacy of Cabozantinib and Regorafenib for Advanced Hepatocellular Carcinoma.Adv Ther. 2020 Jun;37(6):2678-2695. doi: 10.1007/s12325-020-01378-y. Epub 2020 May 18. Adv Ther. 2020. PMID: 32424805 Free PMC article.
-
Second-line treatment of hepatocellular carcinoma after sorafenib: Characterizing treatments used over the past 10 years and real-world eligibility for cabozantinib, regorafenib, and ramucirumab.Cancer Med. 2020 Jul;9(13):4640-4647. doi: 10.1002/cam4.3116. Epub 2020 May 7. Cancer Med. 2020. PMID: 32378799 Free PMC article.
-
Efficacy and safety of second-line therapies for advanced hepatocellular carcinoma: a network meta-analysis of randomized controlled trials.BMC Cancer. 2024 Aug 19;24(1):1023. doi: 10.1186/s12885-024-12780-y. BMC Cancer. 2024. PMID: 39160484 Free PMC article.
-
Efficacy of Second-Line Treatments After Atezolizumab and Bevacizumab in Advanced Hepatocellular Carcinoma and Related Prognostic Factors: A Multicenter Study by the Turkish Oncology Group (TOG).Turk J Gastroenterol. 2025 Apr 7;36(5):293-301. doi: 10.5152/tjg.2025.24784. Turk J Gastroenterol. 2025. PMID: 40241388 Free PMC article.
-
Optimizing Survival and the Changing Landscape of Targeted Therapy for Intermediate and Advanced Hepatocellular Carcinoma: A Systematic Review.J Natl Cancer Inst. 2021 Feb 1;113(2):123-136. doi: 10.1093/jnci/djaa119. J Natl Cancer Inst. 2021. PMID: 32898239 Free PMC article.
Cited by
-
Systemic Oncological Treatments versus Supportive Care for Patients with Advanced Hepatobiliary Cancers: An Overview of Systematic Reviews.Cancers (Basel). 2023 Jan 26;15(3):766. doi: 10.3390/cancers15030766. Cancers (Basel). 2023. PMID: 36765723 Free PMC article. Review.
-
Efficacy and safety of regorafenib as a first-line agent alone or in combination with an immune checkpoint inhibitor for advanced hepatocellular carcinoma: a retrospective cohort study.J Gastrointest Oncol. 2024 Jun 30;15(3):1072-1081. doi: 10.21037/jgo-24-315. Epub 2024 Jun 27. J Gastrointest Oncol. 2024. PMID: 38989425 Free PMC article.
-
Anticancer Drugs Compared to No Anticancer Drugs in Patients with Advanced Hepatobiliary Cancer: A Mapping Review and Evidence Gap Map.Clin Epidemiol. 2023 Nov 10;15:1069-1085. doi: 10.2147/CLEP.S431498. eCollection 2023. Clin Epidemiol. 2023. PMID: 38025841 Free PMC article. Review.
-
Effectiveness of regorafenib in second-line therapy for advanced hepatocellular carcinoma: A systematic review and meta-analysis.Medicine (Baltimore). 2025 Jan 24;104(4):e41356. doi: 10.1097/MD.0000000000041356. Medicine (Baltimore). 2025. PMID: 39854748 Free PMC article.
-
Effectiveness and safety of angiogenesis inhibitors combined with PD-1/PD-L1 blockades in the first-line treatment of patients with advanced hepatocellular carcinoma: A single-center retrospective study.Medicine (Baltimore). 2025 Mar 14;104(11):e41814. doi: 10.1097/MD.0000000000041814. Medicine (Baltimore). 2025. PMID: 40101095 Free PMC article.
References
-
- Akinyemiju T, Abera S, Ahmed M, et al. . C. Global Burden of Disease Liver Cancer. The burden of primary liver cancer and underlying etiologies from 1990 to 2015 at the global, regional, and national level: results from the global burden of disease study 2015. JAMA Oncol 2017;3:1683–91. - PMC - PubMed
-
- Fattovich G, Stroffolini T, Zagni I, Donato F. Hepatocellular carcinoma in cirrhosis: incidence and risk factors. Gastroenterology 2004;127: (Suppl 1): S35–50. - PubMed
-
- European Association For The Study Of The Liver, European Organisation For Research And Treatment of Cancer. EASL-EORTC clinical practice guidelines: management of hepatocellular carcinoma. J Hepatol 2012;56:908–43. - PubMed
Publication types
MeSH terms
Substances
LinkOut - more resources
Full Text Sources
Medical
Miscellaneous
