. 2021 Sep 24;7(39):eabh2350.
doi: 10.1126/sciadv.abh2350. Epub 2021 Sep 24.

Cell activity modulation and its specific function maintenance by bioinspired electromechanical nanogenerator

Affiliations

Cell activity modulation and its specific function maintenance by bioinspired electromechanical nanogenerator

Tong Li et al. Sci Adv. .

Abstract

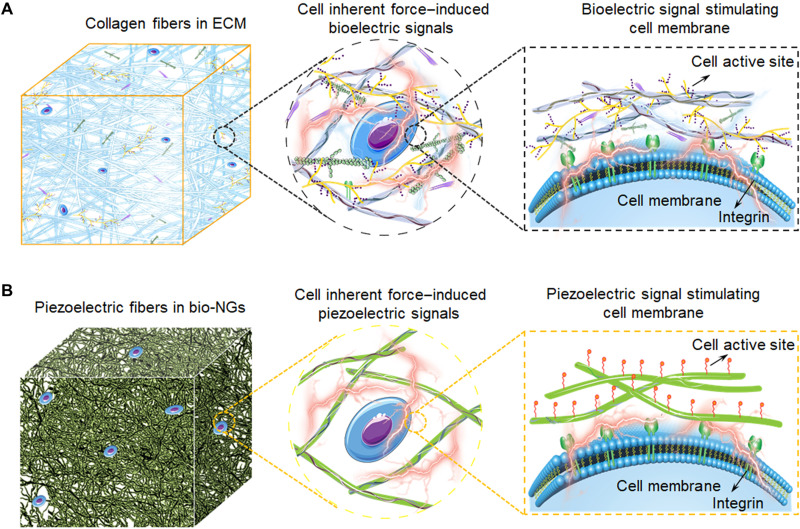
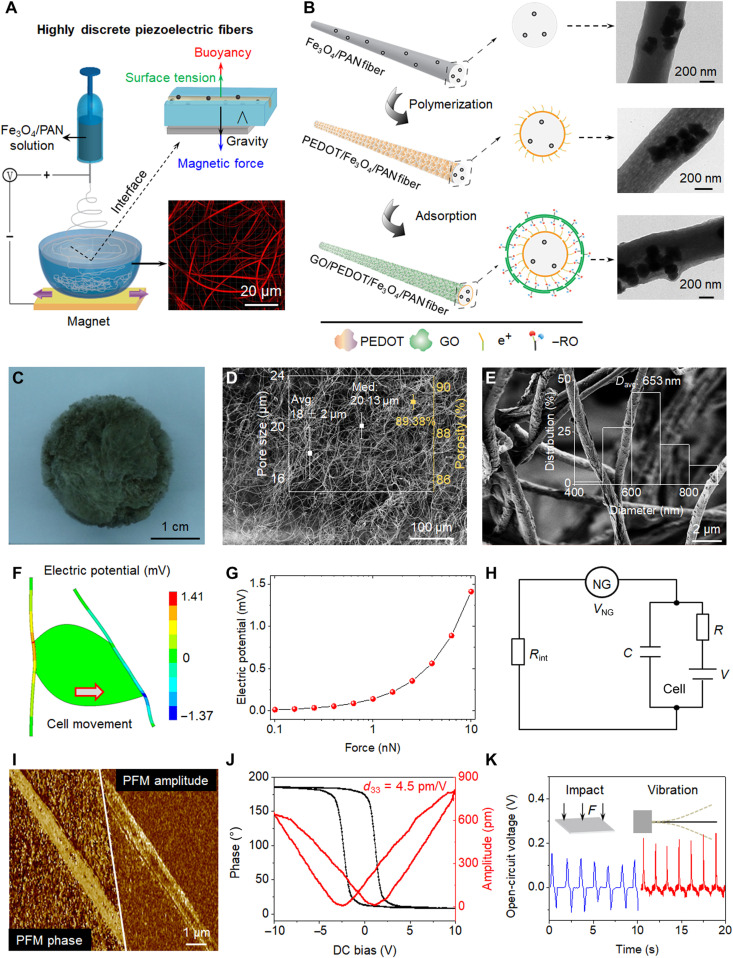
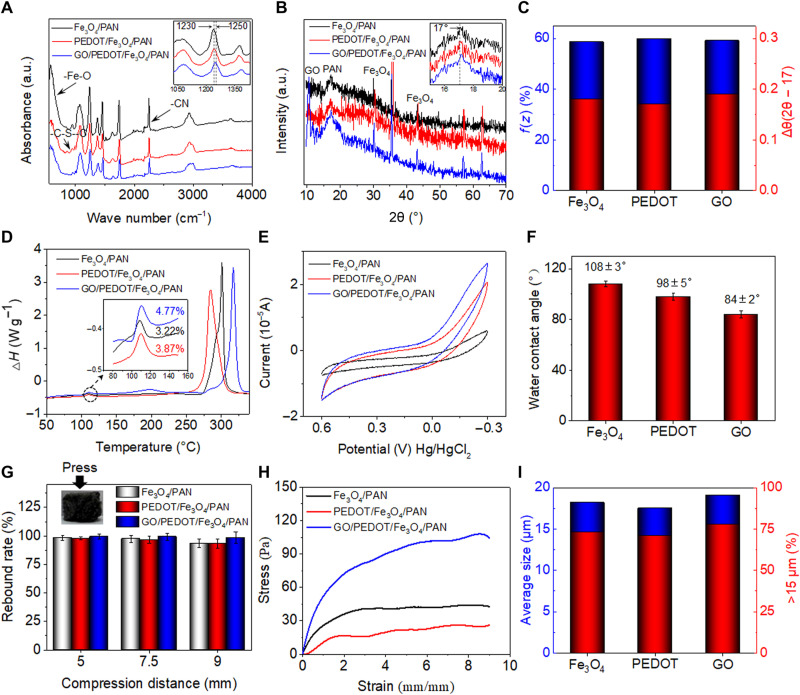
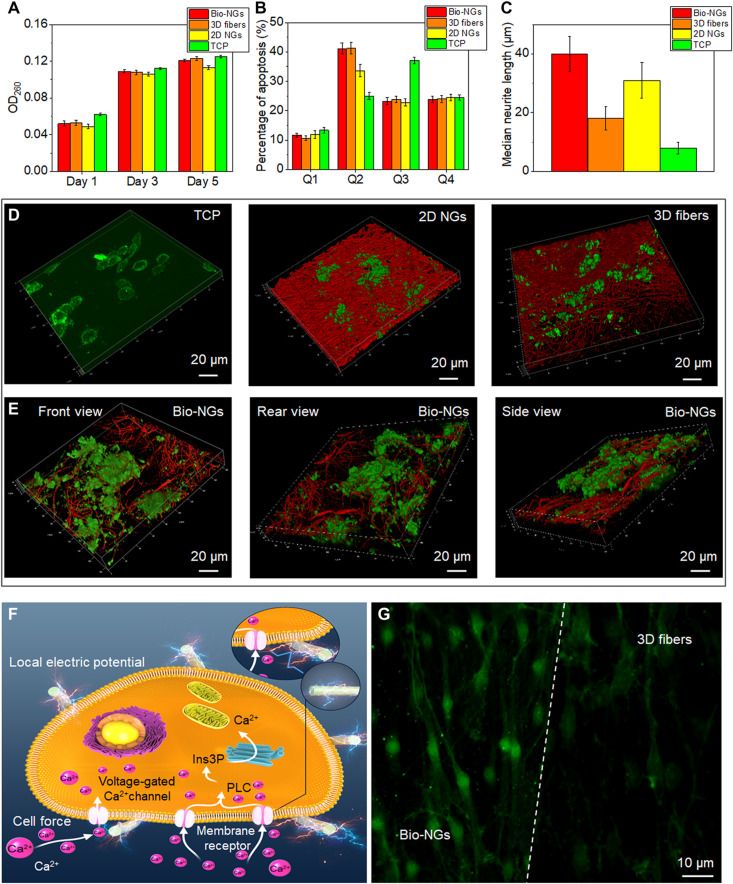
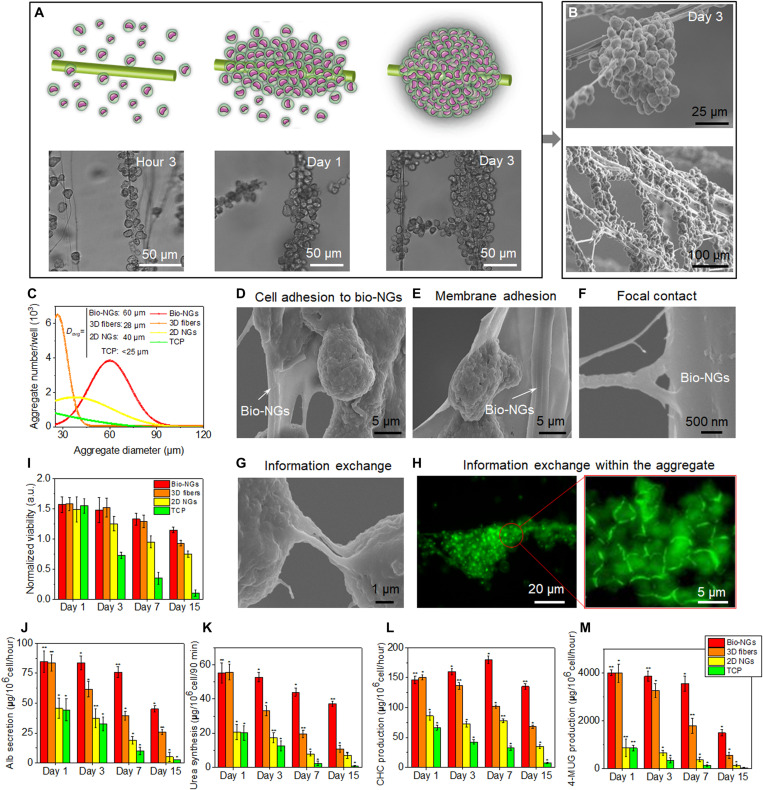
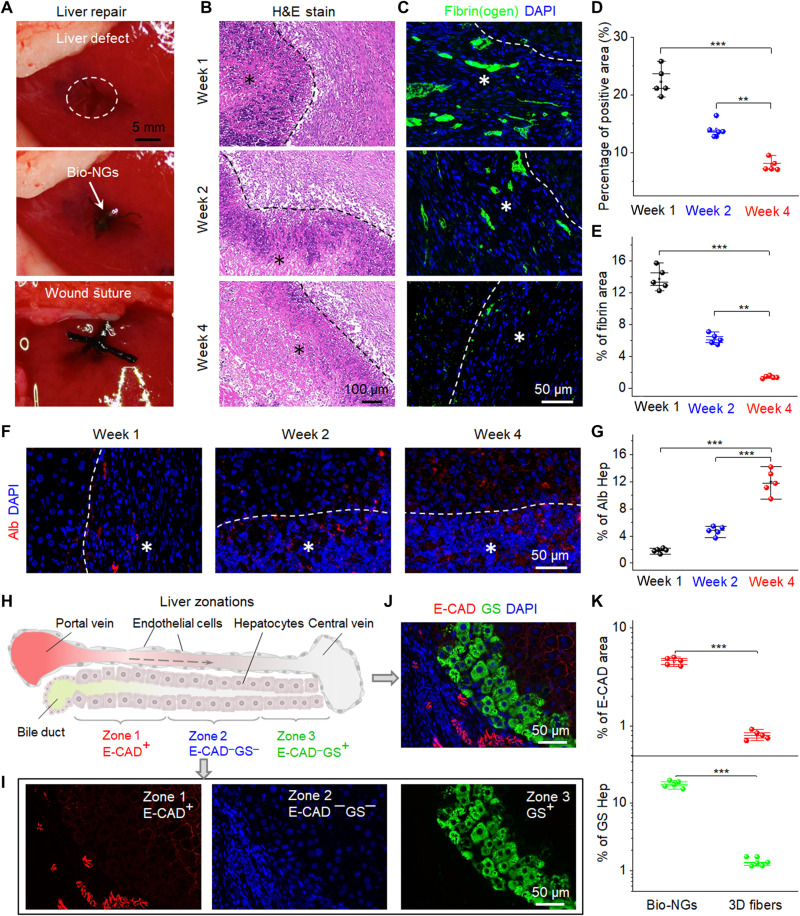
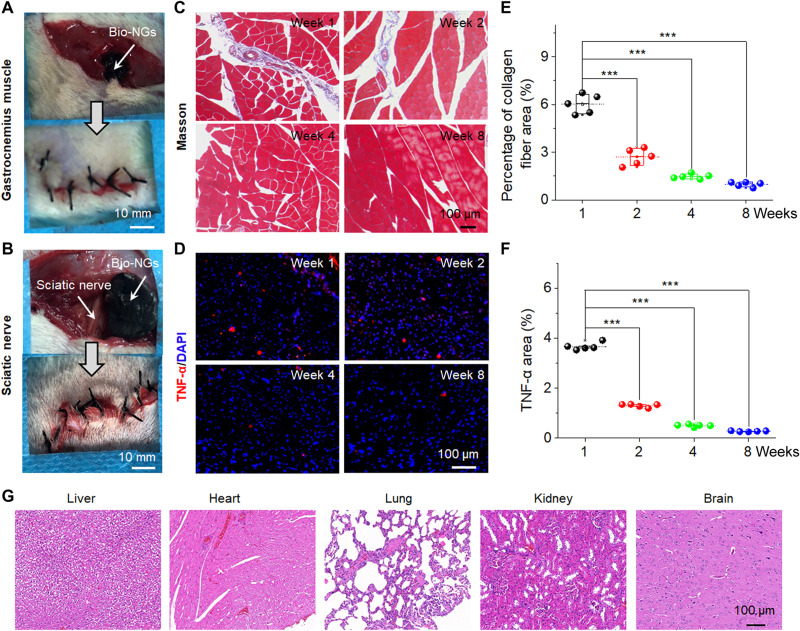
The biophysical characteristics of the extracellular matrix (ECM), such as a three-dimensional (3D) network and bioelectricity, have a profound influence on cell development, migration, function expression, etc. Here, inspired by these biophysical cues of ECM, we develop an electromechanical coupling bio-nanogenerator (bio-NG) composed of highly discrete piezoelectric fibers. It can generate surface piezopotential up to millivolts by cell inherent force and thus provide in situ electrical stimulation for the living cells. Besides, the unique 3D space in the bio-NGs provides an ECM-like growth microenvironment for cells. As a result, our bio-NGs effectively promote cell viability and development and, more importantly, maintain its specific functional expression. These advanced in vitro bio-NGs are expected to fill the gap between the inaccurate 2D systems and the expensive and time-consuming animal models, mimicking the complexity of the ECM and the physiological relevance of an in vivo biological system.


Figures

Fig. 1.
Fig. 1.. Schematic illustrations of electromechanical coupling bio-NGs modulating cell activity inspired by ECM.
(A) The collagen fibers in ECM converting the cell inherent force into bioelectricity, which also constitutes the 3D architecture of ECM. These bioelectric signals are transmitted by signal molecules filled between collagen fibers, thus, to regulate cell activity and realize the functional expression of cells. (B) Schematic diagram of the bioinspired piezoelectric fibers in bio-NGs. The interaction of cells with bio-NGs emulating this bioelectric signal in ECM induces, in response to the inherent forces produced by the cells, a local electric field that stimulates and modulates their cell activity.
Fig. 2.
Fig. 2.. Schematic representation and piezoelectric analysis of bio-NGs.
(A) Schematic diagram of the fabrication of highly discrete piezoelectric Fe3O4/PAN fibers. With the help of the neodymium iron boron magnet, Fe3O4 magnetic nanoparticles were introduced into PAN electrospun solution to break through the surface tension of water. (B) The PEDOT conductive layer was loaded with the method of in situ polymerization; GO nanosheets were adsorbed on the outermost layer of fibers by the contribution of electrostatic adsorption force to form the target GO/PEDOT/Fe3O4/PAN fibers. Transmission electron microscopy images of the single fiber obtained in every step. (C to E) Optical image and scanning electron microscopy (SEM) images of the bio-NGs. The inset of (D) shows pore size distribution and porosity. The inset of (E) shows the fiber diameter distribution range of the GO/PEDOT/Fe3O4/PAN fibers. (F) Finite element analysis simulation of piezoelectric fibers coupled with a living cell generating a maximum voltage of 141 mV when strained by a tangential force of 10 nN. (G) Piezoelectric potential generated by a single fiber as a function of the applied tangential cell force. (H) Simplified resistor-capacitor circuit created by the NG, the NG-cell interface, and the cell membrane. (I) Piezoelectric force microscopy (PFM) phase and PFM amplitude images of a single fiber in bio-NGs. (J) Phase-electric potential hysteresis and butterfly amplitude loops of fibers in bio-NGs, obtained with a DC voltage varying from −10 to 10 V. (K) Voltage outputs from the bio-NGs under the same impact force of 1 N (blue) and under a vibration at 0.7 Hz (red). The inset represented the impact (left) and vibration (right) methods used to characterize the fibers in bio-NGs. F, force. Photo credit: Chuanmei Shi, Nanjing University of Science and Technology.
Fig. 3.
Fig. 3.. Crystallinity and spatial structure stability characteristics of piezoelectric PAN-based fibers in bio-NGs.
(A) FTIR and (B) XRD spectra of the Fe3O4/PAN, PEDOT/Fe3O4/PAN, and GO/PEDOT/Fe3O4/PAN fibers. a.u., arbitrary unit. (C) The content of the zigzag conformation and Δθ (2θ − 17) values of the Fe3O4/PAN, PEDOT/Fe3O4/PAN, and GO/PEDOT/Fe3O4/PAN fibers, quantified from the FTIR and XRD spectra, respectively. (D) DSC thermograms, (E) cyclic voltammogram (CV) profiles, and (F) water contact angle of the Fe3O4/PAN, PEDOT/Fe3O4/PAN, and GO/PEDOT/Fe3O4/PAN fibers. (G) Compression rebound rate of the Fe3O4/PAN, PEDOT/Fe3O4/PAN, and GO/PEDOT/Fe3O4/PAN fibers at 5-, 7-, and 9-mm compression. (H) Stress-strain curve of bio-NGs at 90% compression. (I) Average pore size distribution and the ratio of average particle size >15 μm. All error bars indicate ±SD. Photo credit: Chuanmei Shi, Nanjing University of Science and Technology.
Fig. 4.
Fig. 4.. The growth and development of RGC5 neurons in bio-NGs.
(A) Proliferation of RGC5 neurons by the DNA assay on days 1, 3, and 5. (B) Apoptosis of RGC5 neurons after 5 days of culture in bio-NGs. (C) Neurite outgrowth of RGC5 neurons by the median neurite length after 5 days of culture in bio-NGs. (D) 3D confocal scanning of RGC5 neurons cultured on TCP, 2D NGs, and 3D fibers. (E) 3D confocal scanning of RGC5 neurons cultured in bio-NGs from different perspectives. (F) Inherent cell force of living cells grown in bio-NGs. This would induce a local electrical field proportional to the strain level that could eventually alter the membrane potential and/or the configuration of membrane receptors and results in the opening of the Ca2+ channels. Ins3P, inositol trisphosphate. PLC, phospholipase C. (G) The fluorescence images of the cells preincubated with Fluo-4 AM (membrane-permeable and Ca2+-dependent dye) on the fibers in bio-NGs and 3D fibers. Green, Ca2+. All error bars indicate ±SD.
Fig. 5.
Fig. 5.. The motility and function maintenance of primary hepatocytes in bio-NGs.
(A) Schematic diagram and light microscope images of hepatocyte movement to form cell clusters. (B) SEM images of hepatocyte aggregates. (C) Hepatocyte aggregate size and number on day 3. (D to F) Cell morphology and NG-cell interaction including cell membrane adhesion and focal contact, assessed by SEM after 15 days in culture, showed that hepatocytes were adhered to fibers in bio-NGs. (G) SEM image showing the information exchange between cell aggregates. (H) Laser scanning confocal microscopy images of epithelial cadherin (green) detection showing the cellular information exchange within cell aggregates. (I) MTT assay showing no signs of toxicity for cells cultured in bio-NGs. Hepatic function assessment: (J) Albumin (Alb) secretion and (K) urea synthesis at different culture time points. The metabolic functions of hepatocytes: (L) 3-cyano-7-hydroxycoumarin (CHC) and (M) 4-methylumbelliferyl glucuronide (4-MUG) production at different culture time points. All error bars indicate ±SD. n = 3. *P < 0.05 and **P < 0.01.
Fig. 6.
Fig. 6.. Liver repair promotion by bio-NGs in vivo.
(A) Surgical images showing the implantation of the bio-NGs into the liver defect. (B) H&E staining of the liver sections at different time points (weeks 1, 2, and 4) after implantation. (C) Representative images of hepatic fibrin(ogen) immunostaining (green) in 4′,6-diamidino-2-phenylindole (DAPI) (blue)–counterstained liver sections at the implanted area. (D) Average percentage of the positive area measured from H&E staining. (E) Quantification of hepatic fibrin immunofluorescent labeling. (F) Immunostaining for Alb (red) on liver sections at different time points (weeks 1, 2, and 4) after implantation. (G) Alb expression level measured from Alb immunostaining. (H) Schematic showing three liver zones from the periportal to the pericentral region. 1, 2, and 3 indicate zone 1 (E-CAD+), zone 2 (E-CADGS), and zone 3 (GS+), respectively. The dashed arrow indicates blood flow. (I and J) Immunostaining for GS (green) and E-CAD (red) on liver sections at the fourth week after implantation. (K) Quantification of GS and E-CAD showing stronger expression of liver function of new hepatocytes in bio-NGs than that of 3D fibers. Hep, hepatocyte. Asterisks (*) show locations of the implantation. Data are expressed as mean values ± SD. n = 5. **P < 0.01 and ***P < 0.001. Photo credit: Fei Jin, Nanjing University of Science and Technology.
Fig. 7.
Fig. 7.. In vivo stability and biocompatibility of bio-NGs.
Surgical image showing the implantation of the bio-NGs into the (A) gastrocnemius muscle and (B) sciatic nerve areas of a mouse. (C) Masson trichrome staining of gastrocnemius muscles at the implanted area. (D) TNF-α immunofluorescent staining of sciatic nerve at the implanted area. (E) Average percentage of collagen fibers in the muscle tissue measured from Masson staining. (F) Relative TNF-α expression level measured from TNF-α immunofluorescent staining. (G) H&E staining of vital organs (liver, heart, lung, kidney, and brain) at week 8 after implantation in the sciatic nerve area. Data are expressed as mean values ± SD. n = 5. ***P < 0.001. Photo credit: Tong Li, Nanjing University of Science and Technology.

References

    1. Thrivikraman G., Boda S. K., Basu B., Unraveling the mechanistic effects of electric field stimulation towards directing stem cell fate and function: A tissue engineering perspective. Biomaterials 150, 60–86 (2018). - PubMed
    1. Ruan J. L., Tulloch N. L., Razumova M. V., Saiget M., Muskheli V., Pabon L., Reinecke H., Regnier M., Murry C. E., Mechanical stress conditioning and electrical stimulation promote contractility and force maturation of induced pluripotent stem cell-derived human cardiac tissue. Circulation 134, 1557–1567 (2016). - PMC - PubMed
    1. Feng Z. Q., Wang T., Zhao B., Li J., Jin L., Soft graphene nanofibers designed for the acceleration of nerve growth and development. Adv. Mater. 27, 6462–6468 (2015). - PubMed
    1. Zheng Q., Tang Q., Wang Z. L., Li Z., Self-powered cardiovascular electronic devices and systems. Nat. Rev. Cardiol. 18, 7–21 (2021). - PubMed
    1. Mendes P. M., Cellular nanotechnology: Making biological interfaces smarter. Chem. Soc. Rev. 42, 9207–9218 (2013). - PMC - PubMed