

Census tract socioeconomic indicators and COVID-19-associated hospitalization rates-COVID-NET surveillance areas in 14 states, March 1-April 30, 2020
- PMID: 34559838
- PMCID: PMC8462704
- DOI: 10.1371/journal.pone.0257622
Census tract socioeconomic indicators and COVID-19-associated hospitalization rates-COVID-NET surveillance areas in 14 states, March 1-April 30, 2020
Abstract
Objectives: Some studies suggested more COVID-19-associated hospitalizations among racial and ethnic minorities. To inform public health practice, the COVID-19-associated Hospitalization Surveillance Network (COVID-NET) quantified associations between race/ethnicity, census tract socioeconomic indicators, and COVID-19-associated hospitalization rates.
Methods: Using data from COVID-NET population-based surveillance reported during March 1-April 30, 2020 along with socioeconomic and denominator data from the US Census Bureau, we calculated COVID-19-associated hospitalization rates by racial/ethnic and census tract-level socioeconomic strata.
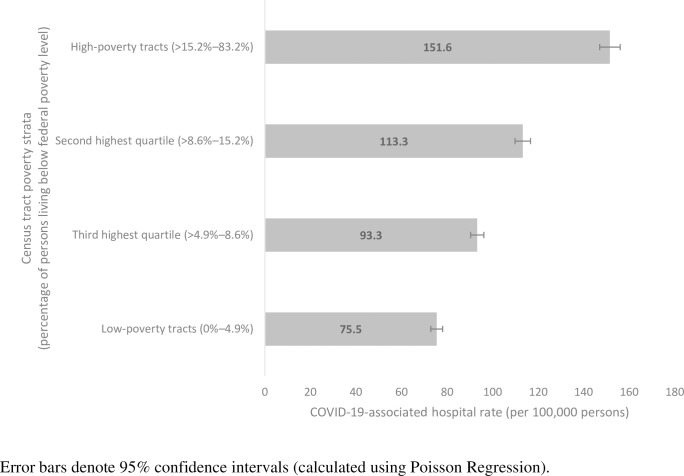
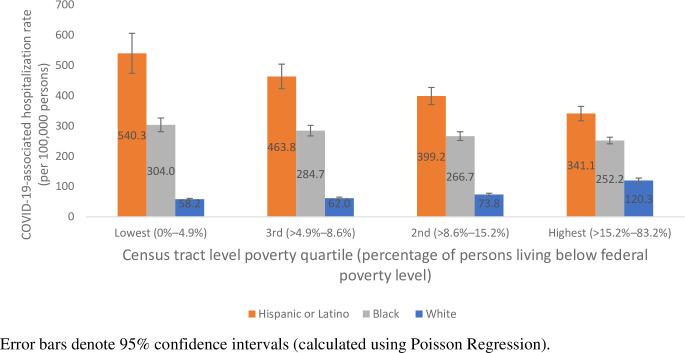
Results: Among 16,000 COVID-19-associated hospitalizations, 34.8% occurred among non-Hispanic White (White) persons, 36.3% among non-Hispanic Black (Black) persons, and 18.2% among Hispanic or Latino (Hispanic) persons. Age-adjusted COVID-19-associated hospitalization rate were 151.6 (95% Confidence Interval (CI): 147.1-156.1) in census tracts with >15.2%-83.2% of persons living below the federal poverty level (high-poverty census tracts) and 75.5 (95% CI: 72.9-78.1) in census tracts with 0%-4.9% of persons living below the federal poverty level (low-poverty census tracts). Among White, Black, and Hispanic persons living in high-poverty census tracts, age-adjusted hospitalization rates were 120.3 (95% CI: 112.3-128.2), 252.2 (95% CI: 241.4-263.0), and 341.1 (95% CI: 317.3-365.0), respectively, compared with 58.2 (95% CI: 55.4-61.1), 304.0 (95%: 282.4-325.6), and 540.3 (95% CI: 477.0-603.6), respectively, in low-poverty census tracts.
Conclusions: Overall, COVID-19-associated hospitalization rates were highest in high-poverty census tracts, but rates among Black and Hispanic persons were high regardless of poverty level. Public health practitioners must ensure mitigation measures and vaccination campaigns address needs of racial/ethnic minority groups and people living in high-poverty census tracts.
Conflict of interest statement
Dr. Anderson reports consulting for AbbVie, Pfizer, and Sanofi-Pasteur and clinical trials research funding from MedImmune, Regeneron, PaxVax, Pfizer, GSK, Merck, Novavax, Sanofi Pasteur, Micron, and Janssen. He also works on a safety monitoring board for Kentucky Bioprocessing, Inc. All are outside of the submitted work. No other disclosures were reported. Nonetheless, this does not alter our adherence to PLOS ONE policies on sharing data and materials.
Figures

References
-
- Johns Hopkins University & Medicine. COVID-19 Dashboard [Cited 10 November 2020]. In: COVID-19 Dashboard [Internet]. Baltimore, MD: Johns Hopkins University, 2020 -. Available from: https://coronavirus.jhu.edu/map.html.
-
- CDC. COVID Data Tracker: Trends in Number of COVID-19 Cases and Deaths in the US Reported to CDC by State/Territory [cited 12 August 2021]. In: COVID Data Tracker [Internet]. Atlanta, Georgia: US Department of Health and Human Services, CDC 2020 -. Available from: https://covid.cdc.gov/covid-data-tracker/#trends_dailytrendscases.
Publication types
MeSH terms
LinkOut - more resources
Full Text Sources
Medical
Miscellaneous
