. 2021 Oct;297(4):101224.
doi: 10.1016/j.jbc.2021.101224. Epub 2021 Sep 22.

Mitochondrial respiratory chain function promotes extracellular matrix integrity in cartilage

Affiliations

Mitochondrial respiratory chain function promotes extracellular matrix integrity in cartilage

Kristina Bubb et al. J Biol Chem. 2021 Oct.

Abstract

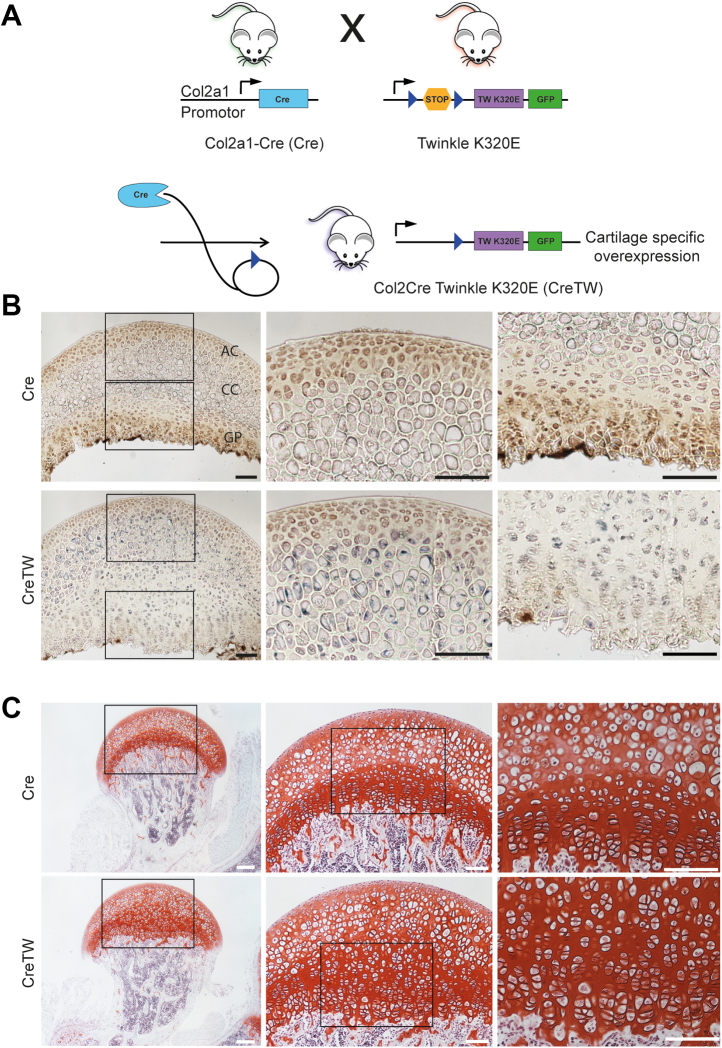
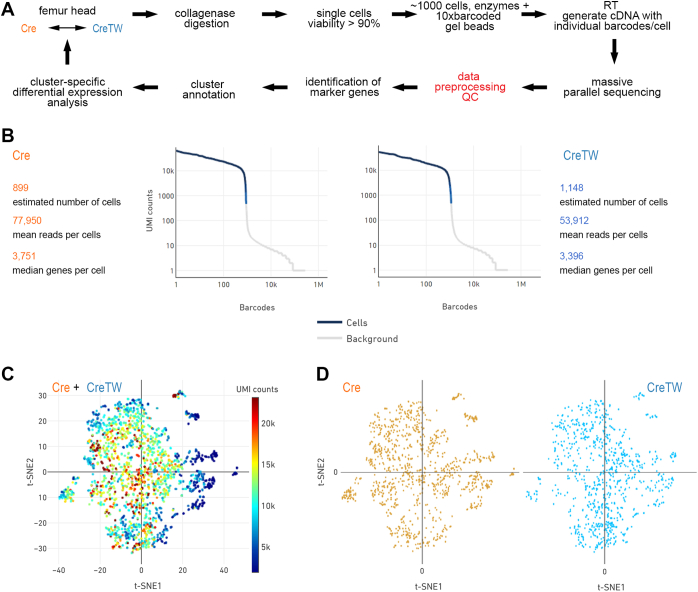
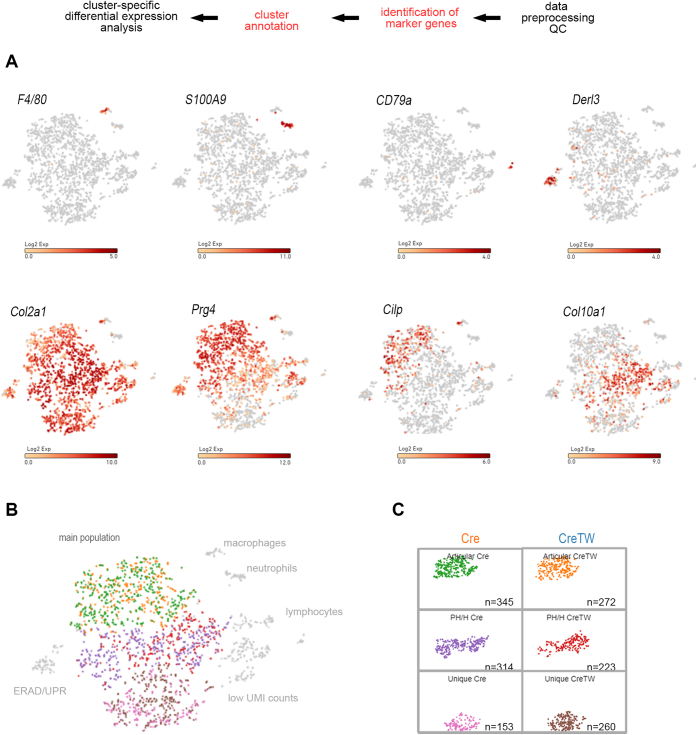
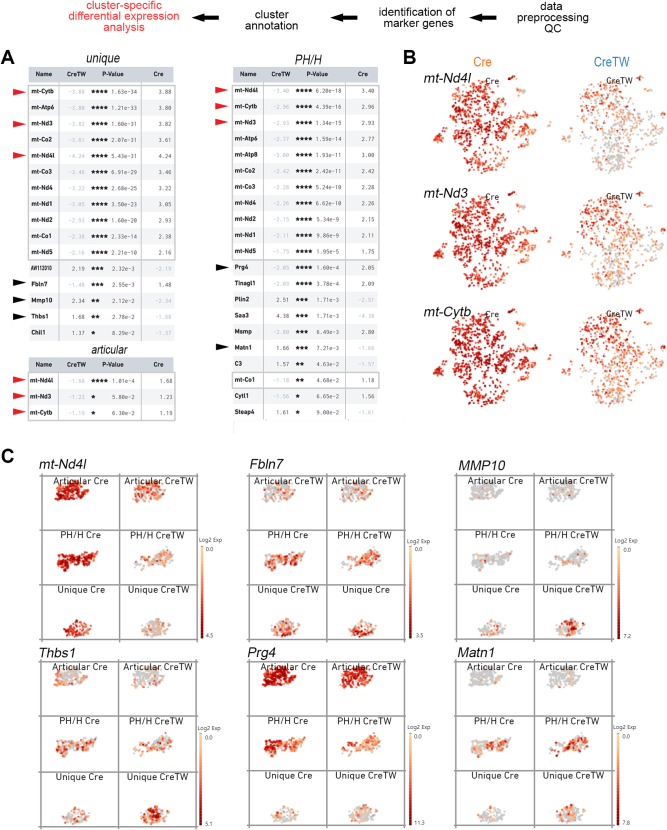
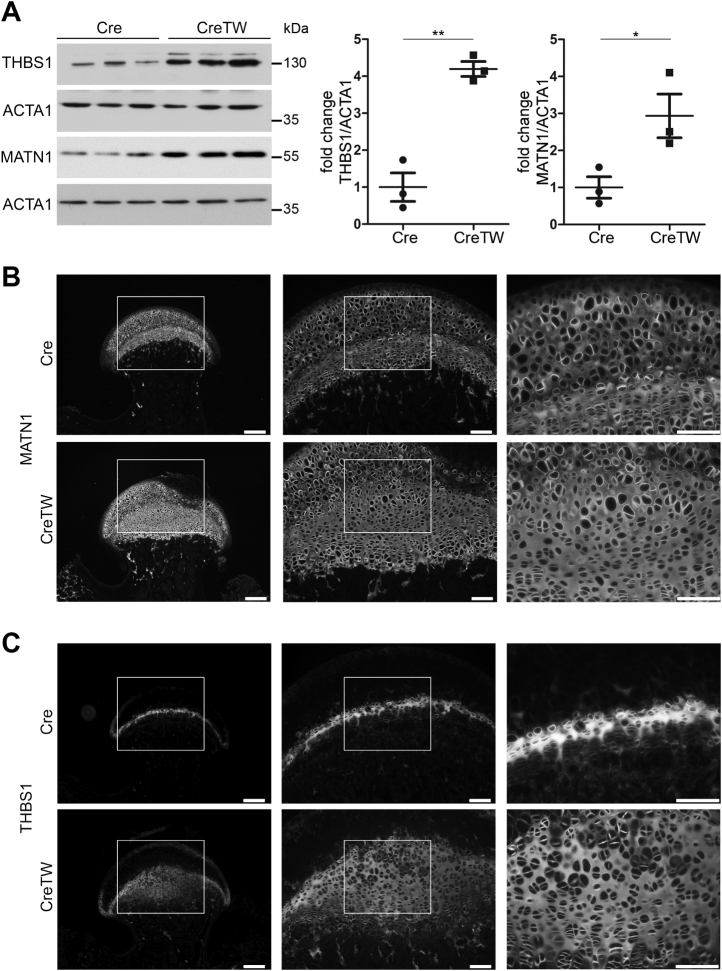
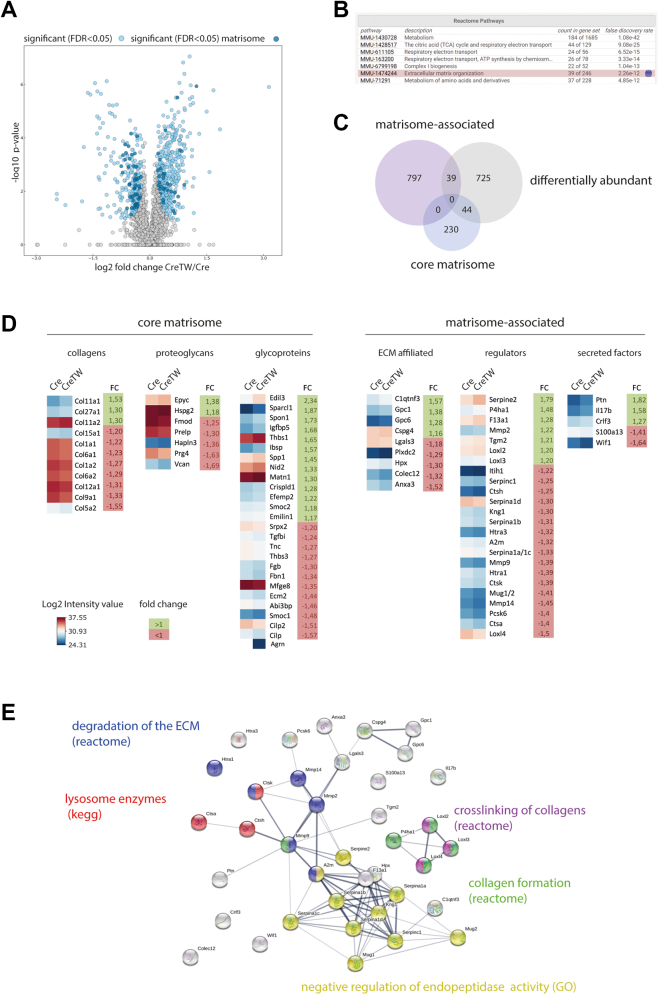
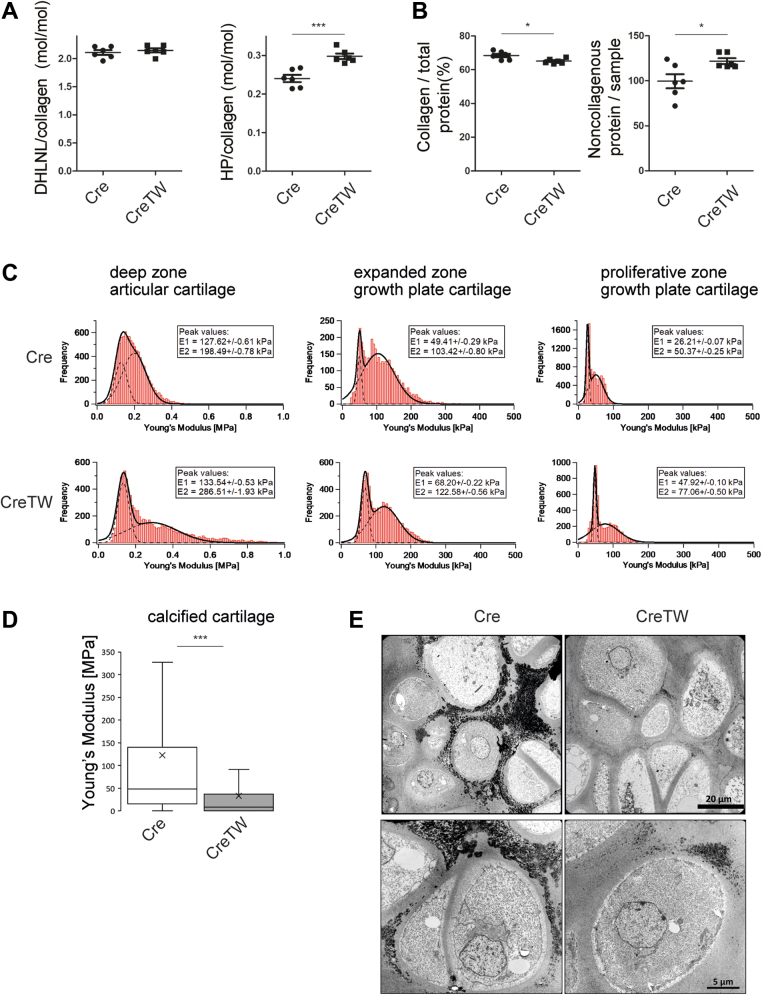
Energy metabolism and extracellular matrix (ECM) function together orchestrate and maintain tissue organization, but crosstalk between these processes is poorly understood. Here, we used single-cell RNA-Seq (scRNA-Seq) analysis to uncover the importance of the mitochondrial respiratory chain for ECM homeostasis in mature cartilage. This tissue produces large amounts of a specialized ECM to promote skeletal growth during development and maintain mobility throughout life. A combined approach of high-resolution scRNA-Seq, mass spectrometry/matrisome analysis, and atomic force microscopy was applied to mutant mice with cartilage-specific inactivation of respiratory chain function. This genetic inhibition in cartilage results in the expansion of a central area of 1-month-old mouse femur head cartilage, showing disorganized chondrocytes and increased deposition of ECM material. scRNA-Seq analysis identified a cell cluster-specific decrease in mitochondrial DNA-encoded respiratory chain genes and a unique regulation of ECM-related genes in nonarticular chondrocytes. These changes were associated with alterations in ECM composition, a shift in collagen/noncollagen protein content, and an increase of collagen crosslinking and ECM stiffness. These results demonstrate that mitochondrial respiratory chain dysfunction is a key factor that can promote ECM integrity and mechanostability in cartilage and presumably also in many other tissues.

Keywords: MMP10; THBS1; atomic force microscopy; extracellular matrix; matrisome; matrix metalloproteinase; mitochondria; mitochondrial respiratory chain; single-cell RNA-Seq; transcriptomics.


Conflict of interest statement

Conflict of interest The authors declare that they have no conflicts of interest with the contents of this article.

Figures

Figure 1
Figure 1
Characterization of mitochondrial respiratory chain activity and histomorphology in PFE cartilage isolated from 1-month-old Cre or CreTW mice.A, generation of mice with a cartilage-specific expression of mutated Twinkle helicase (K320E) using the Cre/loxP system. Mice expressing Cre recombinase driven by the Col2a1 promotor (blue, Cre) were crossed with R26-K320E-Twinkle mice to generate offspring with a removal of a stop cassette (circle) in the Rosa26 locus to induce the expression of the twinkle mutant K320E (violet) and GFP (green) only in cartilage (CreTW). Lox site (triangle, dark blue) (B) CYTOCOX (brown), and SDH activity (blue) activity staining on PFE sections of 1-month-old Cre or CreTW mice. Overview and close-up views of the articular (AC), calcified (CC) (center), and growth plate cartilage (GP) (right) are shown. Bars represent 100 μm. C, overview and close-up views of safranin O–stained PFE sections from 1-month-old Cre or CreTW mice. Squares within the overview images represent areas magnified in the close ups. Bars represent 200 μm (overview), 100 μm (close ups). PFE, proximal femoral epiphysis; SDH, succinate dehydrogenase.
Figure 2
Figure 2
Single-cell RNA-Seq analysis of chondrocytes isolated from PFE cartilage of Cre and CreTW mice.A, experimental workflow of scRNA-Seq analysis. B, summary of cell numbers, reads, identified genes, and count of filtered UMIs mapped to each barcode per genotype (barcode rank plots). C and D, PCA-based t-distributed stochastic neighbor embedding (t-SNE) plot of merged (C) and single datasets of Cre- and CreTW-derived cells (D). Colors indicate UMI counts (C) or genotype (D). PCA, principal component analysis; PFE, proximal femoral epiphysis; UMI, unique molecular identifier.
Figure 3
Figure 3
Marker gene–based identification of cell clusters.A, expression of cell type–specific marker genes was used to annotate individual cell clusters. Log2 expression intensity values of individual cells are indicated (color scale). B, the Col2a1+ main population was identified, and subpopulations of articular (Cre—green, CreTW—orange), prehypertrophic/hypertrophic (Cre—purple, CreTW—red), and unique chondrocytes (Cre—pink, CreTW—brown) are highlighted. Cells with low UMI counts and noncartilaginous cells were excluded from the analysis. C, cluster-specific cell numbers within the Col2a1+ main subpopulation of Cre and CreTW mice are shown in split t-SNE plots. t-SNE, t-distributed stochastic neighbor embedding; UMI, unique molecular identifier.
Figure 4
Figure 4
Identification of genes regulated between chondrocyte subpopulations of Cre and CreTW mice.A, the transcriptome was compared between articular, prehypertrophic/hypertrophic, and unique subpopulation of PFE cartilage from 1-month-old mice using Loupe software. Regulated mtDNA-encoded genes are marked (square). mtDNA-encoded genes commonly regulated in all subpopulations (red arrowhead), and ECM-related genes are depicted (black arrowheads). B, Log2 expression intensities of regulated mtDNA-encoded genes are indicated (color) in t-SNE plots of single cells from Cre or CreTW mice. C, subpopulation-specific log2 expression values are given (color) in split t-SNE plots of single cells for the mtDNA-encoded mt-Nd4l gene and the nuclear-encoded ECM-related genes. ECM, extracellular matrix; mtDNA, mitochondrial DNA; PFE, proximal femoral epiphysis; t-SNE, t-distributed stochastic neighbor embedding.
Figure 5
Figure 5
Characterization of THBS1 and MATN1 abundance and localization in PFE cartilage of Cre and CreTW mice.A, THBS1 and MATN1 protein levels in cartilage extracts from 1-month-old Cre and CreTW mice were determined by immunoblotting. The fold change in protein levels in CreTW extracts compared with Cre lysates normalized to actin (ACTA1) was determined (graph). B and C, protein distribution of MATN1 (B) and THBS1 (C) in sections of PFE cartilage from 1-month-old Cre and CreTW mice was studied by immunofluorescence microscopy. Brightness was increased for visualization. The bar represents 100 μm. The brightness was adjusted for visualization. MATN1 matrilin-1; PFE, proximal femoral epiphysis; THBS1, thrombospondin 1.
Figure 6
Figure 6
Matrisome analysis of PFE cartilage from 1-month-old Cre and CreTW mice.A, volcano plot analysis of the proteome illustrating significant differences (blue, significant matrisome—dark blue) between PFE cartilage of Cre and CreTW mice (permutation-based FDR cutoff = 0.05, n = 4 biological replicates). Four individual proteomes per genotype were measured and analyzed. About 808 regulated entities were identified, including protein annotations of nonuniquely assigned peptides. B, reactome enrichment analysis of differentially abundant proteins. C, numbers of regulated core matrisome and matrisome-associated entities are determined in a Venn diagram. D, fold change and log2 intensity values between Cre and CreTW mice are shown. E, STRING analysis of matrisome-associated regulated entities using Reactome, KEGG, and GO-term pathways. FDR, false discovery rate; GO, Gene Ontology; KEGG, Kyoto Encyclopedia of Genes and Genomes; PFE, proximal femoral epiphysis.
Figure 7
Figure 7
Characterization of collagen crosslink formation and ultrastructural organization in PFE cartilage of 1-month-old Cre and CreTW mice.A, the difunctional crosslink dihydroxylysinonorleucine (DHLNL) and the trifunctional maturation product hydroxylysylpyridinoline (HP) in collagens and the (B) collagenous and noncollagenous protein content was determined by amino acid analysis (n = 6 independent biological replicates per genotype). C, distributions of Young's modulus values obtained by nanoindentation atomic force microscopy of native (unfixed) sections from PFE cartilage (n = 3). Solid line—bimodal Gaussian fit to the data (sum of two Gaussian functions); dashed lines—the two Gaussian functions of the bimodal fit representing the proteoglycan (first peak) and the collagen fibril moieties (second peak). The insets give the Young's modulus values and standard errors of the first (E1) and second peaks (E2). D, box plot showing median (solid line) and mean (cross), 25/75% quartile (box) of Young's modulus in the calcified cartilage of Cre and CreTW mice. E, ultrastructural analysis of the calcified cartilage. Electron dense hydroxyapatite containing matrix is detected (black). Overviews (top) and close ups (bottom) are shown. PFE, proximal femoral epiphysis.

References

    1. Romani P., Valcarcel-Jimenez L., Frezza C., Dupont S. Crosstalk between mechanotransduction and metabolism. Nat. Rev. Mol. Cell Biol. 2021;22:22–38. - PubMed
    1. Weiland D., Brachvogel B., Hornig-Do H.T., Neuhaus J.F.G., Holzer T., Tobin D.J., Niessen C.M., Wiesner R.J., Baris O.R. Imbalance of mitochondrial respiratory chain complexes in the epidermis induces severe skin inflammation. J. Invest. Dermatol. 2018;138:132–140. - PubMed
    1. Baris O.R., Ederer S., Neuhaus J.F., von Kleist-Retzow J.C., Wunderlich C.M., Pal M., Wunderlich F.T., Peeva V., Zsurka G., Kunz W.S., Hickethier T., Bunck A.C., Stockigt F., Schrickel J.W., Wiesner R.J. Mosaic deficiency in mitochondrial oxidative metabolism promotes cardiac arrhythmia during aging. Cell Metab. 2015;21:667–677. - PubMed
    1. Ovchinnikov D.A., Deng J.M., Ogunrinu G., Behringer R.R. Col2a1-directed expression of Cre recombinase in differentiating chondrocytes in transgenic mice. Genesis. 2000;26:145–146. - PubMed
    1. Bluhm B., Ehlen H.W.A., Holzer T., Georgieva V.S., Heilig J., Pitzler L., Etich J., Bortecen T., Frie C., Probst K., Niehoff A., Belluoccio D., Van den Bergen J., Brachvogel B. miR-322 stabilizes MEK1 expression to inhibit RAF/MEK/ERK pathway activation in cartilage. Development. 2017;144:3562–3577. - PubMed

Publication types