

Vertex-wise multivariate genome-wide association study identifies 780 unique genetic loci associated with cortical morphology
- PMID: 34560273
- PMCID: PMC8785963
- DOI: 10.1016/j.neuroimage.2021.118603
Vertex-wise multivariate genome-wide association study identifies 780 unique genetic loci associated with cortical morphology
Abstract
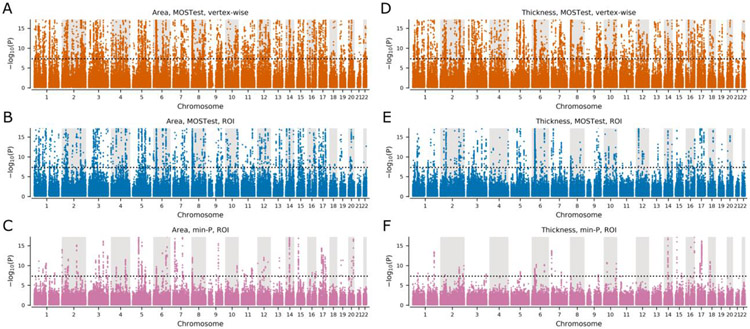
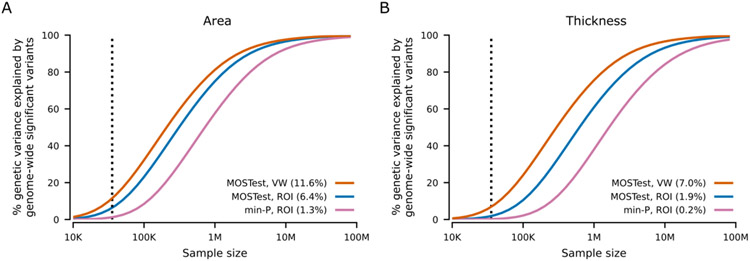
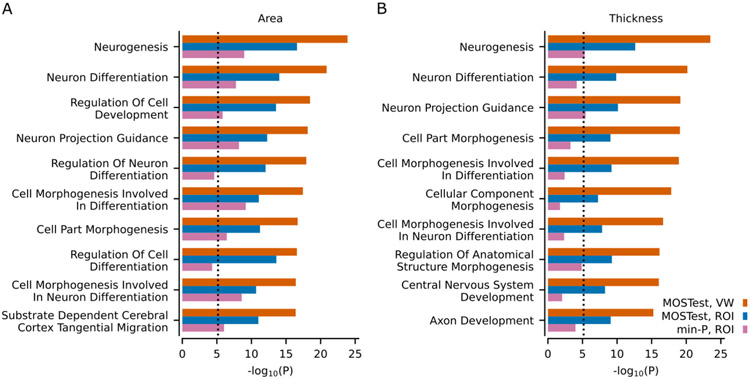
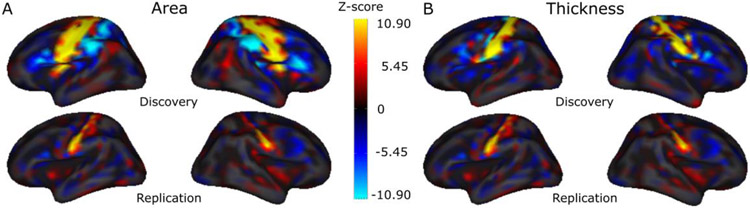
Brain morphology has been shown to be highly heritable, yet only a small portion of the heritability is explained by the genetic variants discovered so far. Here we extended the Multivariate Omnibus Statistical Test (MOSTest) and applied it to genome-wide association studies (GWAS) of vertex-wise structural magnetic resonance imaging (MRI) cortical measures from N=35,657 participants in the UK Biobank. We identified 695 loci for cortical surface area and 539 for cortical thickness, in total 780 unique genetic loci associated with cortical morphology robustly replicated in 8,060 children of mixed ethnicity from the Adolescent Brain Cognitive Development (ABCD) Study®. This reflects more than 8-fold increase in genetic discovery at no cost to generalizability compared to the commonly used univariate GWAS methods applied to region of interest (ROI) data. Functional follow up including gene-based analyses implicated 10% of all protein-coding genes and pointed towards pathways involved in neurogenesis and cell differentiation. Power analysis indicated that applying the MOSTest to vertex-wise structural MRI data triples the effective sample size compared to conventional univariate GWAS approaches. The large boost in power obtained with the vertex-wise MOSTest together with pronounced replication rates and highlighted biologically meaningful pathways underscores the advantage of multivariate approaches in the context of highly distributed polygenic architecture of the human brain.
Keywords: Cortical surface area; Cortical thickness; Distributed polygenic architecture; Genome-wide association study; Multivariate vertex-wise analysis.
Copyright © 2021 The Authors. Published by Elsevier Inc. All rights reserved.
Conflict of interest statement
Declaration of Competing Interest Dr. Andreassen has received speaker's honorarium from Lundbeck, and is a consultant to HealthLytix. Dr. Dale is a Founder of and holds equity in CorTechs Labs, Inc, and serves on its Scientific Advisory Board. He is a member of the Scientific Advisory Board of Human Longevity, Inc. and receives funding through research agreements with General Electric Healthcare and Medtronic, Inc. The terms of these arrangements have been reviewed and approved by UCSD in accordance with its conflict of interest policies. The other authors declare no competing interests.
Figures
References
-
- Eyler LT, Chen CH, Panizzon MS, Fennema-Notestine C, Neale MC, Jak A, Jernigan TL, Fischl B, Franz CE, Lyons MJ, et al. (2012). A comparison of heritability maps of cortical surface area and thickness and the influence of adjustment for whole brain measures: a magnetic resonance imaging twin study. Twin Res Hum Genet 15, 304–314. - PMC - PubMed
-
- van der Meer D, Frei O, Kaufmann T, Chen CH, Thompson WK, O'Connell KS, Monereo Sanchez J, Linden DEJ, Westlye LT, Dale AM, et al. (2020). Quantifying the Polygenic Architecture of the Human Cerebral Cortex: Extensive Genetic Overlap between Cortical Thickness and Surface Area. Cereb Cortex 30, 5597–5603. - PMC - PubMed
Publication types
MeSH terms
Grants and funding
- R01 MH100351/MH/NIMH NIH HHS/United States
- U24 DA041147/DA/NIDA NIH HHS/United States
- U01 DA051039/DA/NIDA NIH HHS/United States
- U01 DA041120/DA/NIDA NIH HHS/United States
- R01 GM104400/GM/NIGMS NIH HHS/United States
- U24 DA041123/DA/NIDA NIH HHS/United States
- U01 DA051038/DA/NIDA NIH HHS/United States
- U01 DA041156/DA/NIDA NIH HHS/United States
- U01 DA041106/DA/NIDA NIH HHS/United States
- U01 DA041117/DA/NIDA NIH HHS/United States
- U01 DA041148/DA/NIDA NIH HHS/United States
- MC_PC_17228/MRC_/Medical Research Council/United Kingdom
- U01 DA041174/DA/NIDA NIH HHS/United States
- MC_QA137853/MRC_/Medical Research Council/United Kingdom
- U01 DA041093/DA/NIDA NIH HHS/United States
- U01 DA041134/DA/NIDA NIH HHS/United States
- U01 DA041022/DA/NIDA NIH HHS/United States
- U01 DA041025/DA/NIDA NIH HHS/United States
- U01 DA050989/DA/NIDA NIH HHS/United States
- U01 DA041089/DA/NIDA NIH HHS/United States
- U01 DA050988/DA/NIDA NIH HHS/United States
- U01 DA041028/DA/NIDA NIH HHS/United States
- U01 DA041048/DA/NIDA NIH HHS/United States
