. 2021 Sep 24;19(1):214.
doi: 10.1186/s12915-021-01140-y.

Large-scale data analysis for robotic yeast one-hybrid platforms and multi-disciplinary studies using GateMultiplex

Affiliations

Large-scale data analysis for robotic yeast one-hybrid platforms and multi-disciplinary studies using GateMultiplex

Ni-Chiao Tsai et al. BMC Biol. .

Abstract

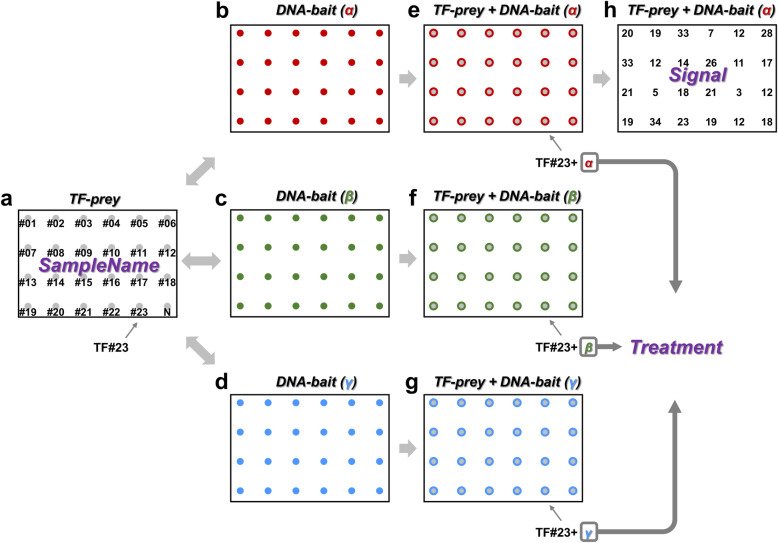
Background: Yeast one-hybrid (Y1H) is a common technique for identifying DNA-protein interactions, and robotic platforms have been developed for high-throughput analyses to unravel the gene regulatory networks in many organisms. Use of these high-throughput techniques has led to the generation of increasingly large datasets, and several software packages have been developed to analyze such data. We previously established the currently most efficient Y1H system, meiosis-directed Y1H; however, the available software tools were not designed for processing the additional parameters suggested by meiosis-directed Y1H to avoid false positives and required programming skills for operation.

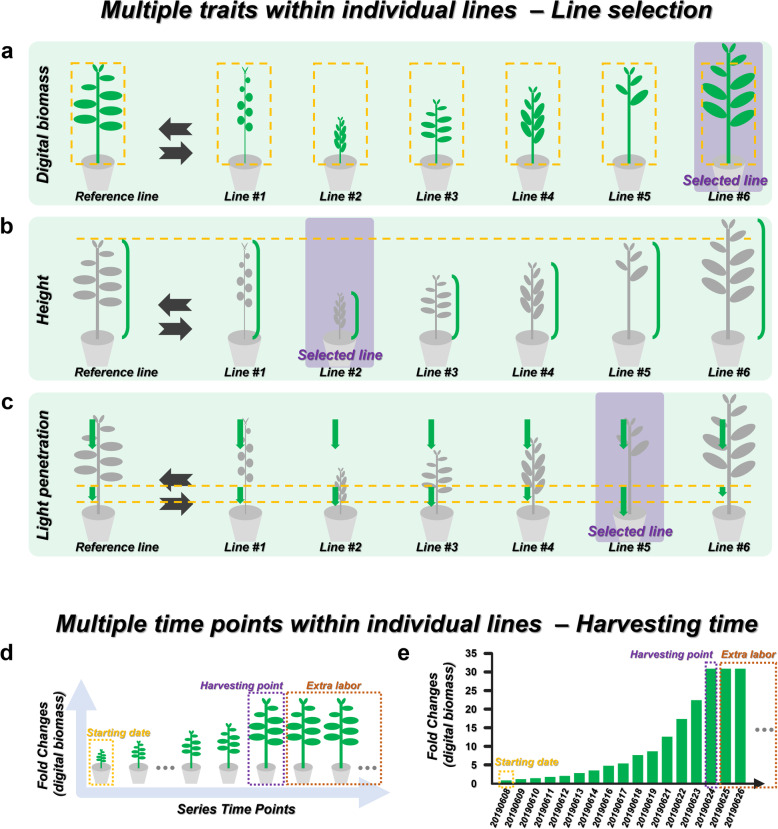
Results: We developed a new tool named GateMultiplex with high computing performance using C++. GateMultiplex incorporated a graphical user interface (GUI), which allows the operation without any programming skills. Flexible parameter options were designed for multiple experimental purposes to enable the application of GateMultiplex even beyond Y1H platforms. We further demonstrated the data analysis from other three fields using GateMultiplex, the identification of lead compounds in preclinical cancer drug discovery, the crop line selection in precision agriculture, and the ocean pollution detection from deep-sea fishery.

Conclusions: The user-friendly GUI, fast C++ computing speed, flexible parameter setting, and applicability of GateMultiplex facilitate the feasibility of large-scale data analysis in life science fields.

Keywords: C++; Deep-sea fishery; Precision agriculture; Preclinical drug discovery; Yeast one-hybrid.


Conflict of interest statement

The authors declare that they have no competing interests.

Figures

Fig. 1
Fig. 1
Large-scale analysis. a Take a 384-format plate with quantified yeast colony sizes for example, this plate could be a result from the screening of a 383 TF-prey batch (from green, yellow, red, to purple) with a negative control/reference (blue) against a DNA-bait. The numbers on the plate represent the size values of each colony for the TF-prey batch against the DNA-bait. The value of each TF-DNA combination would be compared to the reference value. If the value of a TF-DNA combination is higher than the reference value, the TF-prey would be regarded as a positive, such as the 1st TF. On the opposite, when the value of a TF-DNA combination is lower than the reference value, the TF-prey would be interpreted as a negative, such as the 383th TF. The TF-DNA combinations can be increased into b multiple TF-prey batches against multiple DNA-baits (from i to iii). c Multiple TF-prey batches against multiple DNA-baits can be integrated with different parameters, such as different culturing days to generate dramatically increased numbers of colony size values
Fig. 2
Fig. 2
SampleName, Treatment and Signal. a An Y1H screening example of a simple TF-prey batch containing 23 TF-preys (named from TF#01 to TF#23) and 1 negative control (shown as N in this figure). The TF name and the N are defined as “SampleName”. bg The TF-prey batch would be mated with b DNA-bait(α), c DNA-bait(β), and d DNA-bait(γ), which would respectively result in the yeast cells with both e TF-prey and DNA-bait(α), f TF-prey and DNA-bait(β), and (g) TF-prey and DNA-bait(γ). DNA-bait is defined as “Treatment,” and different DNA-baits represent different “Treatment” types. h The yeast cells would grow into colonies and be further quantified into colony size values as “Signal”
Fig. 3
Fig. 3
Graphical user interface (GUI). a The diagram of the GUI of GM_Basic (see Additional file 2 for the exact appearance of GUIs). The GUI contains three main areas, including the input file information, the cutoff setting and the output file selection. The input file information area is used to identify “SampleName,” “Treatment,” and “Signal” from the input files. The cutoff setting area includes background noise cutoff, reference cutoff, bio-replicate cutoff, and tech-replicate cutoff. The output file selection area offers two kinds of output files, the result file, and the fold-change file. The input file information area and the cutoff setting area were designed with clicking buttons (colored in blue). The output file selection area was designed with drop-down lists to provide on or off options. When the buttons are clicked, b–d the corresponding windows would pop up. Three pop-up windows are shown here as examples, including (b) the “SampleName” window, (c) the “Treatment” window, and (d) the reference cutoff setting window. The required information can be selected in (b) the “SampleName” window and (c) the “Treatment” window. d In reference cutoff setting window, dialog boxes (colored in yellow) are used for entering required numbers or words. After inputting all required information into GUI, pressing the “GO!” button (a) would start the data analyzing process
Fig. 4
Fig. 4
Background noise cutoff. a The colonies were transferred onto the selection plate and further quantified on different culturing day, including day 0, b day 1, c day 4, and d day 7. During (a) the pinning process, the transferred cell amount of each yeast colony would not be exactly the same. The numbers above the colonies represent the colony size. In this case, all colony sizes are smaller than 20, and thus 20 is used as the cutoff for background noise. If a colony is not larger than cutoff value 20, the signal from this colony would be regarded as the signal from background noise. For example, the colony signal with size 7 on a day 0 would be interpreted as the background noise as well as on b day 1 (size 11), and c day 4 (size 15). d On day 7, the colony signal increased to 31, larger than the cutoff value 20 and would no longer be regarded as the background noise
Fig. 5
Fig. 5
Reference cutoff. a One TF-DNA combination would be composed of 4 biological replicates (from bio-rep#1 to bio-rep#4). Each biological replicate is composed of 4 technical replicate colonies (from tech-rep#1 to tech-rep#4), resulting in 16 replicate colonies. b The 16 colonies in pink dashed frames belong to an experimental sample, and the other 16 colonies in blue dashed frames represent the reference sample. Through the black-and-white image, the size of each colony can be quantified. c The 16 colonies of reference were ranked based on the sizes. The size range from the 5th to the 12th (in blue background) were averaged. d The averaged value was defined as 1, and the fold-change value was set as 2 folds of the averaged value. As a result, reference cutoff includes the averaging ranges of the reference and the fold-change values. If the relative size of one experimental colony is larger than the cutoff value 2, then the colony would be regarded as a positive. If not, then the colony would be regarded as a negative.
Fig. 6
Fig. 6
Biological and technical replicate cutoff. A TF-DNA combination contains 16 colonies as their biological and technical replicates. The 16 replicates would be processed into positives or negatives. Positive and negative replicates are shown as gray dots and empties, respectively. If biological and technical replicate cutoff is set as 8 replicates. The TF-DNA combination with more than or equal to 8 positive replicates would be identified as a positive TF-DNA interaction event. For examples, 4Bio-16Tech (as 16 positive technical replicates from 4 biological replicates), 4Bio-12Tech, 3Bio-12Tech, and 2Bio-08Tech represent the positive TF-DNA interaction events. Instead, the TF-DNA combination with less than 8 positive replicates would be regarded as a negative interaction event, such as 2Bio-07Tech, 1Bio-04Tech, 4Bio-04Tech, and 0Bio-00Tech
Fig. 7
Fig. 7
GateMultiplex workflow. In general, the workflow of GateMultiplex includes five steps. (Step1) The operation of the graphical user interface. (Step2) The identification of required information from the input files. (Step3-4) Different cutoff value settings. (Step5) The generation of result files
Fig. 8
Fig. 8
Preclinical lead compound identification. The process of lead compound identification includes three phases, single-dose screening, serial dose screening, and potential compound validation. In single-dose screening phase, cells are automatically seeded into each well on the plates. The 9 different compounds (compound B1 to B9 colored from red to pink) would be used to treat the cells. The wells with blue color represented the reference as no compound treatment. After culturing, the detection reagent would then be added. The relative cell viability of each well would be detected. If a compound can suppress the cell viability, these compounds would be regarded as active hits. The active hits, here as B1 and B9, would further be proceeded to the serial dose phase. The B1 (red) and B9 (pink) compounds were treated to the cells using serial dose. The darker circles around the red or pink dots represented the higher compound concentration. The B1 compound showed inhibited the cell viability along with the increased concentration, which would be determined as a true positive. The B1 would then be validated in the potential compound validation phase. The cell lysates from B1 treatment or reference were then collected for the sandwich ELISA. The cells treated with B1 showed lower value than reference, demonstrating B1 as a lead compound
Fig. 9
Fig. 9
Signal source formats. a Preclinical lead compound identification is the early stage in drug discovery and is composed of three screening phases. The first phase is a high-throughput screening process. Large compound types are detected in single dose, and the active hits would be selected. The second phase is a medium-throughput screening. The active hits selected from single-dose screening would be tested in serial doses to select the true-positive hits. The third phase is a low-throughput screening for validation of lead compound identification. b–d Different platforms, such as the high-throughput, the medium-throughput, and the low-throughput platforms, can generate different signal formats. Common formats include b the linear signal source and c the clustered signal source. The signal files generated from preclinical lead compound identification are usually in the clustered format. d Scattered signal source is another kind of signal format
Fig. 10
Fig. 10
Multiple signals in precision agriculture. a Different soybean lines were arranged in a greenhouse. The high-throughput phenomic screening system is composed of a mobile camera (indicated by the blue dashed box) and the automatic gantry. The system scanned through the arranged soybean plants along the column direction (blue arrow), and recorded different kinds of images, including b RGB photos, c 3D scanning images for individual plants, d the images with the whole rows of plants, or e with further processing
Fig. 11
Fig. 11
Plant line selection and harvesting time. ac Multiple traits can be used for plant line selection, including a digital biomass, b height, and c light penetration. The lines (from line #1 to line #6) would be compared to a reference line to select the lines with required phenotypes. The plant lines with purple background were the selected lines. For example, a line #6 was selected because of its largest digital biomass. b Based on the height, line #2 with the shortest stem was selected. c In the light penetration trait, light remained the most after penetrating through the leaves of line #5, so line #5 was selected. d, e During d the plant growth period, e the plant biomass would enlarge throughout the growing stage. When the plants reach their harvesting point (purple dashed box), the biomass would no longer increase. If the plants are not harvested after this harvesting point (purple dashed box), extra labor (orange dashed box) would increase the cost and decrease the farming efficiency
Fig. 12
Fig. 12
Multiple sample names in deep-sea fishery. The earth surface can be divided into different grids. Each grid is represented by a set of latitude (colored in red) and longitude (colored in blue). In deep-sea fishery, the ships are fishing on the offshore area which is far away from the shore. Through the latitude and longitude combination, the grids can be used to report the ship location
Fig. 13
Fig. 13
Procedure of GateMultiplex operation. The operation of GM_Basic and GM_Advanced can be divided into three parts, including input file information (in red background), cutoff setting (in yellow background), and output (in green background). The black dots under reference cutoff and the output file represent the numbers of the options. In GM_Basic, the operation starts from an input file, which would be converted into the required data format. The data would then be respectively analyzed by two cutoffs, reference cutoff, and background noise cutoff. The results from two cutoffs would be combined and further processed by tech-/bio-cutoff. The final results would be outputted as the result files. The operation of GM_Advanced is similar to that of GM_Basic. The blue words and dots in GM_Advanced represent the additional cutoffs or options. Internal control cutoff exerts before reference cutoff, and reference cutoff contains two more options (see Additional file 2 for the details). After being analyzed by tech-/bio- cutoff, the data could further be processed by positive cutoff. In the output file, one more file option is available

References

    1. Wang Z, Mao Y, Guo Y, Gao J, Liu X, Li S, Lin YCJ, Chen H, Wang JP, Chiang VL, Li W. MYB transcription factor161 mediates feedback regulation of secondary wall-associated NAC-Domain1 family genes for wood formation. Plant Physiol. 2020;184(3):1389–1406. doi: 10.1104/pp.20.01033. - DOI - PMC - PubMed
    1. Yeh CS, Wang Z, Miao F, Ma H, Kao CT, Hsu TS, Yu JH, Hung ET, Lin CC, Kuan CY, Tsai NC, Zhou C, Qu GZ, Jiang J, Liu G, Wang JP, Li W, Chiang VL, Chang TH, Lin YCJ. A novel synthetic-genetic-array-based yeast one-hybrid system for high discovery rate and short processing time. Genome Res. 2019;29(8):1343–1351. doi: 10.1101/gr.245951.118. - DOI - PMC - PubMed
    1. Li S, Lin YJ, Wang P, Zhang B, Li M, Chen S, et al. The AREB1 transcription factor influences histone acetylation to regulate drought responses and tolerance in Populus trichocarpa. Plant Cell. 2019;31(3):663–686. doi: 10.1105/tpc.18.00437. - DOI - PMC - PubMed
    1. Chen H, Wang JP, Liu H, Li H, Lin YJ, Shi R, et al. Hierarchical transcription factor and chromatin binding network for wood formation in black cottonwood (Populus trichocarpa) Plant Cell. 2019;31(3):602–626. doi: 10.1105/tpc.18.00620. - DOI - PMC - PubMed
    1. Lin YC, Li W, Sun YH, Kumari S, Wei H, Li Q, Tunlaya-Anukit S, Sederoff RR, Chiang VL. SND1 transcription factor-directed quantitative functional hierarchical genetic regulatory network in wood formation in Populus trichocarpa. Plant Cell. 2013;25(11):4324–4341. doi: 10.1105/tpc.113.117697. - DOI - PMC - PubMed

Publication types

LinkOut - more resources