. 2021 Nov 15;81(22):5706-5719.
doi: 10.1158/0008-5472.CAN-21-0536. Epub 2021 Sep 24.

TGFBI Production by Macrophages Contributes to an Immunosuppressive Microenvironment in Ovarian Cancer

Affiliations

TGFBI Production by Macrophages Contributes to an Immunosuppressive Microenvironment in Ovarian Cancer

Laura S M Lecker et al. Cancer Res. .

Abstract

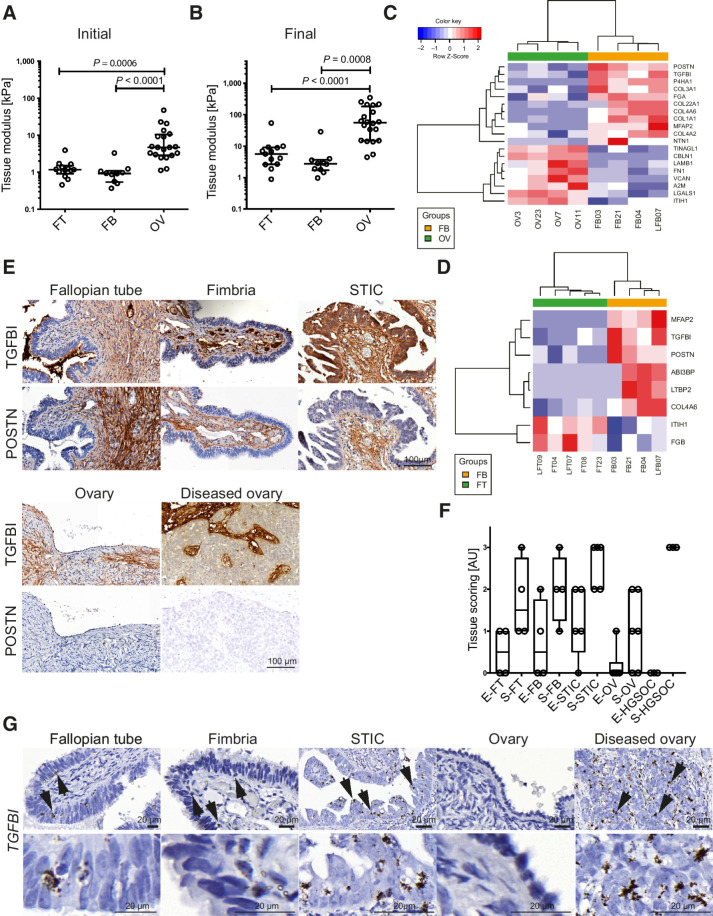
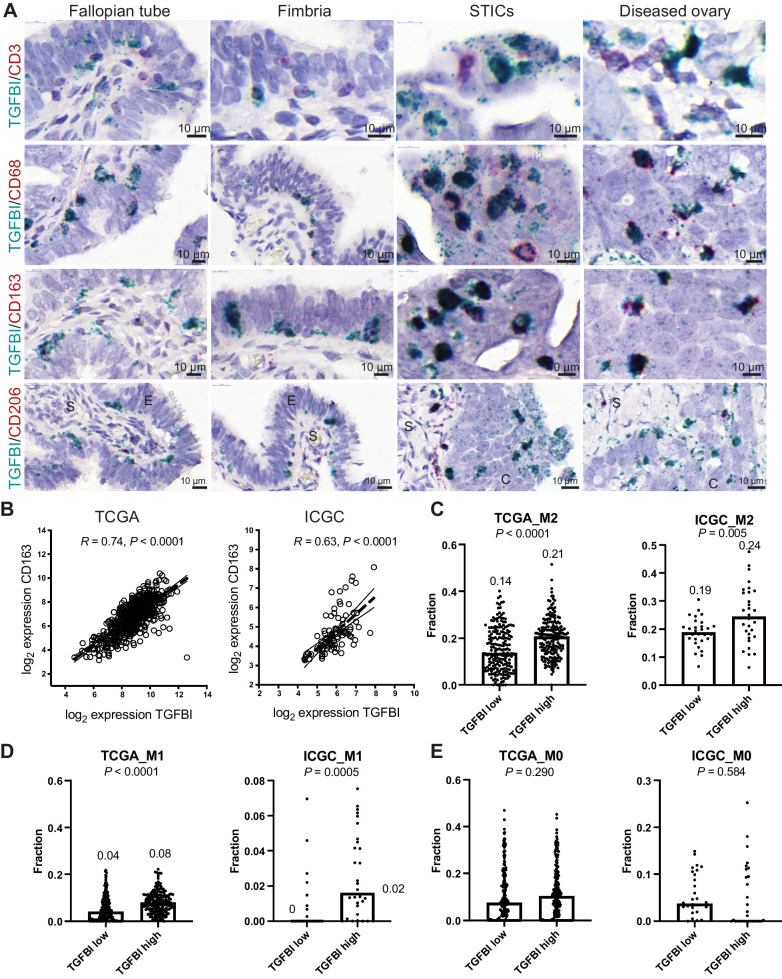
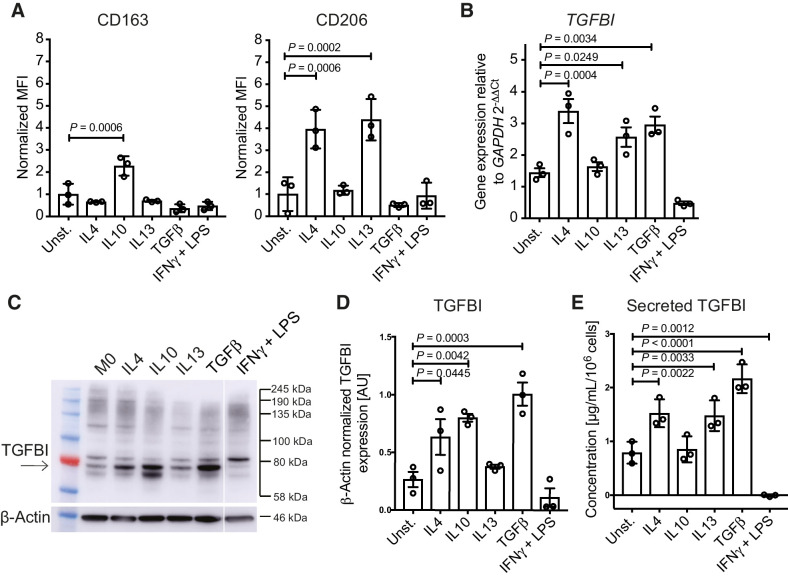
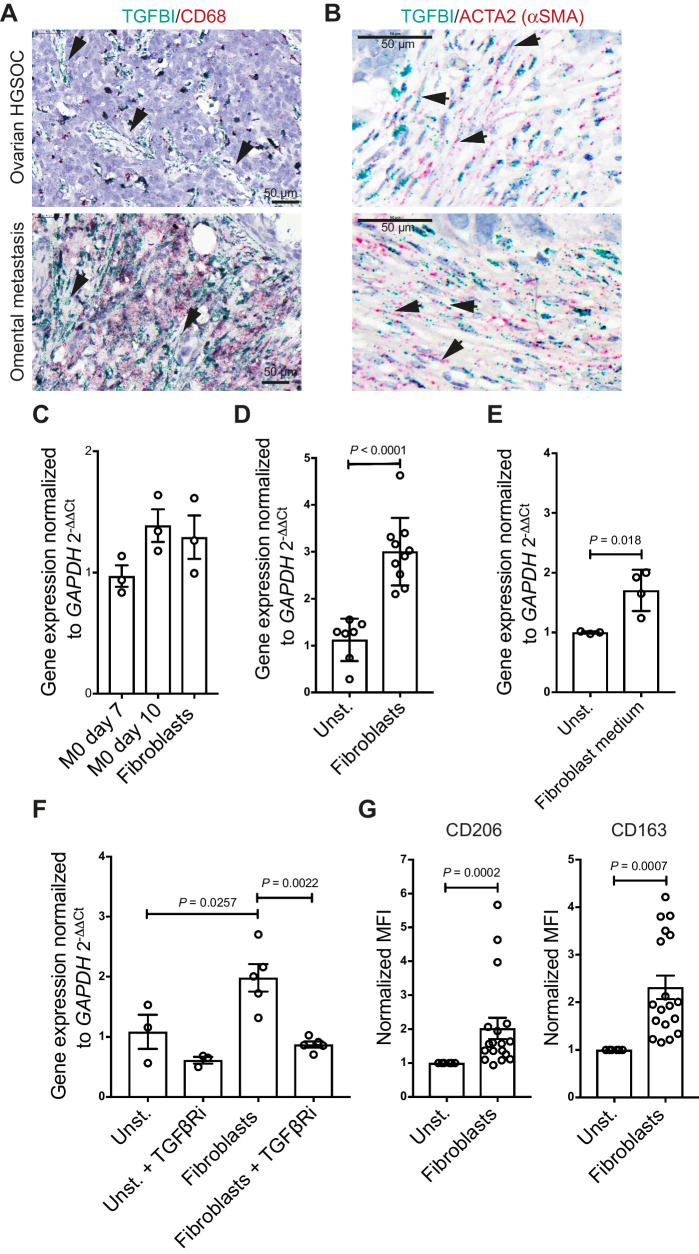
The tumor microenvironment evolves during malignant progression, with major changes in nonmalignant cells, cytokine networks, and the extracellular matrix (ECM). In this study, we aimed to understand how the ECM changes during neoplastic transformation of serous tubal intraepithelial carcinoma lesions (STIC) into high-grade serous ovarian cancers (HGSOC). Analysis of the mechanical properties of human fallopian tubes (FT) and ovaries revealed that normal FT and fimbria had a lower tissue modulus, a measure of stiffness, than normal or diseased ovaries. Proteomic analysis of the matrisome fraction between FT, fimbria, and ovaries showed significant differences in the ECM protein TGF beta induced (TGFBI, also known as βig-h3). STIC lesions in the fimbria expressed high levels of TGFBI, which was predominantly produced by CD163-positive macrophages proximal to STIC epithelial cells. In vitro stimulation of macrophages with TGFβ and IL4 induced secretion of TGFBI, whereas IFNγ/LPS downregulated macrophage TGFBI expression. Immortalized FT secretory epithelial cells carrying clinically relevant TP53 mutations stimulated macrophages to secrete TGFBI and upregulated integrin αvβ3, a putative TGFBI receptor. Transcriptomic HGSOC datasets showed a significant correlation between TGFBI expression and alternatively activated macrophage signatures. Fibroblasts in HGSOC metastases expressed TGFBI and stimulated macrophage TGFBI production in vitro. Treatment of orthotopic mouse HGSOC tumors with an anti-TGFBI antibody reduced peritoneal tumor size, increased tumor monocytes, and activated β3-expressing unconventional T cells. In conclusion, TGFBI may favor an immunosuppressive microenvironment in STICs that persists in advanced HGSOC. Furthermore, TGFBI may be an effector of the tumor-promoting actions of TGFβ and a potential therapeutic target. SIGNIFICANCE: Analysis of ECM changes during neoplastic transformation reveals a role for TGFBI secreted by macrophages in immunosuppression in early ovarian cancer.


Figures

Figure 1. Identification of tissue modulus and matrisome proteins that define tissue architecture of human OV and FT tissues. A and B, Initial and final tissue modulus of human FT, FB, and OV tissues. Statistical significance was determined using Kruskal–Wallis test with Dunn multiple comparison test. C and D, Heatmap depicting matrisome proteins differentially expressed between OV (n = 4), FB (n = 4), FT (n = 5), and FB tissues. E, IHC of TGFBI and POSTN. Representative images from FT (n = 4), FB (n = 4), STIC (n = 7), ovary (n = 6), and diseased ovary (n = 3) tissues. F, Modified Allred scoring of the matrisome protein TGFBI. Scoring describes the percentage of positive staining (0 = negative, 1 = weak, 2 = moderate, 3 = strong). Scoring was performed on epithelial (E) and stromal (S) areas of FT (n = 4), FB (n = 4), STIC (n = 5), ovary (n = 6), and diseased ovary (n = 3) tissues. G, ISH of TGFBI in healthy and diseased FT and OV tissues. Arrows indicate cells with a high copy number of TGFBI mRNA and cytoplasmic projections. Representative images of FT (n = 3), FB (n = 3), STIC (n = 9), ovary (n = 4), and invasive HGSOC at the ovary (n = 6).
Figure 1.
Identification of tissue modulus and matrisome proteins that define tissue architecture of human OV and FT tissues. A and B, Initial and final tissue modulus of human FT, FB, and OV tissues. Statistical significance was determined using Kruskal–Wallis test with Dunn multiple comparison test. C and D, Heatmap depicting matrisome proteins differentially expressed between OV (n = 4), FB (n = 4), FT (n = 5), and FB tissues. E, IHC of TGFBI and POSTN. Representative images from FT (n = 4), FB (n = 4), STIC (n = 7), ovary (n = 6), and diseased ovary (n = 3) tissues. F, Modified Allred scoring of the matrisome protein TGFBI. Scoring describes the percentage of positive staining (0 = negative, 1 = weak, 2 = moderate, 3 = strong). Scoring was performed on epithelial (E) and stromal (S) areas of FT (n = 4), FB (n = 4), STIC (n = 5), ovary (n = 6), and diseased ovary (n = 3) tissues. G, ISH of TGFBI in healthy and diseased FT and OV tissues. Arrows indicate cells with a high copy number of TGFBI mRNA and cytoplasmic projections. Representative images of FT (n = 3), FB (n = 3), STIC (n = 9), ovary (n = 4), and invasive HGSOC at the ovary (n = 6).
Figure 2. TGFBI is produced by TAMs. A, Dual ISH for TGFBI with either CD3, CD68, CD163, or CD206 in healthy and diseased FT and OV. B, Correlation of CD163 with TGFBI within TCGA and ICGC HGSOC transcriptional datasets. C–E, CIBERSORT fractions of M2, M1, and M0 macrophages in TGFBI low and high patients of TCGA and ICGC dataset. Statistical significance was determined using Student t test. Median values are indicated.
Figure 2.
TGFBI is produced by TAMs. A, Dual ISH for TGFBI with either CD3, CD68, CD163, or CD206 in healthy and diseased FT and OV. B, Correlation of CD163 with TGFBI within TCGA and ICGC HGSOC transcriptional datasets. C–E, CIBERSORT fractions of M2, M1, and M0 macrophages in TGFBI low and high patients of TCGA and ICGC dataset. Statistical significance was determined using Student t test. Median values are indicated.
Figure 3. TGFBI expression and secretion by macrophages in vitro. A, CD163 and CD206 surface expression, determined by flow cytometry, in human monocyte-derived macrophages stimulated with the cytokines IL4, IL10, IL13, TGFβ, and IFNγ+LPS. Data (n = 3) shown are mean ± SD. Statistical significance was determined using one-way ANOVA with Dunnett multiple comparisons test. MFI, mean fluorescence intensity. B, TGFBI expression of monocyte-derived macrophages stimulated for 3 days. Data (n = 3) shown are mean ± SD. Statistical significance was determined using one-way ANOVA with Dunnett multiple comparisons test. C and D, Western blot analysis and quantification of TGFBI in cytokine-stimulated monocyte-derived macrophages. TGFBI band is indicated by the arrow. E, Secreted TGFBI levels by macrophages stimulated for 3 days measured by ELISA. Data (n = 3) shown are mean ± SD. Statistical significance was determined using one-way ANOVA with uncorrected Fisher LSD multiple comparisons test.
Figure 3.
TGFBI expression and secretion by macrophages in vitro. A, CD163 and CD206 surface expression, determined by flow cytometry, in human monocyte-derived macrophages stimulated with the cytokines IL4, IL10, IL13, TGFβ, and IFNγ+LPS. Data (n = 3) shown are mean ± SD. Statistical significance was determined using one-way ANOVA with Dunnett multiple comparisons test. MFI, mean fluorescence intensity. B,TGFBI expression of monocyte-derived macrophages stimulated for 3 days. Data (n = 3) shown are mean ± SD. Statistical significance was determined using one-way ANOVA with Dunnett multiple comparisons test. C and D, Western blot analysis and quantification of TGFBI in cytokine-stimulated monocyte-derived macrophages. TGFBI band is indicated by the arrow. E, Secreted TGFBI levels by macrophages stimulated for 3 days measured by ELISA. Data (n = 3) shown are mean ± SD. Statistical significance was determined using one-way ANOVA with uncorrected Fisher LSD multiple comparisons test.
Figure 4. Stimulation of TGFBI expression in macrophages by p53 mutated FTSE cells resembling STICs. A, Expression of p53 in STIC lesions. B, Expression of p53 in FT318 wild-type and mutant p53 transduced FTSE cells (R175H, R273H, R273C, R248W, Y220C). β-actin was used as loading control. C, TGFBI transcript expression of unstimulated and TGFβ-stimulated FT318 wild-type and mutant p53 FTSE cell lines in comparison with unstimulated (unst.) and TGFβ-stimulated macrophages. Data (n = 3) shown are mean ± SEM. Statistical significance was determined using one-way ANOVA with Dunnett multiple comparisons test. D, TGFBI expression in macrophages cultured in transwells with FTSE wild-type and FTSE-mutant cell lines. Data are shown for unstimulated macrophages (n = 7), FT318 (n = 3), R175H (n = 3), R273H (n = 3), R273C (n = 3), R248W (n = 3), and Y220C (n = 3). Statistical significance was determined using one-way ANOVA with Dunnett multiple comparisons test.E, TGFBI secretion of macrophages alone (M0) or cocultured with FTSE cell lines [wild type (FNE01, FNE02, FT318) and mutant p53 (R175H, R273H, R273C, R248W, Y220C)] and a HGSOC cell line (G164) normalized for 106 macrophages. Data are mean ± SD. Macrophages (n = 7), FNE01 (n = 6), FNE02 (n = 6), FT318 (n = 7), R175H (n = 4), R273H (n = 4), R273C (n = 4), R248W (n = 4), Y220C (n = 4), G164 (n = 6). Statistical significance determined using one-way ANOVA with Dunnett multiple comparisons test. Compared with coculture with FT318, secretion of TGFBI is significant only for cell lines R273C and Y220C. F, TGFBI secretion of cocultured macrophages with FTSE and HGSOC cells in the presence or absence of the selective TGFβR inhibitor SB431542. Data are mean ± SD. n = 3 for all the inhibitor-treated conditions. Statistical significance was determined using one-way ANOVA with Dunnett multiple comparisons test. Untreated coculture data points are the same as in E. G, IHC staining of healthy and diseased human tissues for the integrin subunits αv and β3. Representative data are shown for FT (n = 3), FB (n = 3), STICs (n = 7), ovary (n = 3), and HGSOC diseased ovary (n = 4) tissues. H, FT318 wild-type and mutant p53 (R175H, R273H, R273C, R248W, Y220C) FTSE cells stained for the integrin αvβ3 [n = 5 (FT318, R273C, R273H); n = 3 (R175H, R248W, Y220C)] and the subunit β3 (n = 3). Data are mean ± SEM. Statistical significance determined using one-way ANOVA with Bonferroni multiple comparisons test. MFI, mean fluorescence intensity.
Figure 4.
Stimulation of TGFBI expression in macrophages by p53 mutated FTSE cells resembling STICs. A, Expression of p53 in STIC lesions. B, Expression of p53 in FT318 wild-type and mutant p53 transduced FTSE cells (R175H, R273H, R273C, R248W, Y220C). β-actin was used as loading control. C,TGFBI transcript expression of unstimulated and TGFβ-stimulated FT318 wild-type and mutant p53 FTSE cell lines in comparison with unstimulated (unst.) and TGFβ-stimulated macrophages. Data (n = 3) shown are mean ± SEM. Statistical significance was determined using one-way ANOVA with Dunnett multiple comparisons test. D,TGFBI expression in macrophages cultured in transwells with FTSE wild-type and FTSE-mutant cell lines. Data are shown for unstimulated macrophages (n = 7), FT318 (n = 3), R175H (n = 3), R273H (n = 3), R273C (n = 3), R248W (n = 3), and Y220C (n = 3). Statistical significance was determined using one-way ANOVA with Dunnett multiple comparisons test.E, TGFBI secretion of macrophages alone (M0) or cocultured with FTSE cell lines [wild type (FNE01, FNE02, FT318) and mutant p53 (R175H, R273H, R273C, R248W, Y220C)] and a HGSOC cell line (G164) normalized for 106 macrophages. Data are mean ± SD. Macrophages (n = 7), FNE01 (n = 6), FNE02 (n = 6), FT318 (n = 7), R175H (n = 4), R273H (n = 4), R273C (n = 4), R248W (n = 4), Y220C (n = 4), G164 (n = 6). Statistical significance determined using one-way ANOVA with Dunnett multiple comparisons test. Compared with coculture with FT318, secretion of TGFBI is significant only for cell lines R273C and Y220C. F, TGFBI secretion of cocultured macrophages with FTSE and HGSOC cells in the presence or absence of the selective TGFβR inhibitor SB431542. Data are mean ± SD. n = 3 for all the inhibitor-treated conditions. Statistical significance was determined using one-way ANOVA with Dunnett multiple comparisons test. Untreated coculture data points are the same as in E. G, IHC staining of healthy and diseased human tissues for the integrin subunits αv and β3. Representative data are shown for FT (n = 3), FB (n = 3), STICs (n = 7), ovary (n = 3), and HGSOC diseased ovary (n = 4) tissues. H, FT318 wild-type and mutant p53 (R175H, R273H, R273C, R248W, Y220C) FTSE cells stained for the integrin αvβ3 [n = 5 (FT318, R273C, R273H); n = 3 (R175H, R248W, Y220C)] and the subunit β3 (n = 3). Data are mean ± SEM. Statistical significance determined using one-way ANOVA with Bonferroni multiple comparisons test. MFI, mean fluorescence intensity.
Figure 5. Cross-talk between TGFβ-secreting fibroblasts and macrophages. A, Dual ISH for TGFBI and CD68 in HGSOC in the ovary and omentum. Fibroblast-like cells (black arrows) span the stroma and express TGFBI but not CD68. B, Dual ISH for TGFBI and ACTA2 in HGSOC in the ovary and omentum. Examples of ACTA2-TGFBI are indicated by black arrows. C, TGFBI mRNA expression comparing the basal levels of transcript in unstimulated macrophages (n = 3) and primary omental fibroblasts (n = 3). Statistical significance was determined using one-way ANOVA with Dunnett multiple comparisons test. Nonsignificant, P > 0.05. D, TGFBI mRNA expression of cocultured macrophages with primary fibroblasts. Data shown are mean ± SD. Unstimulated macrophages, n = 7; fibroblasts, n = 10. Statistical significance was determined using one-way ANOVA with Dunnett multiple comparisons test. E, TGFBI mRNA expression by macrophages cultured in 50% fresh culture medium and 50% fibroblast-derived medium. Data shown are mean ± SD. Unstimulated (n = 3) versus fibroblast medium of four different donors (n = 4). Statistical significance was determined using unpaired t test. F, TGFBI mRNA expression of cocultured macrophages with omental fibroblasts in the presence or absence of the selective TGFβRi. Data shown are mean ± SD. n = 3 and n = 4 for unstimulated macrophages and macrophage/fibroblast cocultures (matched untreated and TGFβRi treated), respectively. Statistical significance was determined using one-way ANOVA with Dunnett multiple comparisons test. G, CD206 and CD163 expression post coculture with primary fibroblasts. Data were normalized to unstimulated macrophages. Data shown are mean ± SD. Unstimulated macrophages (n = 3) versus macrophages (two different peripheral blood mononuclear cell donors) cocultured with fibroblasts of up to seven different fibroblast donors (n = 11). Statistical significance was determined using unpaired t test. MFI, mean fluorescence intensity.
Figure 5.
Cross-talk between TGFβ-secreting fibroblasts and macrophages. A, Dual ISH for TGFBI and CD68 in HGSOC in the ovary and omentum. Fibroblast-like cells (black arrows) span the stroma and express TGFBI but not CD68. B, Dual ISH for TGFBI and ACTA2 in HGSOC in the ovary and omentum. Examples of ACTA2-TGFBI are indicated by black arrows. C,TGFBI mRNA expression comparing the basal levels of transcript in unstimulated macrophages (n = 3) and primary omental fibroblasts (n = 3). Statistical significance was determined using one-way ANOVA with Dunnett multiple comparisons test. Nonsignificant, P > 0.05. D,TGFBI mRNA expression of cocultured macrophages with primary fibroblasts. Data shown are mean ± SD. Unstimulated macrophages, n = 7; fibroblasts, n = 10. Statistical significance was determined using one-way ANOVA with Dunnett multiple comparisons test. E,TGFBI mRNA expression by macrophages cultured in 50% fresh culture medium and 50% fibroblast-derived medium. Data shown are mean ± SD. Unstimulated (n = 3) versus fibroblast medium of four different donors (n = 4). Statistical significance was determined using unpaired t test. F,TGFBI mRNA expression of cocultured macrophages with omental fibroblasts in the presence or absence of the selective TGFβRi. Data shown are mean ± SD. n = 3 and n = 4 for unstimulated macrophages and macrophage/fibroblast cocultures (matched untreated and TGFβRi treated), respectively. Statistical significance was determined using one-way ANOVA with Dunnett multiple comparisons test. G, CD206 and CD163 expression post coculture with primary fibroblasts. Data were normalized to unstimulated macrophages. Data shown are mean ± SD. Unstimulated macrophages (n = 3) versus macrophages (two different peripheral blood mononuclear cell donors) cocultured with fibroblasts of up to seven different fibroblast donors (n = 11). Statistical significance was determined using unpaired t test. MFI, mean fluorescence intensity.
Figure 6. Effect of anti-TGFBI treatment in an in vivo model of HGSOC. A, Boxplot of Tgfbi gene expression in log2 read counts per million (RPKM) across healthy omentum of FVB (n = 4) and C57BL6 mice (n = 5) and omental tumors from the 30200 (n = 4), 60577 (n = 5), HGS1 (n = 3), HGS2 (n = 4), HGS3 (n = 4), HGS4 models (n = 5) from GSE132289. B, RNA-scope for TGFBI in an omental tumor from the HGS2 model. C and D, Omentum, SP, LO (C) and mesenteric (D) tumor weight for mice injected with HGS2 and treated for 3 weeks with anti-TGFBI, starting at week 7 (n = 18 for controls; n = 10 for anti-TGFBI treated). Statistical significance was determined using unpaired t test. E–G, Percentage of macrophages, granulocytes, monocytes, CD4, CD8, and UTC among CD45-positive cells in omental tumors from control-treated and anti-TGFBI–treated mice (n = 18 for controls; n = 10 for anti-TGFBI treated). Statistical significance was determined using t test. H, Percentage of CD8 and UTC cells positive for CD107a (surface staining) in omental tumors from control-treated and anti-TGFBI–treated mice. (n = 8 for controls; n = 6 for anti-TGFBI treated). Statistical significance was determined using t test. I and J, Percentage of cells positive for integrin β3 and β1subunits staining on different populations of immune cells infiltrating untreated omental tumors generated by injecting HGS2 (percentage of integrin-positive cells for each population, from n = 5 tumors).
Figure 6.
Effect of anti-TGFBI treatment in an in vivo model of HGSOC. A, Boxplot of Tgfbi gene expression in log2 read counts per million (RPKM) across healthy omentum of FVB (n = 4) and C57BL6 mice (n = 5) and omental tumors from the 30200 (n = 4), 60577 (n = 5), HGS1 (n = 3), HGS2 (n = 4), HGS3 (n = 4), HGS4 models (n = 5) from GSE132289. B, RNA-scope for TGFBI in an omental tumor from the HGS2 model. C and D, Omentum, SP, LO (C) and mesenteric (D) tumor weight for mice injected with HGS2 and treated for 3 weeks with anti-TGFBI, starting at week 7 (n = 18 for controls; n = 10 for anti-TGFBI treated). Statistical significance was determined using unpaired t test. E–G, Percentage of macrophages, granulocytes, monocytes, CD4, CD8, and UTC among CD45-positive cells in omental tumors from control-treated and anti-TGFBI–treated mice (n = 18 for controls; n = 10 for anti-TGFBI treated). Statistical significance was determined using t test. H, Percentage of CD8 and UTC cells positive for CD107a (surface staining) in omental tumors from control-treated and anti-TGFBI–treated mice. (n = 8 for controls; n = 6 for anti-TGFBI treated). Statistical significance was determined using t test. I and J, Percentage of cells positive for integrin β3 and β1subunits staining on different populations of immune cells infiltrating untreated omental tumors generated by injecting HGS2 (percentage of integrin-positive cells for each population, from n = 5 tumors).
Figure 7. Potential actions of TGFBI in STICs and advanced HGSOC. A, In the early stages of transformation, FTSE cells in the FB induce TGFBI in macrophages, in part through the secretion of TGFβ. Once the secretory cells of the epithelium acquire a TP53 mutation, they may further upregulate integrins, such as αvβ3, that allows them to bind to overexpressed matrix proteins, such as TGFBI. IL4 secreted by Th2 T cells may play a role in the secretion of TGFBI by macrophages. Therefore, TGFβ signaling in the FB may prime macrophages to secrete TGFBI, which is an effector of an immunosuppressive microenvironment promoting transformed FTSE cell growth and STIC development. B, In established HGSOC tumors, TGFBI is produced by macrophages, and fibroblasts especially interact with unconventional T cells, UTCs in omental metastases. Anti-TGFBI antibodies stimulate UTC infiltration and activation in the tumor microenvironment.
Figure 7.
Potential actions of TGFBI in STICs and advanced HGSOC. A, In the early stages of transformation, FTSE cells in the FB induce TGFBI in macrophages, in part through the secretion of TGFβ. Once the secretory cells of the epithelium acquire a TP53 mutation, they may further upregulate integrins, such as αvβ3, that allows them to bind to overexpressed matrix proteins, such as TGFBI. IL4 secreted by Th2 T cells may play a role in the secretion of TGFBI by macrophages. Therefore, TGFβ signaling in the FB may prime macrophages to secrete TGFBI, which is an effector of an immunosuppressive microenvironment promoting transformed FTSE cell growth and STIC development. B, In established HGSOC tumors, TGFBI is produced by macrophages, and fibroblasts especially interact with unconventional T cells, UTCs in omental metastases. Anti-TGFBI antibodies stimulate UTC infiltration and activation in the tumor microenvironment.

References

    1. Mehra K, Mehrad M, Ning G, Drapkin R, McKeon FD, Xian W, et al. . STICS, SCOUTs and p53 signatures; a new language for pelvic serous carcinogenesis. Front Biosci 2011;3:625–34. - PubMed
    1. Lee Y, Miron A, Drapkin R, Nucci MR, Medeiros F, Saleemuddin A, et al. . A candidate precursor to serous carcinoma that originates in the distal fallopian tube. J Pathol 2007;211:26–35. - PubMed
    1. Kuhn E, Kurman RJ, Vang R, Sehdev AS, Han G, Soslow R, et al. . TP53 mutations in serous tubal intraepithelial carcinoma and concurrent pelvic high-grade serous carcinoma–evidence supporting the clonal relationship of the two lesions. J Pathol 2012;226:421–6. - PMC - PubMed
    1. Perets R, Wyant GA, Muto KW, Bijron JG, Poole BB, Chin KT, et al. . Transformation of the fallopian tube secretory epithelium leads to high-grade serous ovarian cancer in Brca;Tp53;Pten models. Cancer Cell 2013;24:751–65. - PMC - PubMed
    1. Kindelberger DW, Lee Y, Miron A, Hirsch MS, Feltmate C, Medeiros F, et al. . Intraepithelial carcinoma of the fimbria and pelvic serous carcinoma: evidence for a causal relationship. Am J Surg Pathol 2007;31:161–9. - PubMed

Publication types

MeSH terms

Substances