. 2021 Sep;9(9):e003125.
doi: 10.1136/jitc-2021-003125.

Multiparametric MRI of early tumor response to immune checkpoint blockade in metastatic melanoma

Affiliations

Multiparametric MRI of early tumor response to immune checkpoint blockade in metastatic melanoma

Doreen Lau et al. J Immunother Cancer. 2021 Sep.

Abstract

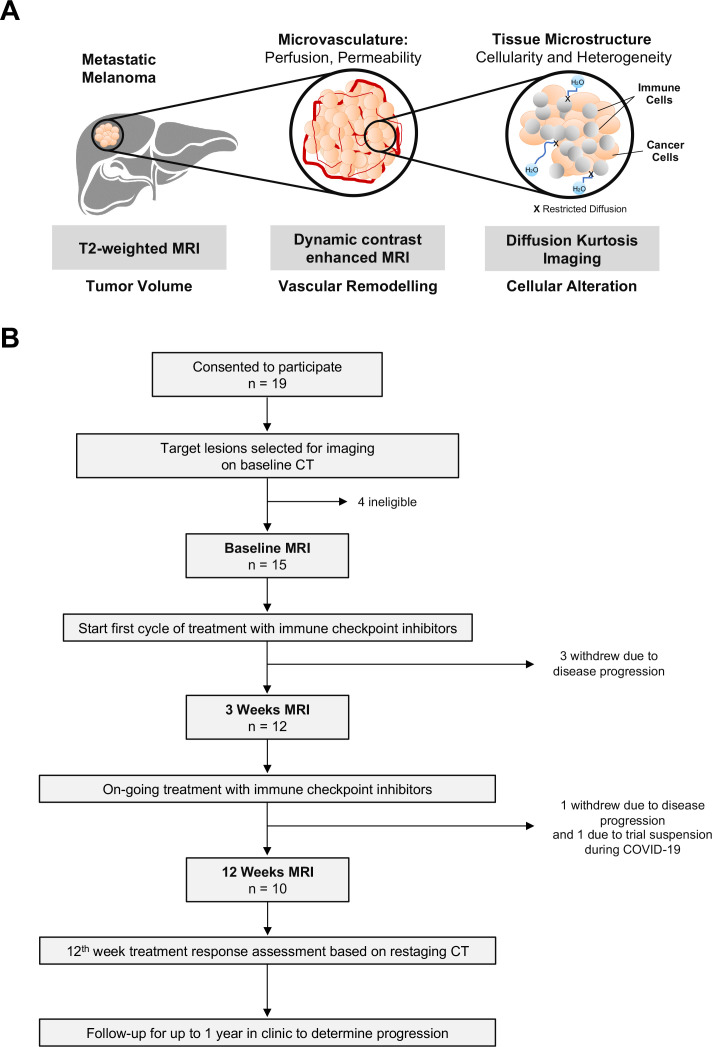
Background: Immune checkpoint inhibitors are now standard of care treatment for many cancers. Treatment failure in metastatic melanoma is often due to tumor heterogeneity, which is not easily captured by conventional CT or tumor biopsy. The aim of this prospective study was to investigate early microstructural and functional changes within melanoma metastases following immune checkpoint blockade using multiparametric MRI.

Methods: Fifteen treatment-naïve metastatic melanoma patients (total 27 measurable target lesions) were imaged at baseline and following 3 and 12 weeks of treatment on immune checkpoint inhibitors using: T2-weighted imaging, diffusion kurtosis imaging, and dynamic contrast-enhanced MRI. Treatment timepoint changes in tumor cellularity, vascularity, and heterogeneity within individual metastases were evaluated and correlated to the clinical outcome in each patient based on Response Evaluation Criteria in Solid Tumors V.1.1 at 1 year.

Results: Differential tumor growth kinetics in response to immune checkpoint blockade were measured in individual metastases within the same patient, demonstrating significant intertumoral heterogeneity in some patients. Early detection of tumor cell death or cell loss measured by a significant increase in the apparent diffusivity (Dapp) (p<0.05) was observed in both responding and pseudoprogressive lesions after 3 weeks of treatment. Tumor heterogeneity, as measured by apparent diffusional kurtosis (Kapp), was consistently higher in the pseudoprogressive and true progressive lesions, compared with the responding lesions throughout the first 12 weeks of treatment. These preceded tumor regression and significant tumor vascularity changes (Ktrans, ve, and vp) detected after 12 weeks of immunotherapy (p<0.05).

Conclusions: Multiparametric MRI demonstrated potential for early detection of successful response to immune checkpoint inhibitors in metastatic melanoma.

Keywords: CTLA-4 antigen; biomarkers; immunotherapy; melanoma; translational medical research; tumor.


Conflict of interest statement

Competing interests: No conflict of interest to declare with respect to the content of this work. AL, MS, LB, and J-ML are employees of AstraZeneca UK.

Figures

Figure 1
Figure 1
An mpMRI approach for longitudinal tracking of biological changes within tumors in response to immune checkpoint blockade. (A) Schematic diagram of the mpMRI approaches used in this study for monitoring tumor response to immune checkpoint blockade. Ktrans measurements on dynamic contrast-enhanced MRI were used to quantify vascular permeability, while ve and vp reported on the volume of the extravascular–extracellular and vascular spaces, respectively. Diffusional kurtosis imaging, as an advanced form of diffusion-weighted imaging, was used to probe tissue microstructure using the metrics of apparent diffusivity (Dapp) as a measure of cellularity and apparent kurtosis (Kapp) for tissue heterogeneity. (B) Study flow chart for the melanoma immunotherapy trial (MelResist). mpMRI, multiparametric MRI.
Figure 2
Figure 2
Interpatient and intermetastatic heterogeneity in response to immune checkpoint blockade. (A) Differential tumor growth kinetics in patients receiving PD-1 monotherapy compared with combined CTLA-4 and PD-1 treatment. Individual tumor volumes were measured on T2-weighted MRI. Categorization of tumors into three subgroups (responding, pseudoprogression, and true progression) were based on comparing the 3-week MRI with the 12-week MRI, confirmed with restaging CT at 12 weeks and follow-up on the clinical outcome for up to 1 year. (B) Representative T2-weighted images from three patients with the classic features of responding, pseudoprogressive, and true progressive lesions. Note the T2 hyperintensity in keeping with inflammation in the pseudoprogressive lesion at 3 weeks. CTLA-4, cytotoxic T-lymphocyte antigen-4; PD-1, programmed cell death receptor-1.
Figure 3
Figure 3
Histogram analysis of the T2 intensity values of all four pseudoprogressive lesions. These included: the (A) axilla lesion 2, (B) axilla lesion 3, (C) subcutaneous lesion of patient 4, and the (D) external iliac node of patient 7.
Figure 4
Figure 4
Early detection of tumor cell death using DKI. (A) Comparison of apparent diffusivity (Dapp) as a measure of tumor cell density between responders and non-responders at baseline before the start of treatment. (B) Changes in average tumor Dapp on a per patient basis over the course of treatment, divided according to overall response. (C) Response of individual lesions classified into three subgroups (responding, pseudoprogression, and true progression) showing the differences in tumor cellularity at baseline. (D) Percentage change in Dapp relative to baseline in individual lesions from the three subgroups. (E) Representative Dapp images from three lesions categorized as responding, pseudoprogression, and true progression, respectively, based on the 1-year restaging CT. Data are presented as median and IQR. Normality was assessed using the Shapiro-Wilk test. Mann-Whitney test was performed to assess differences between two independent lesion subgroups; Kruskal-Wallis test with post hoc Dunn’s multiple comparison analysis was performed to test for differences between three independent lesion subgroups; *p<0.05; ***p<0.001. Yellow line in figure part D indicates the percentage change in Dapp for patient 4. Analysis of apparent kurtosis as a measure of tumor heterogeneity, detected concurrently using DKI, is found in online supplemental figure S1. DKI, diffusion kurtosis imaging.
Figure 5
Figure 5
Dynamic changes in intertumoral response to immune checkpoint blockade within a single patient. (A) Multiple metastases in a patient on treatment with nivolumab (PD-1 monotherapy). Intertumoral differences in treatment response, vascular permeability, and cellularity were measured in four target lesions on MRI during the first 12 weeks of treatment. Increased cellularity was detected in the responding tumor (lesion 1) despite a reduction in tumor volume and lower vascularity at 12 weeks. The responding lesion subsequently progressed at 6 months on treatment and was surgically resected. (B) Axial CT of lesion 1 at baseline, 12 weeks, and 6 months; largest tumor diameter shown in mm. (C) Immunohistochemistry of lesion 1 showed remarkable infiltration of immune cells (CD8) in viable tumor tissues that were highly hypoxic (CAIX), proliferative (Ki67), and vascular (CD31). Scale bars for CD8 immunostained images represent 100 µm (10× magnification) and 50 µm (80× magnification); 100 µm in CAIX/Ki67 dual staining (20× magnification) and CD31 (10× magnification). PD-1, programmed cell death receptor-1.
Figure 6
Figure 6
Tumor vasculature remodeling following immune cytotoxic killing and tumor cell death. (A) Comparison of vascular permeability Ktrans between responders and non-responders at baseline before the start of treatment. (B) Changes in tumor Ktrans over the course of treatment. (C) Comparison of tumor vascular permeability at baseline between individual lesions from the three subgroups: responding, pseudoprogression, and true progression. (D) Percentage change in Ktrans relative to baseline in individual lesions from the three subgroups. (E) Representative Ktrans images from the three subgroups lesions. *P<0.05; **p<0.01. Yellow line in figure part D indicates the percentage change in Ktrans for patient 4. Analysis for other DCE-MRI parametric measurements is found in online supplemental figure S3. DCE-MRI, dynamic contrast-enhanced MRI.

References

    1. Ribas A, Wolchok JD. Cancer immunotherapy using checkpoint blockade. Science 2018;359:1350–5. 10.1126/science.aar4060 - DOI - PMC - PubMed
    1. Danson S, Hook J, Marshall H, et al. . Are we over-treating with checkpoint inhibitors? Br J Cancer 2019;121:629–30. 10.1038/s41416-019-0570-y - DOI - PMC - PubMed
    1. Schachter J, Ribas A, Long GV, et al. . Pembrolizumab versus ipilimumab for advanced melanoma: final overall survival results of a multicentre, randomised, open-label phase 3 study (KEYNOTE-006). Lancet 2017;390:1853–62. 10.1016/S0140-6736(17)31601-X - DOI - PubMed
    1. Larkin J, Chiarion-Sileni V, Gonzalez R, et al. . Five-year survival with combined nivolumab and ipilimumab in advanced melanoma. N Engl J Med 2019;381:1535–46. 10.1056/NEJMoa1910836 - DOI - PubMed
    1. Larkin J, Chiarion-Sileni V, Gonzalez R, et al. . Combined nivolumab and ipilimumab or monotherapy in untreated melanoma. N Engl J Med 2015;373:23–34. 10.1056/NEJMoa1504030 - DOI - PMC - PubMed

Publication types

Substances