. 2021 Sep 24;12(1):5629.
doi: 10.1038/s41467-021-25804-z.

A longitudinal sampling study of transcriptomic and epigenetic profiles in patients with thrombocytopenia syndrome

Affiliations

A longitudinal sampling study of transcriptomic and epigenetic profiles in patients with thrombocytopenia syndrome

Yafen Wang et al. Nat Commun. .

Abstract

Severe fever with thrombocytopenia syndrome (SFTS) is a novel tick-borne infectious disease caused by a new type of SFTS virus (SFTSV). Here, a longitudinal sampling study is conducted to explore the differences in transcript levels after SFTSV infection, and to characterize the transcriptomic and epigenetic profiles of hospitalized patients. The results reveal significant changes in the mRNA expression of certain genes from onset to recovery. Moreover, m6A-seq reveals that certain genes related with immune regulation may be regulated by m6A. Besides the routine tests such as platelet counts, serum ALT and AST levels testing, distinct changes in myocardial enzymes, coagulation function, and inflammation are well correlated with the clinical data and sequencing data, suggesting that clinical practitioners should monitor the above indicators to track disease progression and guide personalized treatment. In this study, the transcript changes and RNA modification may lend a fresh perspective to our understanding of the SFTSV and play a significant role in the discovery of drugs for effective treatment of this disease.


Conflict of interest statement

The authors declare no competing interests.

Figures

Fig. 1
Fig. 1. Chronological changes of laboratory findings at different stages in patients with SFTS.
The progress of the SFTS, from the onset of symptoms to outcomes, is classified into four stages. Comparison of WBC counts (a), platelet counts (b), serum ALT (c) and AST (d) among groups are shown in the left panel (recovered patients, n = 21) and the right panel (deceased patients, n = 11), respectively. The dashed blue lines represent the clinical normal ranges of WBC (3.5–9.5 × 109/L), platelet (125–350 × 109/L), ALT (0–45 U/L), AST (0–35 U/L). The dashed red lines represent 2.5-fold of the upper limit of the normal ranges for ALT and AST, which indicates requiring supportive treatment for liver function. Each dot represents the result of a single test. Stage: S1 (Fever stage); S2 (Deterioration/Organ failure); S3 (Improving); S4 (Convalescence). A two-sided Mann–Whitney U test was used to assess the difference between groups and the p values are shown on the graph. In the presence of significant interactions, corrected pairwise comparisons were performed using a Bonferroni correction. Top line, maxima; bottom line, minima; center line, median; box limits, upper and lower quartiles; whiskers, 1.5× interquartile range; points, values.
Fig. 2
Fig. 2. SFTSV infection alters the transcriptome.
RNA-seq was performed on RNA isolated from the white blood cell from 7 positive samples and 4 recovery-negative group (negative samples from recovery patients). a Hierachical clustering of samples according to global gene expression demonstrates positive samples (red) cluster together whereas negative samples (blue) segregate together. Detailed information of the patients are provided in Supplementary Table 1. b Heat map of the z-scores for 955 significantly differentially expressed genes identified using RNA-seq (P < 0.001, exact test, likelihood ratio test, and quasi-likehood F test) shows that genes distinguish the SFTSV-positive samples from the SFTSV-negative samples. Red represents increased relative expression, and blue represents decreased relative expression. c Difference gene-expression in SFTSV virus (positive) and SFTSV virus (negative) with P < 0.001, exact test, likelihood ratio test, and quasi-likelihood F test. Red points indicate increase or decrease significantly while gray means no significant difference in negative and positive samples. FC, fold change; CPM, read count per million.
Fig. 3
Fig. 3. Differential gene landscapes and pathway analysis at different stages of SFTSV infection.
a, b Three patients with covering different stages of infection. a Clustered heat map showing significant differential expression of 955 genes identified by RNA-seq at different stages of SFTSV infection. Stage: S1 (Fever stage); S2 (Deterioration/Organ failure), S2-1 represents the early stage of S2 and S2-2 represents the later stage of S2; S3 (Improving); S4 (Convalescence). b Box plots showing the 955 genes CPM levels of three patients at different stages. The left and right dotted lines show downregulation (the SFTSV-positive sample was downregulated compared with the SFTSV-negative sample, n = 468 genes) and upregulation (the SFTSV-positive sample was upregulated compared with the SFTSV-negative sample, n = 487 genes) of gene expression after SFTSV infection, respectively. Center line, median; box limits, upper and lower quartiles; whiskers, 1.5× interquartile range; points, outliers. c GO analysis of the human transcripts containing differential expression genes upon SFTSV infection using DAVID bioinformatics database (the p values are provided by DAVID online tool).
Fig. 4
Fig. 4. Correlation between clinical outcomes and sequencing data.
a The core-enriched signaling pathways. Normalized enrichment score (NES suggested the results across the analyzed genes. b Dot plot showing the genes associated with the clinical indexes related to coagulation function, myocardial enzymes, and inflammation (Pearson correlation coefficient (r), and two-sided t-tests). c Fold changes of laboratory results from 41 patients infected with SFTSV at admission are shown on the graphs. The fold changes are calculated according to the following formula: Fold changes = (A−B)/B (A indicates the clinical testing results at admission, B represents the up or low limit of the normal ranges, n = 41 patients, error bars represent standard error of means (SEM)). LAPTT activated partial thromboplastin time, TT thrombin time, FIB fibrinogen, DD D-dimer, AST aspartate aminotransferase, CK creatine kinase, CKMB creatine kinase MB, MYO myoglobin, LDH lactate dehydrogenase, HSTNI hypersensitive troponin I, CRP C-reactive protein, PCT procalcitonin.
Fig. 5
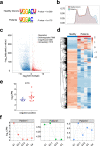
Fig. 5. SFTSV infection affects m6A modification.
a Sequence motifs enriched within m6A peaks identified by m6A-seq. b Metagene profile showing the distribution of m6A peaks across the length of transcripts composed of three transcript segments, i.e., 5′-untranslated region (5′-UTR), CDS, and 3′-untranslated region (3′-UTR), in SFTSV-infection samples. c Volcano plots showing the m6A enrichment in mRNAs of SFTSV-positive samples and healthy controls′ samples. Each dot represents a gene. The abundance of m6A with substantially increase (up) and decreased (down) enrichment are highlighted in red dots and blue dots, respectively (FDR-adjusted p value < 0.05). d Heat map of the peak log2 counts-per-million IP data of all differentially methylated genes. In the differential peaks of m6A, the majority of m6A abundance were downregulated in SFTSV-positive samples. e Each point represents the log2CPM of FTO value for either 4 negative or 7 positive samples (error bars are represented as mean values ± SD, this corresponds to the samples in Fig. 2, p value = 0.07, one-sided t-test). f The FTO CPM levels at different stages in the three patients (this corresponds to the samples in Fig. 3a, b).
Fig. 6
Fig. 6. m6A modifications in SFTSV genome.
a, b The percentage of SFTSV reads in the sequencing samples. The number above the column indicates the number of copies of the virus detected by qPCR of the clinical data. c Genome browser view of m6A-enriched regions in the SFTSV genome.

References

    1. Yu XJ, et al. Fever with thrombocytopenia associated with a novel bunyavirus in China. N. Engl. J. Med. 2011;364:1523–1532. doi: 10.1056/NEJMoa1010095. - DOI - PMC - PubMed
    1. Zhang, L. K. et al. Quantitative proteomic analysis reveals unfolded-protein response involved in severe fever with thrombocytopenia syndrome virus infection. J. Virol.93, 10.1128/JVI.00308-19 (2019). - PMC - PubMed
    1. Xu, M. et al. Establishment of a reverse genetic system of severe fever with thrombocytopenia syndrome virus based on a C4 strain. Virol. Sin.10.1007/s12250-021-00359-x (2021). - PMC - PubMed
    1. Zhan J, et al. Current status of severe fever with thrombocytopenia syndrome in China. Virol. Sin. 2017;32:51–62. doi: 10.1007/s12250-016-3931-1. - DOI - PMC - PubMed
    1. Kim KH, et al. Severe fever with thrombocytopenia syndrome, South Korea, 2012. Emerg. Infect. Dis. 2013;19:1892–1894. doi: 10.3201/eid1911.130792. - DOI - PMC - PubMed

Publication types

MeSH terms

Supplementary concepts