. 2021 Sep 24;12(1):5635.
doi: 10.1038/s41467-021-25932-6.

Breaking a dative bond with mechanical forces

Affiliations

Breaking a dative bond with mechanical forces

Pengcheng Chen et al. Nat Commun. .

Abstract

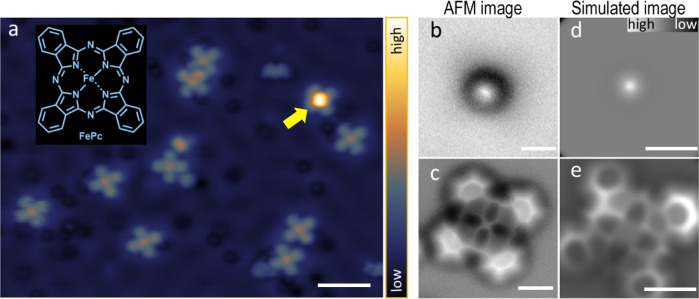
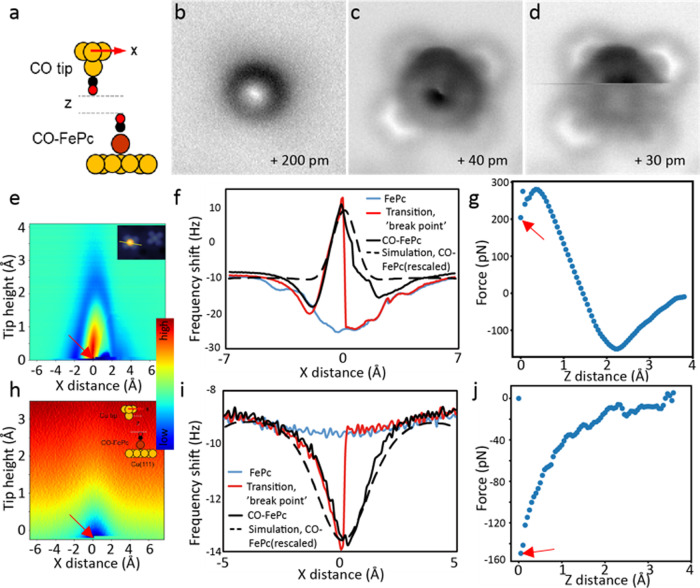
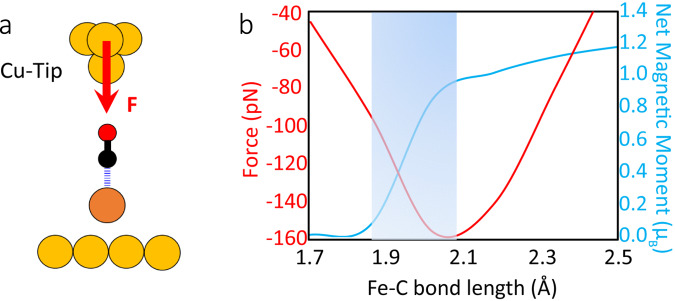
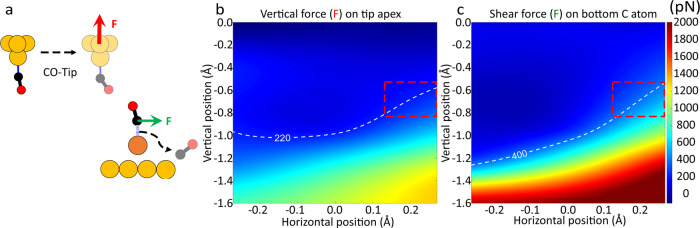
Bond breaking and forming are essential components of chemical reactions. Recently, the structure and formation of covalent bonds in single molecules have been studied by non-contact atomic force microscopy (AFM). Here, we report the details of a single dative bond breaking process using non-contact AFM. The dative bond between carbon monoxide and ferrous phthalocyanine was ruptured via mechanical forces applied by atomic force microscope tips; the process was quantitatively measured and characterized both experimentally and via quantum-based simulations. Our results show that the bond can be ruptured either by applying an attractive force of ~150 pN or by a repulsive force of ~220 pN with a significant contribution of shear forces, accompanied by changes of the spin state of the system. Our combined experimental and computational studies provide a deeper understanding of the chemical bond breaking process.


Conflict of interest statement

The authors declare no competing interests.

Figures

Fig. 1
Fig. 1. STM and AFM images of FePc and the datively bonded CO-FePc complex.
a STM image of the FePc molecule with (indicated by the arrow) and without adsorption of CO, with the insert showing the chemical structure of FePc (set point: Vsample = +100 mV, I = 100 pA, scale bar: 3 nm). b, c Experimental AFM images of FePc with and without adsorbed CO, obtained using a CO-terminated tip (V = 0 V, A = 100 pm, scale bar: 0.5 nm) at tip heights z of +160 pm and -10 pm, respectively. The tip height z was set with respect to a reference height given by the STM set point (100 mV, 100 pA) above the bare Cu(111) substrate in the vicinity of the molecule. The minus sign of tip height z indicates a decrease of tip height. d, e Simulated AFM images corresponding to CO-FePc and FePc at tip heights of 554 pm and 300 pm. The tip height in the simulation is defined as the distance between the front atom of the tip and the average height of the FePc complex (excluding the decorated CO) (scale bar: 0.5 nm).
Fig. 2
Fig. 2. Rupturing the dative CO-FePc bond using AFM tips.
a Schematic of a CO-AFM tip interacting with CO-FePc (Cu: yellow; C: black; O: red; Fe: brown). b–d Non-contact AFM images obtained at different tip heights (z); the final dislodging of CO occurs at z = +30 pm. e 3D force map of the frequency shift (Δf) vs. AFM tip heights (z) and horizontal position (x), with a CO tip. Step size is 5 pm in z, and the scan path in x is across the center of the Fe, as shown in the inset. The tip position at bond rupture is indicated by the breakpoint (arrow). f Frequency shift (Δf) obtained in the horizontal (x) direction before, during (indicated by the disjointed curve), and after the bond rupture. g The force curve deconvoluted from Δf at the breakpoint in the vertical (z) direction. h 3D force map of the frequency shift (Δf) showing quantitative rupture of the dative bond, obtained using a Cu tip; the insert shows schematic of interaction between a Cu tip and CO-FePc. i Frequency shift (Δf) obtained using a Cu tip scanned in the horizontal (x) direction. j The deconvoluted force curve at the breakpoint in the vertical (z) direction using a Cu tip. (Red arrows indicate the bond rupture point. Long-range background forces are subtracted in Figures g and j).
Fig. 3
Fig. 3. Real-space pseudopotential DFT calculations for the breaking of the dative bond in CO-FePc with a Cu tip.
a Schematic showing the interaction of the Cu tip with the CO-FePc complex on Cu(111) (Cu: yellow; C: black; O: red; Fe: brown). The red arrow indicates the attractive force acting on the tip apex. b The red curve shows the calculated attractive vertical force on the Cu apex while the blue curve shows the net magnetic moment as a function of the Fe-C bond length. The shaded area indicates where the bond rupture process occurred.
Fig. 4
Fig. 4. Real-space pseudopotential DFT calculations for the breaking of the dative bond in CO-FePc with a CO tip.
a Schematic shows the interactions between the CO tip and the CO-FePc complex on Cu(111). The red and green arrows indicate the direction of the forces acting on the tip apex and on the bottom C atom, respectively. (Cu: yellow; C: black; O: red; Fe: brown) b, c are line cuts of 3D force map for the calculated compressive vertical force on the tip apex, and the lateral force acting on the bottom C (of the CO attached to FePc). The x and y axes are the horizontal positions and heights of the tip with respect to an equilibrium position. The dashed curves in b and c correspond to the measured force, 220 pN, and where the shear force approaches -400 pN. The red dashed boxes indicate the same region in b and c where the dative bond is most likely to be ruptured.
Fig. 5
Fig. 5. The spin-polarized local density of states projected onto the center Fe atom.
a CO-FePc on Cu(111) with two O-C-Fe angles, 176° (at equilibrium, solid curves) and 154° (manually rotated, Fe-C and C=O bond lengths are fixed during rotation, dashed curves), net magnetic moment = 0.0 µB. b FePc on Cu(111), net magnetic moment = 1.2 µB. c CO-FePc without a substrate, net magnetic moment = 0.0 µB. In a, the top inset shows a 2D vertical profile of the total electron density across the Fe atom. The black arrow indicates a 2D horizontal profile in between the complex and the Cu surface where the red dashed rectangle encloses the two bridge Cu atoms underneath the center Fe. d The HOMO of the system (around the center Fe atom). A wireframe view of the orbitals is overlapped with a 2D vertical profile of the electron density. Electron density figures are presented in Red-Green-Blue scale (red/blue: higher/lower electron density). Isosurface value = 10−5 e/bohr3.

References

    1. Gross L, Mohn F, Moll N, Liljeroth P, Meyer G. The chemical structure of a molecule resolved by atomic force microscopy. Science. 2009;325:1110 LP–1111114. doi: 10.1126/science.1176210. - DOI - PubMed
    1. Giessibl FJ. High-speed force sensor for force microscopy and profilometry utilizing a quartz tuning fork. Appl. Phys. Lett. 1998;73:3956–3958. doi: 10.1063/1.122948. - DOI
    1. Gross L, et al. Organic structure determination using atomic-resolution scanning probe microscopy. Nat. Chem. 2010;2:821–825. doi: 10.1038/nchem.765. - DOI - PubMed
    1. Schuler B, et al. Heavy oil based mixtures of different origins and treatments studied by atomic force microscopy. Energy Fuels. 2017;31:6856–6861. doi: 10.1021/acs.energyfuels.7b00805. - DOI
    1. Hanssen KØ, et al. A combined atomic force microscopy and computational approach for the structural elucidation of breitfussin A and B: highly modified halogenated dipeptides from Thuiaria breitfussi. Angew. Chem. Int. Ed. 2012;51:12238–12241. doi: 10.1002/anie.201203960. - DOI - PubMed