. 2021 Sep 24;11(1):19006.
doi: 10.1038/s41598-021-97774-7.

Sedimentary supply of humic-like fluorescent dissolved organic matter and its implication for chemoautotrophic microbial activity in the Izu-Ogasawara Trench

Affiliations

Sedimentary supply of humic-like fluorescent dissolved organic matter and its implication for chemoautotrophic microbial activity in the Izu-Ogasawara Trench

M Shigemitsu et al. Sci Rep. .

Abstract

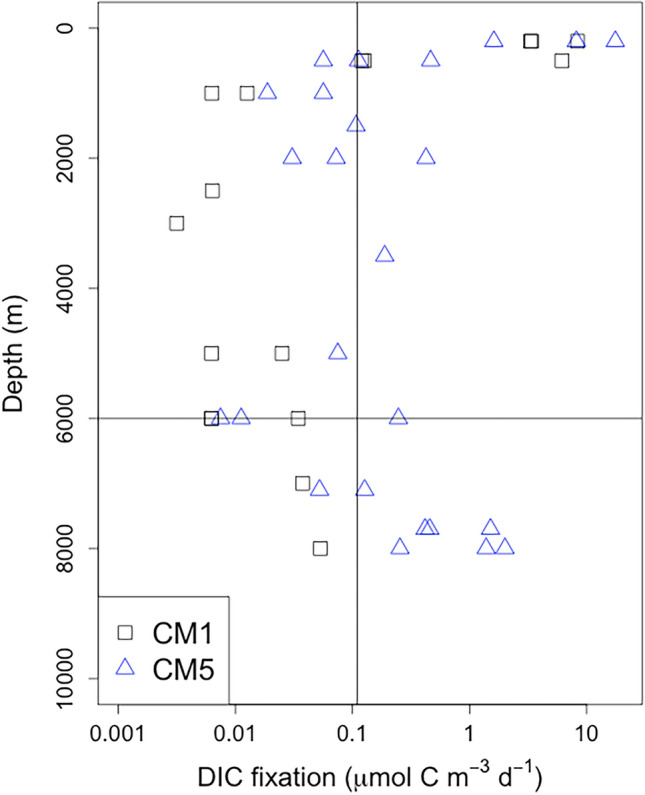
Microbial community structure in the hadal water is reported to be different from that in the upper abyssal water. However, the mechanism governing the difference has not been fully understood. In this study, we investigate the vertical distributions of humic-like fluorescent dissolved organic matter (FDOMH), chemoautotrophic production, apparent oxygen utilization (AOU), and N* in the Izu-Ogasawara Trench. In the upper abyssal waters (< 6000 m), FDOMH has a significantly positive correlation with AOU; FDOMH deviates from the relationship and increases with depth without involving the increment of AOU in the hadal waters. This suggests that FDOMH is transferred from the sediments to the hadal waters through pore water, while the FDOMH is produced in situ in the upper abyssal waters. Chemoautotrophic production and N* increases and decreases with depth in the hadal waters, respectively. This corroborates the effluxes of dissolved substances, including dissolved organic matter and electron donors from sediments, which fuels the heterotrophic/chemoautotrophic microbial communities in the hadal waters. A simple box model analysis reveals that the funnel-like trench topography facilitates the increase in dissolved substances with depth in the hadal waters, which might contribute to the unique microbiological community structure in these waters.


Conflict of interest statement

The authors declare no competing interests.

Figures

Figure 1
Figure 1
Maps of the observation area and sampling sites in this study. The area in the black rectangle in (a) is expanded in (b). CM1, CM5, and CT9 are the stations in the Izu-Ogasawara Trench, and CM3 is the station in the Japan Trench.
Figure 2
Figure 2
Vertical distributions of (a) AOU (μmol kg−1), humic-like FDOM (b) C1 (RU), and (c) C2 (RU). Black squares represent CM1, red circles represent CM3, blue triangles represent CM5, and green diamonds represent CT9.
Figure 3
Figure 3
Vertical profiles of DIC fixation rate. Black squares and blue triangles represent CM1 and CM5, respectively. The horizontal black line represents a depth of 6000 m, and vertical black line represents the detection limit. The detection limit is calculated to be three times the standard deviation of the DPM of blank samples. When the negative values are calculated after the blank corrections, the values are not shown here. Horizontal axis is shown on a logarithmic scale.
Figure 4
Figure 4
Scatter plots (a) between AOU (μmol kg−1) and humic-like FDOM C1 (RU), and (b) between AOU (μmol kg−1) and humic-like FDOM C2 (RU). The open symbols indicate the upper abyssal waters (> 2500 m), and solid symbols indicate the hadal waters. The yellow vertical line in each figure represents the measurement precision of C1 or C2, which was estimated from the standard deviation of the duplicate measurements. The black solid and dashed lines are the regression lines for the data obtained in the depth range of 200–6000 m (C1 = 0.0082 + 6.8 × 10−5AOU, r2 = 0.98, p < 0.001; C2 = 0.0069 + 3.6 × 10−5AOU, r2 = 0.86, p < 0.001 ) and 1000–6000 m (C1 = 0.0108 + 5.7 × 10−5AOU, r2 = 0.99 , p < 0.001; C2 = 0.0066 + 3.6 × 10−5AOU, r2 = 0.80 , p < 0.001), respectively.
Figure 5
Figure 5
Model results for humic-like FDOM C1 (left) and C2 (right): the solid purple circle represents no flux case, solid blue circle exhibits the low flux case, solid green circles are the mid flux case, and solid red demonstrates the high flux case. The open black square with a horizontal line in each box represents the average value of humic-like FDOM measurements with a standard deviation for CM1, and the open blue triangles and open green diamonds represent CM5 and CT9.

References

    1. Hiraoka S, et al. Microbial community and geochemical analyses of trans-trench sediments for understanding the roles of hadal environments. ISME J. 2020;14(3):740–756. doi: 10.1038/s41396-019-0564-z. - DOI - PMC - PubMed
    1. Glud RN, et al. High rates of microbial carbon turnover in sediments in the deepest oceanic trench on Earth. Nat. Geosci. 2013;6(4):284–288. doi: 10.1038/ngeo1773. - DOI
    1. Nunoura T, et al. Hadal biosphere: Insight into the microbial ecosystem in the deepest ocean on Earth. PRC Natl. Acad. Sci. USA. 2015;112:E1230–E1236. doi: 10.1073/pnas.1421816112. - DOI - PMC - PubMed
    1. Kawagucci S, et al. Hadal water biogeochemistry over the Izu-Ogasawara Trench observed with a full-depth CTD-CMS. Ocean Sci. 2018;14(4):575–588. doi: 10.5194/os-14-575-2018. - DOI
    1. Gamo T, Shitashima K. Chemical characteristics of hadal waters in the Izu-Ogasawara Trench of the western Pacific Ocean. Proc. Jpn Acad. Ser. B Phys. Biol. Sci. 2018;94(1):45–55. doi: 10.2183/pjab.94.004. - DOI - PMC - PubMed

Publication types