. 2021 Sep 24;11(1):19022.
doi: 10.1038/s41598-021-98218-y.

PIGN spatiotemporally regulates the spindle assembly checkpoint proteins in leukemia transformation and progression

Affiliations

PIGN spatiotemporally regulates the spindle assembly checkpoint proteins in leukemia transformation and progression

Emmanuel K Teye et al. Sci Rep. .

Abstract

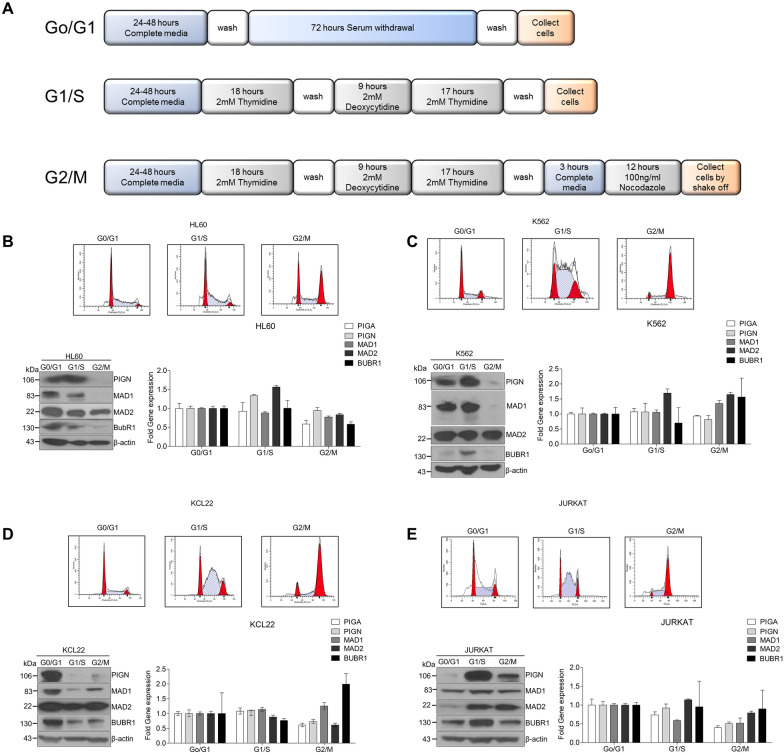
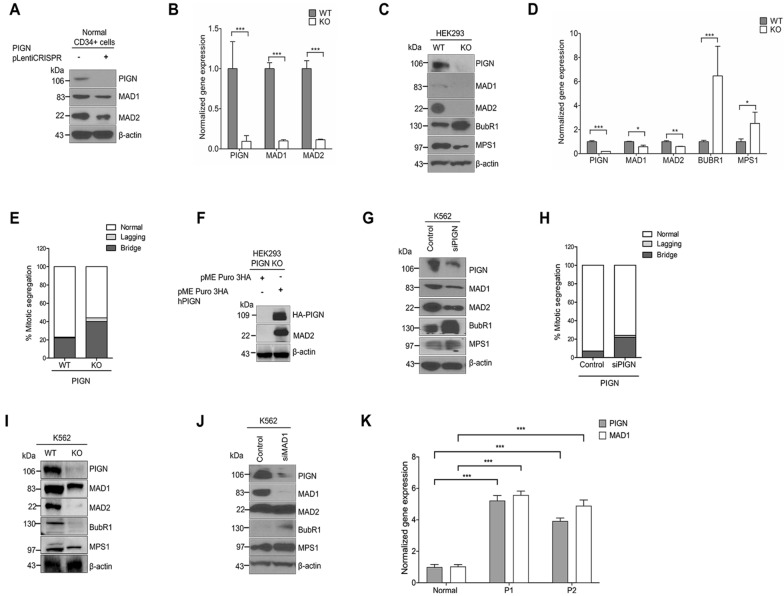
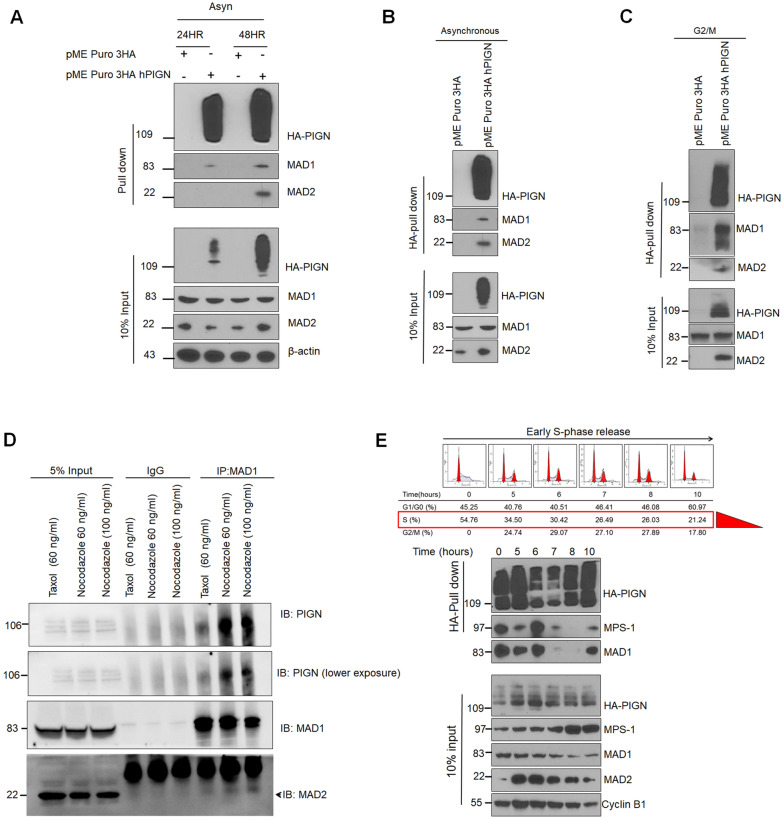
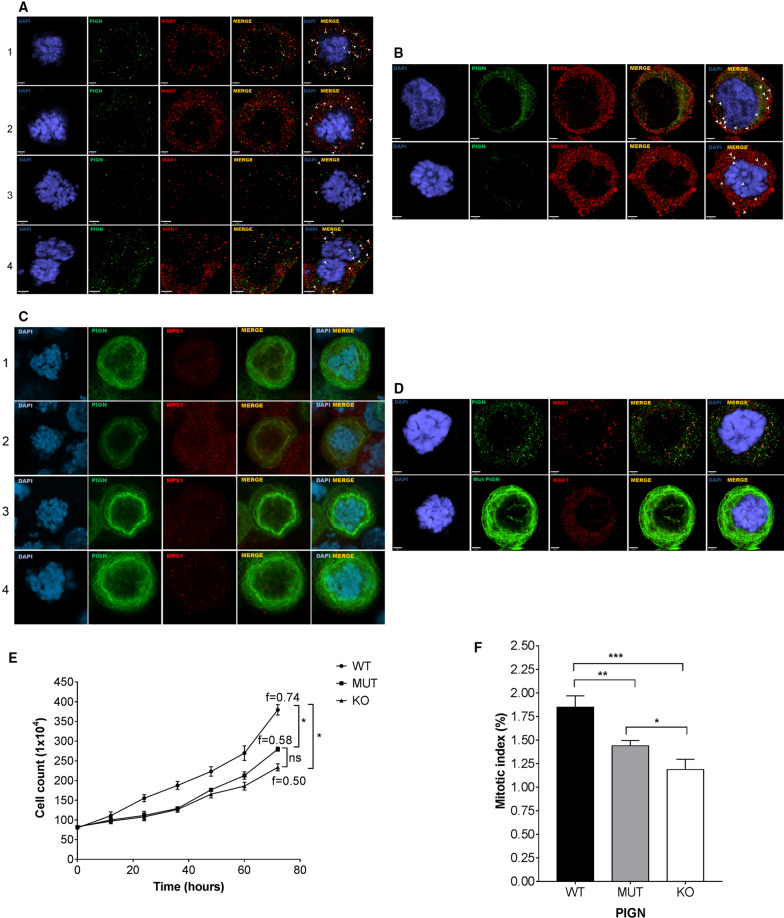
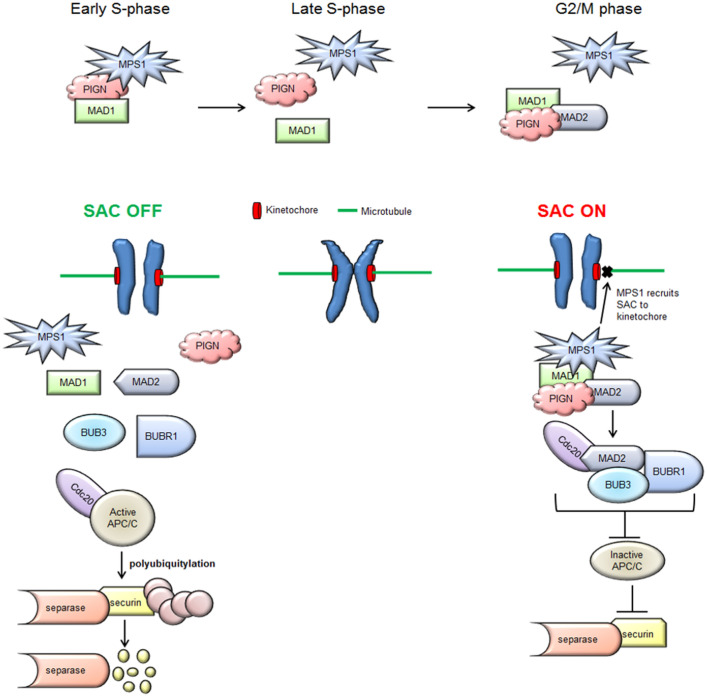
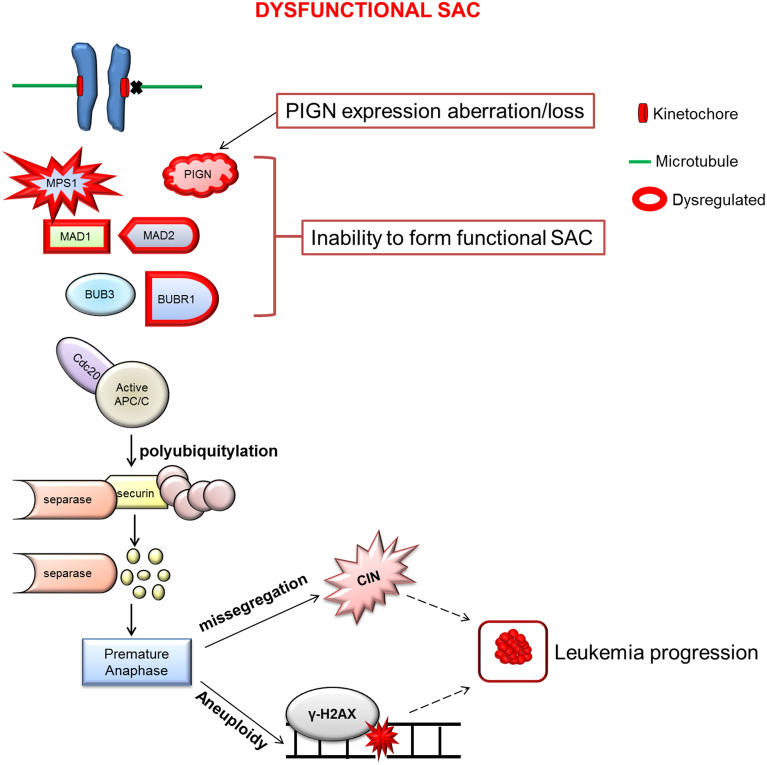
Phosphatidylinositol glycan anchor biosynthesis class N (PIGN) has been linked to the suppression of chromosomal instability. The spindle assembly checkpoint complex is responsible for proper chromosome segregation during mitosis to prevent chromosomal instability. In this study, the novel role of PIGN as a regulator of the spindle assembly checkpoint was unveiled in leukemic patient cells and cell lines. Transient downregulation or ablation of PIGN resulted in impaired mitotic checkpoint activation due to the dysregulated expression of spindle assembly checkpoint-related proteins including MAD1, MAD2, BUBR1, and MPS1. Moreover, ectopic overexpression of PIGN restored the expression of MAD2. PIGN regulated the spindle assembly checkpoint by forming a complex with the spindle assembly checkpoint proteins MAD1, MAD2, and the mitotic kinase MPS1. Thus, PIGN could play a vital role in the spindle assembly checkpoint to suppress chromosomal instability associated with leukemic transformation and progression.


Conflict of interest statement

The authors declare no competing interests.

Figures

Figure 1
Figure 1
PIGN expression is cell cycle regulated. (A) Schematic of cell cycle synchronization protocols. Cell synchronizations were achieved using serum starvation for 72 h (Go/G1), double-thymidine block (G1/S), or double thymidine block and release followed by nocodazole treatment (G2/M). Cells were collected post-treatment for western blotting, RT-qPCR, and flow cytometry analyses. PIGN was expressed in a cell cycle-dependent manner in multiple cell lines: (B) HL60, (C) K562, (D) KCL22, and (E) JURKAT with suppressed expression from early S-phase to the G2/M phase. All western blot images were cut within the molecular weight ranges of the protein targets prior to hybridization. Images generated from these cut blots by scanning the developed films. Images were cropped and labeled using Adobe Photoshop CC 2017 (version 18). Where applicable, representative full images of the blots are presented in Figure 3 of the supplementary immunoblotting data.
Figure 2
Figure 2
PIGN loss or suppression results in the differentially disrupted expression of SAC components. (A) CRISPR/Cas9 ablation of PIGN led to MAD1 and MAD2 downregulation in CD34+ mononuclear cells from a healthy donor. (B) Gene and protein expressions of MAD1 and MAD2 were significantly (***p < 0.0001) impacted by PIGN loss in CD34+ mononuclear cells from a healthy donor. (C,D). Complete loss of PIGN via CRISPR/Cas9 ablation (KO) was associated with downregulation of MAD1, MAD2, and MPS1 while causing an upregulated gene (***p < 0.0001) and protein expression of BUBR1 in HEK293 cells. PIGN loss resulted in significant repression (*p < 0.05) of MAD1 and MAD2 gene expression but led to MPS1 gene upregulation (*p < 0.05). (E) PIGN loss (KO) increased the frequency of segregation errors in HEK293 cells. (F) Ectopic overexpression of PIGN restored MAD2 expression in HEK293 PIGN KO cells. (G) RNAi-mediated PIGN suppression resulted in MAD1 and MAD2 downregulation but increased expression of BUBR1 and MPS1 expression in K562 cells. (H) MAD1 suppression was accompanied by a corresponding decrease in PIGN protein expression in K562 cells. (I) CRISPR/Cas9 ablation of PIGN (K562 KO) resulted in MAD1, BUBR1, and MPS1 downregulation in K562 cells. (J) RNAi-mediated MAD1 suppression in K562 cells resulted in MAD1 downregulation while causing an upregulation in BUbR1 and MPS1 expression. (K) AML-MRC patient CD34+ PBMCs (P1 and P2) with PIGN partial intron retentions showed a significant (***p < 0.0001) increase in PIGN and MAD1 gene expressions compared to non-leukemic control cells from a healthy donor. All western blot images were cut within the molecular weight ranges of the protein targets prior to hybridization. Images generated from these cut blots by scanning the developed films. Images were cropped and labeled using Adobe Photoshop CC 2017 (version 18). Where applicable, representative full images of the blots are presented in Figure 2 of the supplementary immunoblotting data.
Figure 3
Figure 3
PIGN forms a complex with SAC components. MAD1 and MAD2 were co-purified with PIGN in an HA-tag pull-down assay in PIGN null HEK293 cells ectopically expressing 3HA-tagged PIGN. (A,B) HA-tag IP in asynchronous cells indicated optimal 3HA-tagged PIGN expression and co-purification with MAD1 and MAD2 at the 48-h time point. (C) MAD1 and MAD2 were co-purified with PIGN in G2/M synchronized cells. (D) Co-immunoprecipitation (Co-IP) experiment showed that PIGN endogenously interacted with MAD1 and MAD2 during SAC activation via Taxol (60 ng/µl) or nocodazole (60–100 ng/µl) treatment of K562 cells for 12 h. (E) HA-tag pull-down assay with cells released from early S-phase into mitosis indicated PIGN co-purification with MAD1 and MPS1. Inputs represent 5–10% of total protein lysate. All western blot images were cut within the molecular weight ranges of the protein targets prior to hybridization. Images generated from these cut blots by scanning the developed films. Images were cropped and labeled using Adobe Photoshop CC 2017 (version 18). Where applicable, representative full images of the blots are presented in Figure 3 of the supplementary immunoblotting data.
Figure 4
Figure 4
PIGN colocalizes with SAC components during SAC activation. Colocalization (yellow) of PIGN (green) with (A) MAD1 (42% ± 10%), (B) MAD2 (65% ± 9%) and (C) MPS1 (red) in HEK293 cells. HEK293 PIGN KO cells were transfected with pMEPuro3HAPIGN plasmid for 48 h followed by treatment with nocodazole (100 ng/µl) for 12 h. % Colocalization (mean % ± SEM) was calculated based on proportions of overlapping red and green voxels or the object Pearson correlation. (D) Colocalization of the exon 14/15 intron-retaining mutant PIGN (mut PIGN) with MAD1. The mutant plasmid was cloned by inserting a 38 bp partial intron sequence into the wild-type gene in the pMEPuro3HAPIGN plasmid via restriction enzyme digestion and re-ligation. The cells were incubated for 48 h followed by treatment with nocodazole (100 ng/μl) for 12 h. Cells transfected with either mutant or wild-type plasmid were fixed with 4% paraformaldehyde and treated with mouse anti-MAD, anti-MAD2 or anti-MPS1, and rabbit anti-HA, followed by treatment with fluorescently-labeled secondary antibodies. Chromosomes were stained with DAPI (blue). Laser scanning confocal microscopy was used to visualize the stained cells. Scale bars, 2–3 µm. The cells were fixed with 4% paraformaldehyde and treated with mouse anti-MAD, anti-MAD2 or anti-MPS1, and rabbit anti-HA, followed by treatment with the respective fluorescently-labeled secondary antibodies. Chromosomes were stained with DAPI (blue). Laser scanning confocal microscopy was used to visualize the stained cells, and image analyses were conducted using the Volocity 6.3 High-performance 3D imaging software (PerkinElmer). All images were deconvolved and imaging analyses performed with Huygens Professional version 19.04 (Scientific Volume Imaging, The Netherlands, http://svi.nl). Scale bars, 2-3 µm. N.D = not determined. (E) PIGN loss in HEK293 cells decreased cell cycle frequency in HEK293 cells. Cell cycle frequency (1/day) was significantly lower in HEK293 KO cells ectopically overexpressing the PIGN mutant (MUT) (*p = 0.0276) or empty vector (KO) control (*p = 0.0444) compared to those expressing wild-type PIGN (WT). Mean cell counts were obtained over 3 days at 12-h intervals in three separate experiments (n = 3). The cell cycle frequency (f) was calculated using the formula f=lnNt/Noln2×1t derived from the formula Nt = N0 2tf where Nt is the number of cells at time t, N0 is the initial number of cells and f is the frequency of cell cycles per unit time. M. Beals, L. Gross, S. Harrell. 1999. Quantifying cell division. Error bars indicate mean and standard deviation. (F) Mitotic index was significantly reduced in HEK293 KO cells ectopically overexpressing mutant PIGN (MUT) (**p = 0.0056) or empty control vector (KO) (***p = 0.0004) compared to wildtype (WT) PIGN. Error bars are representative of the mean and standard error from the mean in three independent experiments (n = 3).
Figure 5
Figure 5
Simplified model of the spatiotemporal interaction between PIGN and SAC components during the cell cycle and SAC activation. PIGN interacts with SAC components in a time-dependent manner and may at some time points exclude interaction with MAD2.
Figure 6
Figure 6
Model summarizing the relationship between PIGN expression aberration, SAC regulation, and leukemia progression. PIGN depletion results in SAC dysregulation and ultimately results in segregation errors and aneuploidy which contribute to leukemia progression. PIGN plays a vital role in the regulation of mitotic integrity to maintain chromosomal stability.

References

    1. Yada T, et al. Its8, a fission yeast homolog of Mcd4 and Pig-n, is involved in GPI anchor synthesis and shares an essential function with calcineurin in cytokinesis. J. Biol. Chem. 2001;276:13579–13586. doi: 10.1074/jbc.M009260200. - DOI - PubMed
    1. Ihara S, et al. PIGN prevents protein aggregation in the endoplasmic reticulum independently of its function in the GPI synthesis. J. Cell Sci. 2016 doi: 10.1242/jcs.196717. - DOI - PubMed
    1. Burrell RA, et al. Replication stress links structural and numerical cancer chromosomal instability. Nature. 2013;494:492–496. doi: 10.1038/nature11935. - DOI - PMC - PubMed
    1. Hanahan D, Weinberg RA. Hallmarks of cancer: The next generation. Cell. 2011;144:646–674. doi: 10.1016/j.cell.2011.02.013. - DOI - PubMed
    1. Negrini S, Gorgoulis VG, Halazonetis TD. Genomic instability–an evolving hallmark of cancer. Nat. Rev. Mol. Cell Biol. 2010;11:220–228. doi: 10.1038/nrm2858. - DOI - PubMed

Publication types

MeSH terms