. 2021 Sep 24;11(1):19045.
doi: 10.1038/s41598-021-98021-9.

Inferring entire spiking activity from local field potentials

Affiliations

Inferring entire spiking activity from local field potentials

Nur Ahmadi et al. Sci Rep. .

Abstract

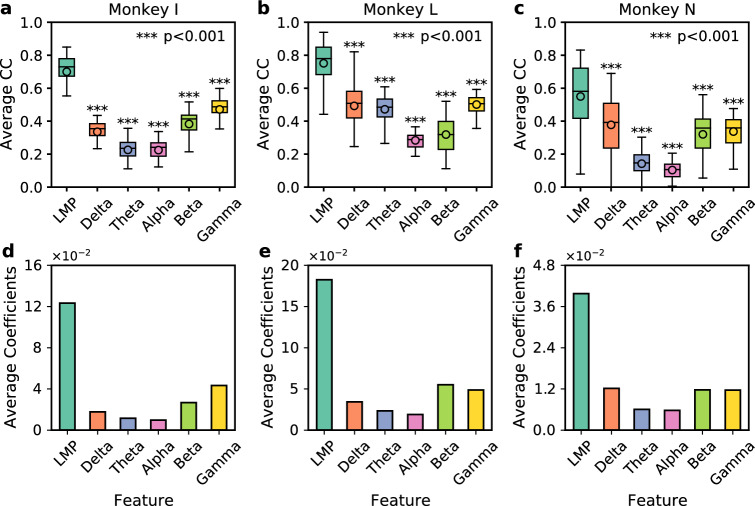
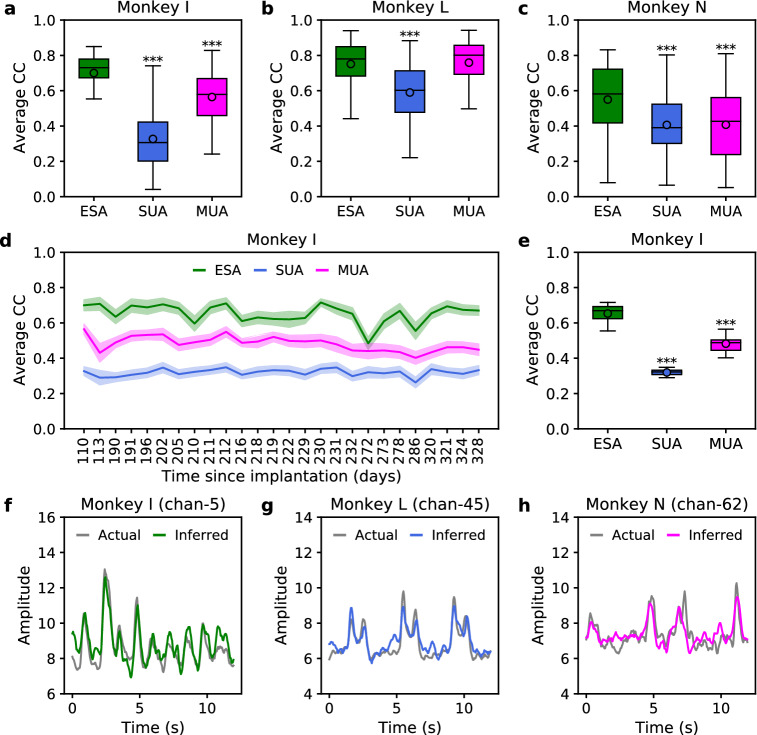
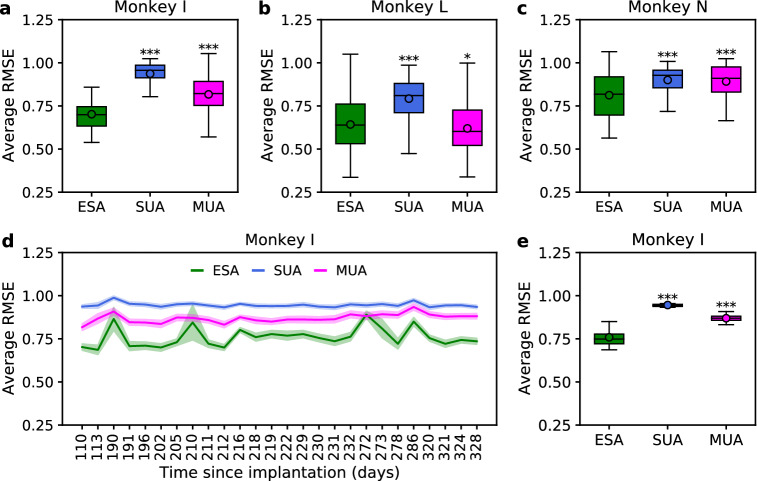
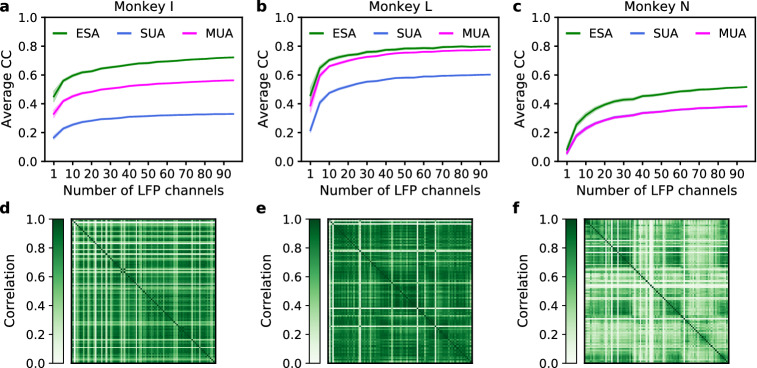
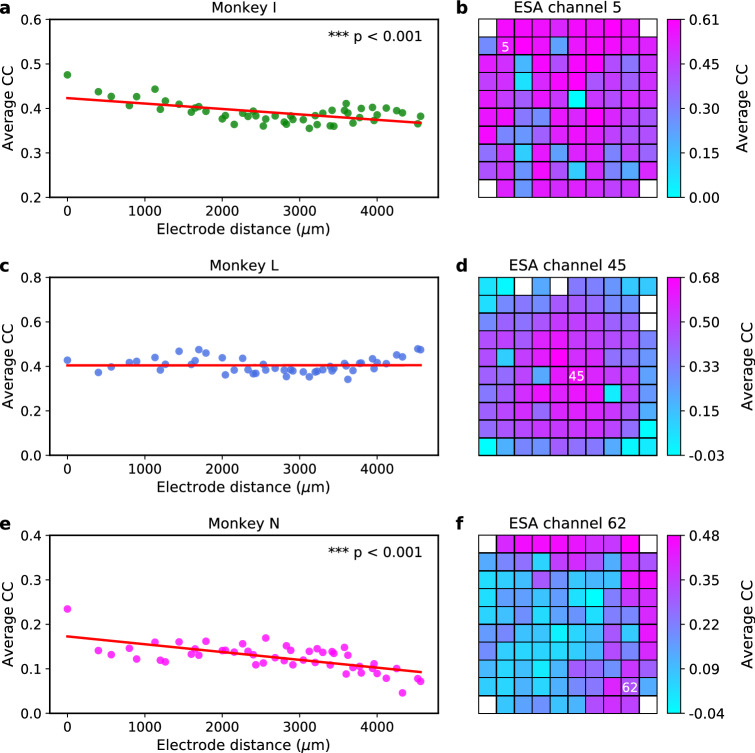
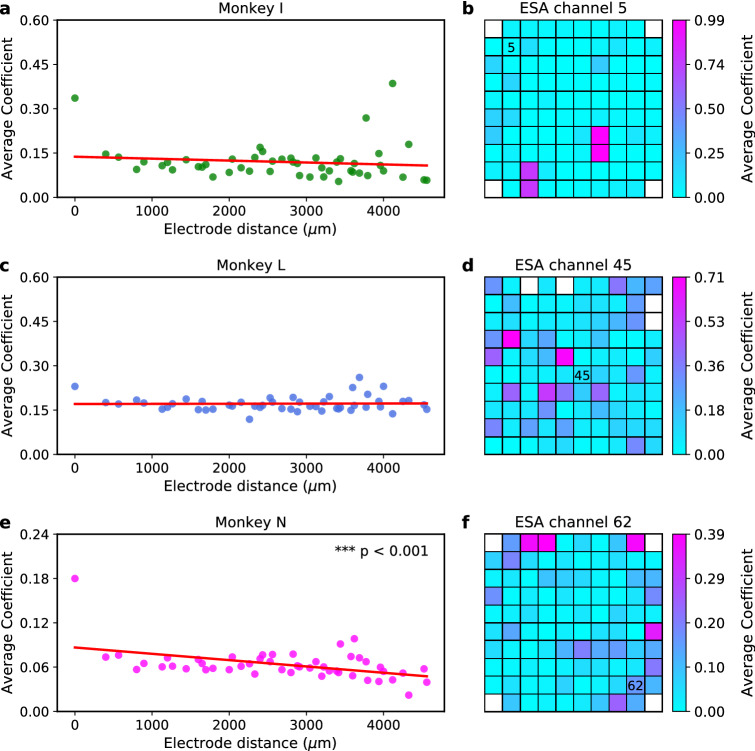
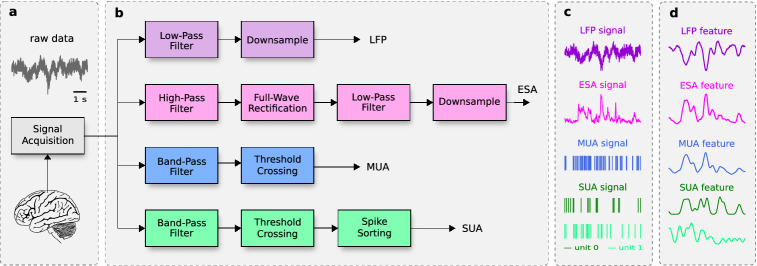
Extracellular recordings are typically analysed by separating them into two distinct signals: local field potentials (LFPs) and spikes. Previous studies have shown that spikes, in the form of single-unit activity (SUA) or multiunit activity (MUA), can be inferred solely from LFPs with moderately good accuracy. SUA and MUA are typically extracted via threshold-based technique which may not be reliable when the recordings exhibit a low signal-to-noise ratio (SNR). Another type of spiking activity, referred to as entire spiking activity (ESA), can be extracted by a threshold-less, fast, and automated technique and has led to better performance in several tasks. However, its relationship with the LFPs has not been investigated. In this study, we aim to address this issue by inferring ESA from LFPs intracortically recorded from the motor cortex area of three monkeys performing different tasks. Results from long-term recording sessions and across subjects revealed that ESA can be inferred from LFPs with good accuracy. On average, the inference performance of ESA was consistently and significantly higher than those of SUA and MUA. In addition, local motor potential (LMP) was found to be the most predictive feature. The overall results indicate that LFPs contain substantial information about spiking activity, particularly ESA. This could be useful for understanding LFP-spike relationship and for the development of LFP-based BMIs.


Conflict of interest statement

The authors declare no competing interests.

Figures

Figure 1
Figure 1
Comparison of ESA inference across different LFP features from three subjects. (ac) Boxplot comparison of average CC across LFP features from monkey I, L, and N, respectively. Asterisks indicate LFP features whose inference performance differed significantly from that of LMP (***p<0.001). The horizontal lines and circles within the boxes indicate the median and mean, respectively. The boxes represent interquartile range (IQR) from 25th to 75th percentiles. The whisker extends 1.5 times the IQR. (df) Bar plot comparison of average coefficients (i.e. weights) across LFP features from monkey I, L, and N, respectively.
Figure 2
Figure 2
Comparison of inference performance in terms of average CC among different types of spiking activity across three subjects. (ac) Boxplot comparison of average CC among ESA, SUA, and MUA from monkey I, L, and N, respectively. (d) Comparison of average CC among ESA, SUA, and MUA from monkey I over 26 recording sessions. (e) Boxplot comparison of average CC across 26 recording sessions. Asterisks indicate spiking activity whose inference performance differed significantly from that of ESA (***p<0.001). (fh) A snippet example of actual and inferred ESA from monkey I (channel 5), monkey L (channel 45), and monkey N (channel 62), respectively.
Figure 3
Figure 3
Comparison of inference performance in terms of average RMSE among different types of spiking activity across three subjects. (ac) Boxplot comparison of average RMSE among ESA, SUA, and MUA from monkey I, L, and N, respectively. (d) Comparison of average RMSE among ESA, SUA, and MUA from monkey I over 26 recording sessions. (e) Boxplot comparison of average RMSE across 26 recording sessions. Asterisks indicate spiking activity whose inference performance differed significantly from that of ESA (*p<0.05, ***p<0.001).
Figure 4
Figure 4
Impact of different number of LFP channels on inference performance (measured in average CC) across subjects. (ac) Comparison of average CC among ESA, SUA, and MUA from monkey I, L, and N, respectively. The shaded areas represent 95% confidence intervals from 30 iterations. (df) Comparison of LFP interchannel correlation for monkey I, L, and N, respectively.
Figure 5
Figure 5
LFP channel importance score (quantified in terms of average CC) for ESA inference across subjects. (a,c,e) Scatter plot of LFP importance score over inter-electrode distance (μm) from monkey I, L, and N, respectively. Red solid lines represent linear regression lines used to test whether or not there is a significant linear trend between inter-electrode distance and LFP channel importance score. Asterisks indicate that there is a significant linear trend (two-tailed one-sample t test; **p<0.01, ***p<0.001). (b,d,f) Examples of heatmap of LFP channel importance score for ESA inference from monkey I (channel 5), monkey L (channel 45), and monkey N (channel 62), respectively. The importance score is mapped onto a 10×10 grid spatially corresponding to Utah electrode array configuration. white numbers inside the grids denote the ESA channel being inferred. White boxes on the grid represent unused (unconnected) electrodes. The larger the average CC, the more important is the channel for the inference.
Figure 6
Figure 6
LFP channel importance score (quantified in terms of average coefficient) for ESA inference across subjects. (a,c,e) Scatter plot of LFP importance score over inter-electrode distance (μm) from monkey I, L, and N, respectively. Red solid lines represent linear regression lines used to test whether or not there is a significant linear trend between inter-electrode distance and LFP channel importance score. Asterisks indicate that there is a significant linear trend (two-tailed one-sample t test; ***p<0.001). (b,d,f) Examples of heatmap of LFP channel importance score for ESA inference from monkey I (channel 5), monkey L (channel 45), and monkey N (channel 62), respectively. The importance score is mapped onto a 10×10 grid spatially corresponding to Utah electrode array configuration. Black numbers inside the grids denote the ESA channel being inferred. White boxes on the grid represent unused (unconnected) electrodes. The larger the average coefficient, the more important is the channel for the inference.
Figure 7
Figure 7
Schematic illustration of signal processing and feature extraction steps. (a) Raw neural signal acquisition from the motor cortex area of monkeys with a 96-channel intracortical Utah array. (b) Signal processing steps for different types of neural signals (LFP, ESA, MUA, and SUA). (c) LFP, ESA, MUA, and SUA signals obtained from the processing steps. (d) Extracted features from LFP, ESA, MUA, and SUA signals.

References

    1. Schwarz DA, et al. Chronic, wireless recordings of large-scale brain activity in freely moving rhesus monkeys. Nat. Methods. 2014;11:670. doi: 10.1038/nmeth.2936. - DOI - PMC - PubMed
    1. Obien MEJ, Deligkaris K, Bullmann T, Bakkum DJ, Frey U. Revealing neuronal function through microelectrode array recordings. Front. Neurosci. 2015;8:423. doi: 10.3389/fnins.2014.00423. - DOI - PMC - PubMed
    1. Seymour JP, Wu F, Wise KD, Yoon E. State-of-the-art mems and microsystem tools for brain research. Microsyst. Nanoeng. 2017;3:16066. doi: 10.1038/micronano.2016.66. - DOI - PMC - PubMed
    1. Mitzdorf U. Current source-density method and application in cat cerebral cortex: Investigation of evoked potentials and EEG phenomena. Physiol. Rev. 1985;65:37–100. doi: 10.1152/physrev.1985.65.1.37. - DOI - PubMed
    1. Lindén H, et al. Modeling the spatial reach of the LFP. Neuron. 2011;72:859–872. doi: 10.1016/j.neuron.2011.11.006. - DOI - PubMed

Publication types