Review
. 2021 Oct;16(10):4799-4832.
doi: 10.1038/s41596-021-00597-z. Epub 2021 Sep 24.

A practical guide to large-scale docking

Affiliations
Review

A practical guide to large-scale docking

Brian J Bender et al. Nat Protoc. 2021 Oct.

Erratum in

Abstract

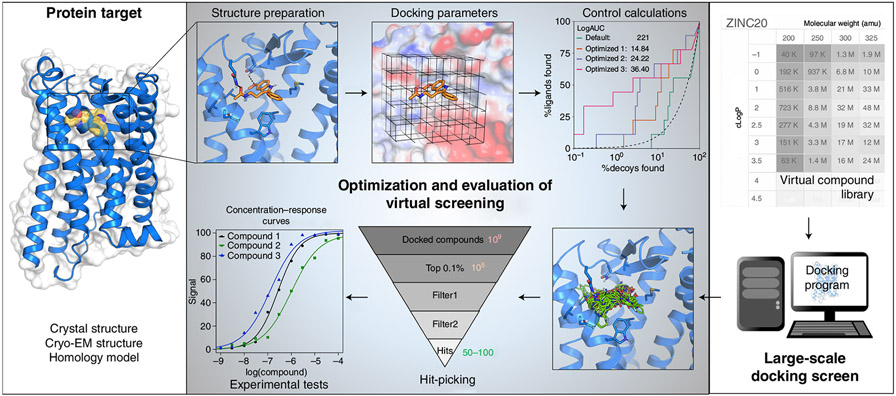
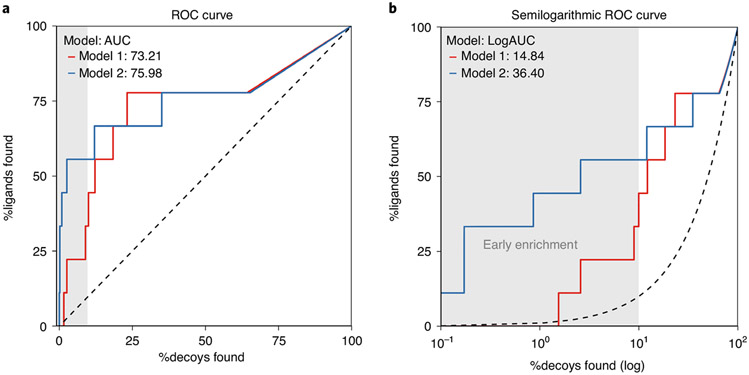
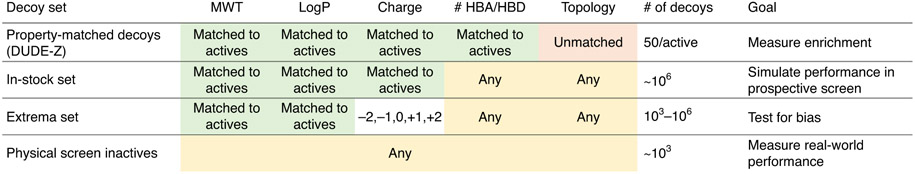
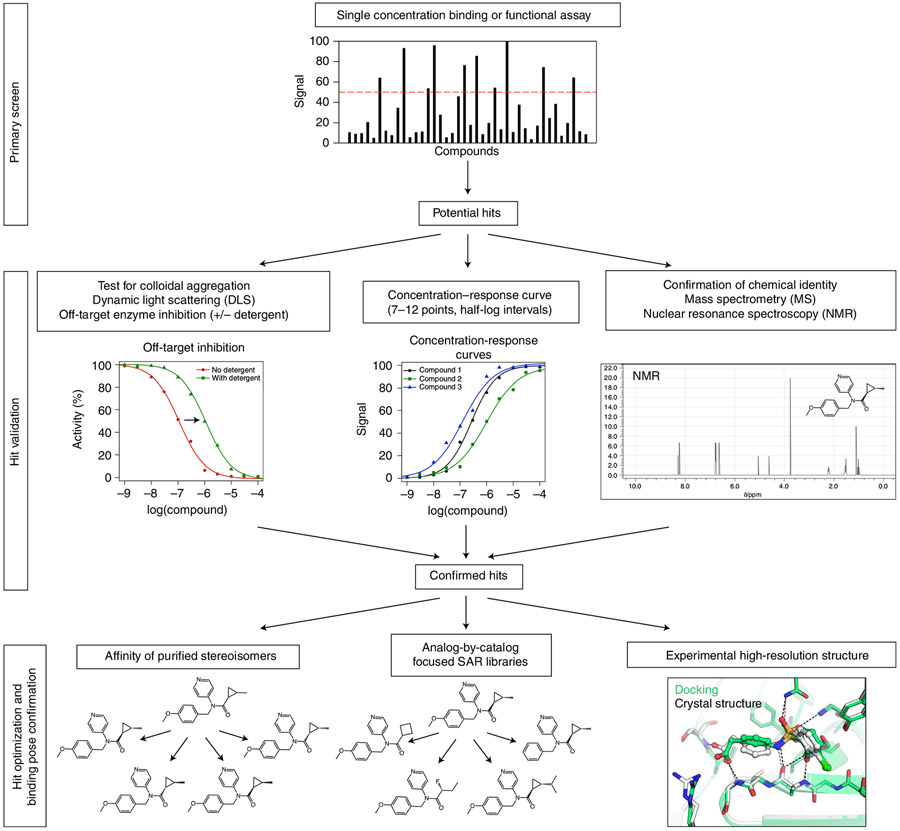
Structure-based docking screens of large compound libraries have become common in early drug and probe discovery. As computer efficiency has improved and compound libraries have grown, the ability to screen hundreds of millions, and even billions, of compounds has become feasible for modest-sized computer clusters. This allows the rapid and cost-effective exploration and categorization of vast chemical space into a subset enriched with potential hits for a given target. To accomplish this goal at speed, approximations are used that result in undersampling of possible configurations and inaccurate predictions of absolute binding energies. Accordingly, it is important to establish controls, as are common in other fields, to enhance the likelihood of success in spite of these challenges. Here we outline best practices and control docking calculations that help evaluate docking parameters for a given target prior to undertaking a large-scale prospective screen, with exemplification in one particular target, the melatonin receptor, where following this procedure led to direct docking hits with activities in the subnanomolar range. Additional controls are suggested to ensure specific activity for experimentally validated hit compounds. These guidelines should be useful regardless of the docking software used. Docking software described in the outlined protocol (DOCK3.7) is made freely available for academic research to explore new hits for a range of targets.


Conflict of interest statement

Competing interests

B.K.S. and J.J.I. are founders of Blue Dolphin Lead Discovery LLC, which undertakes fee-for-service ligand discovery.

Figures

Fig. 1 ∣
Fig. 1 ∣. Large library docking workflow.
The two required inputs for such a screen are the target structure and a screening database. Prior to using the database, the target structure must be converted into a representation used by the docking software and the pocket should be optimized with control calculations using retrospective analysis on known actives. After the prospective library has been docked, top-ranked hits can be filtered and selected for experiment. Multiple assays and controls are typically necessary to confirm activity.
Fig. 2 ∣
Fig. 2 ∣. Enrichment of actives against decoys.
a, ROC curves for two models used for retrospective docking screens plotting the rate of true positives found against decoys found. The AUC can be used to describe the ability of the models to identify true positive, known ligands against a background of decoys. In this format, the two models have similar AUCs, suggesting similar performance. b, Semilogarithmic ROC curves focus on the early enrichment, i.e., determine if true positives are identified within the e.g. top 10% (gray area) of docked decoys. The LogAUC is calculated as the difference between the semilogarithmic AUC of the model and the random semilogarithmic AUC (dashed line). In this format, it is clear that model 2 outperforms model 1 in early enrichment with a LogAUC value more than double of model 1.
Fig. 3 ∣
Fig. 3 ∣. Control sets for retrospective docking calculations.
For DUDE-Z decoys, properties of the decoys are either forced to match (green) or be different (red). Properties that are neither selected for or against are highlighted in yellow. In the Extrema set, the charge state is explicitly sampled.
Fig. 4 ∣
Fig. 4 ∣. Suggested experimental validation of docking hits.
In general, a primary screen will use a limited number of compound concentrations to test for activity at a target. Compounds that pass a set threshold of activity in the primary screen will be moved forward to secondary confirmation of activity that is not attributed to colloidal aggregation. Identity of the compound should be confirmed if it passes these stages and before proceeding to optimization by stereoisomer purification, selection of analogs and/or experimental structure determination.
Fig. 5 ∣
Fig. 5 ∣. Outline of the procedure for DOCK3.7 virtual ligand discovery campaigns.
Collecting and preparing materials (blue) requires obtaining a structure or model and ligand control sets and setting them up for retrospective control calculations (yellow). In each control calculation, modifications may demand returning to a previous step and reoptimizing. In the absence of known actives for robust retrospective analysis, one may jump to testing the prospective performance with a small library. With a final setup, large-scale prospective screening (orange) can proceed, followed by in vitro testing of docking hits (green). The numbers refer to steps described in the Procedure.
Fig. 6 ∣
Fig. 6 ∣. Controls for docking optimization.
a, The receptor (blue) is shown with the crystallized ligand (orange). Docked control actives are shown in green and yield similar poses and interactions as the crystal ligand. The two residues, Asn162 and Gln181, that have their dipoles artificially increased (‘polarized’) to enhance the weight of polar interactions are shown hydrogen bonding to the crystal ligand. b, A log-transformed ROC plot is shown comparing the rate of identifying ligands versus decoys. A random selection would follow the dashed black line. The area under this dashed line is subtracted from the values reported for LogAUC such that a curve above the line would have a positive LogAUC, a curve below the line would have a negative LogAUC, and a curve following the dashed line would yield a LogAUC value of zero. Shown are the curves for the default settings and optimized settings for either the DUDE-Z control set and the Extrema control set. In both cases, the overall LogAUC value increases and the early enrichment improves. c, The energy distribution breakdown shows the individual score terms for each scored molecule in the docked setup. Based on this breakdown, it is clear that VDW interactions primarily drive ligand recognition. However, in the optimized setup in which electrostatic spheres with a radius of 1.9 that extend the dielectric boundary are used, the electrostatic score term shifts to more negative values. The desolvation spheres at the dielectric boundary in the optimized setup, with a radius of 0.1, have only minor effects on the ligand desolvation score term. d, In the Extrema challenge, the top-ranking ligands are plotted by their charge and DOCK score. In the Default settings, there is a preference for neutral ligands followed closely by monocations. The Optimized settings enhance the preference for neutrals.
Fig. 7 ∣
Fig. 7 ∣. Matching and dielectric boundary spheres drive changes to sampling and scoring in DOCK3.7.
a, the crystal ligand is shown as orange sticks in the receptor pocket (gray). Matching spheres derived from the coordinates of the crystal ligand are shown in yellow and remain fixed during sphere perturbation. Random spheres (blue) are calculated with the program SphGen, and a set of spheres are selected that are near the crystal ligand. In a matching sphere scan, only the random spheres are perturbed and a new set is obtained (green). b, the crystal ligand (orange) is again shown in the context of the receptor binding pocket (gray). Dielectric boundary spheres (cyan) cover the binding surface around the crystal ligand to alter the electrostatic or desolvation potentials at the boundary between solvent and protein.
Fig. 8 ∣
Fig. 8 ∣. Polarizing effects specific atoms’ electrostatic potential.
In contrast to global modifications to the electrostatic potential with the incorporation of thin spheres, polarizing allows for very specific modifications to a residue’s charge status. A canonical asparagine (ASN) from the prot.table.ambcrg.ambH file is shown with its polarized version ASM in which the carbonyl becomes more electronegative while the amide hydrogens become more electropositive to maintain the overall charge. The electrostatic potential corresponding to each atom is shown as spheres, with red corresponding to negative charge and blue corresponding to positive charge.
Fig. 9 ∣
Fig. 9 ∣. Navigating the ZINC20 Tranche Viewer.
Several options are available at http://zinc20.docking.org/tranches/home/ for selecting different subsets of ligands for virtual screening. Important criteria such as selecting between 2D/3D, purchasability, charge, molecular weight and logP are highlighted. To download compounds, different methods such as downloading as an index file or directly downloading with cURL and WGET are shown.

References

    1. Mayr LM & Bojanic D Novel trends in high-throughput screening. Curr. Opin. Pharmacol 9, 580–588 (2009). - PubMed
    1. Keserü GM & Makara GM The influence of lead discovery strategies on the properties of drug candidates. Nat. Rev. Drug Discov 8, 203–212 (2009). - PubMed
    1. Keiser MJ, Irwin JJ & Shoichet BK The chemical basis of pharmacology. Biochemistry 49, 10267–10276 (2010). - PMC - PubMed
    1. Bohacek RS, McMartin C & Guida WC The art and practice of structure-based drug design: a molecular modeling perspective. Med. Res. Rev 16, 3–50 (1996). - PubMed
    1. Brenner S & Lerner RA Encoded combinatorial chemistry. Proc. Natl Acad. Sci. USA 89, 5381–5383 (1992). - PMC - PubMed

MeSH terms