. 2021 Nov;54(11):e13134.
doi: 10.1111/cpr.13134. Epub 2021 Sep 25.

D-mannose alleviates osteoarthritis progression by inhibiting chondrocyte ferroptosis in a HIF-2α-dependent manner

Affiliations

D-mannose alleviates osteoarthritis progression by inhibiting chondrocyte ferroptosis in a HIF-2α-dependent manner

Xueman Zhou et al. Cell Prolif. 2021 Nov.

Abstract

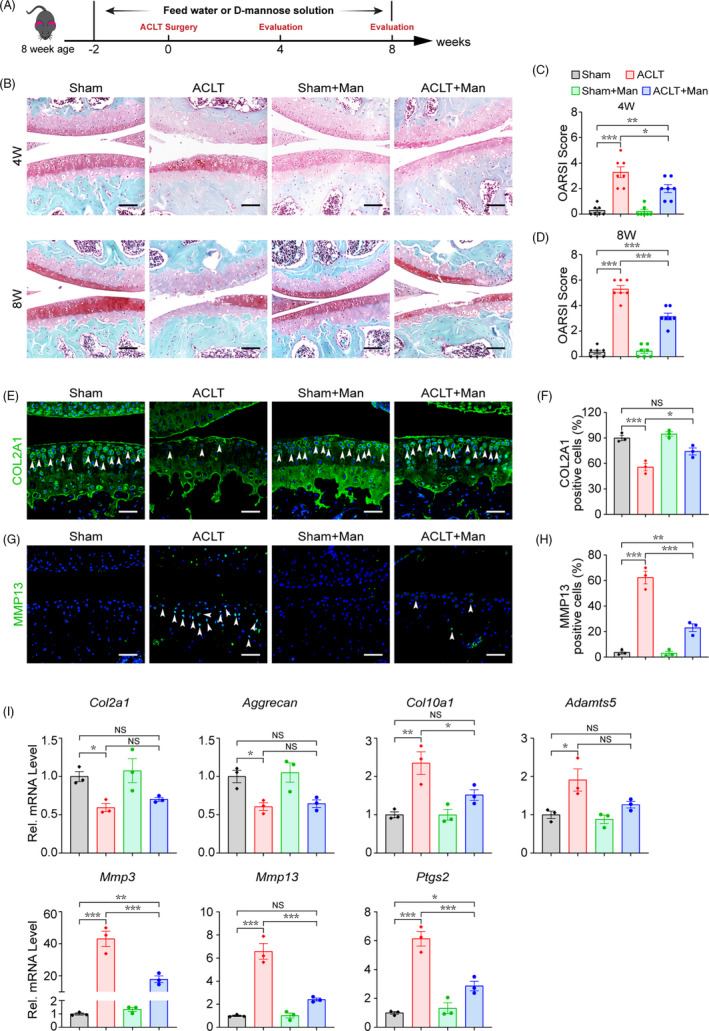
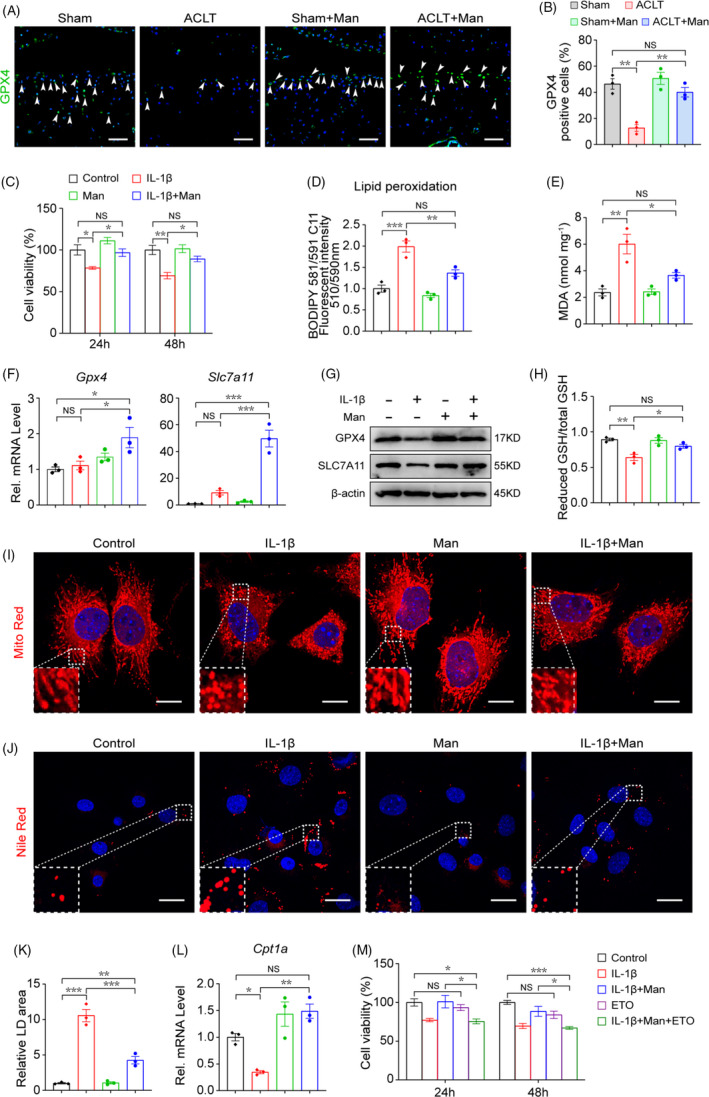
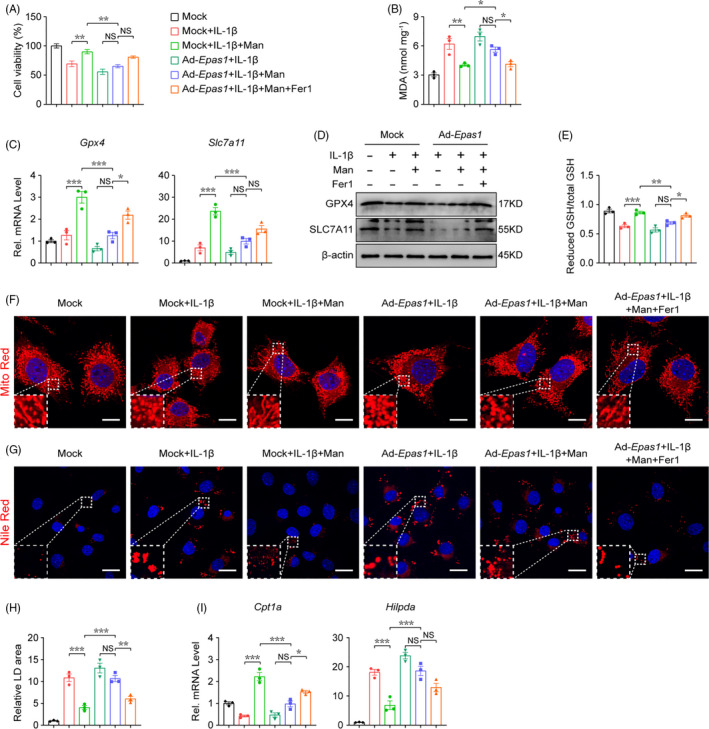
Objectives: Chondrocyte ferroptosis contributes to osteoarthritis (OA) progression, and D-mannose shows therapeutic value in many inflammatory conditions. Here, we investigated whether D-mannose interferes in chondrocyte ferroptotic cell death during osteoarthritic cartilage degeneration.

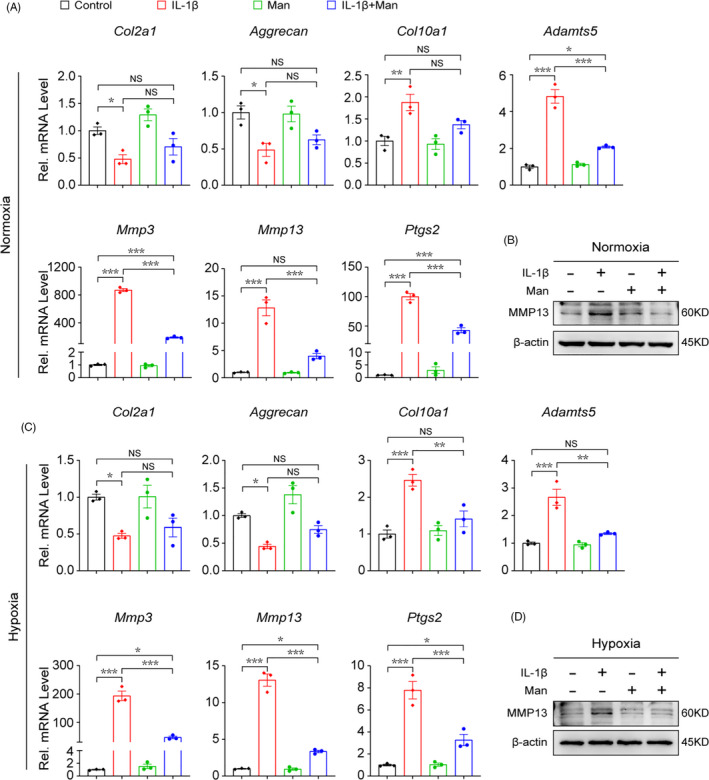
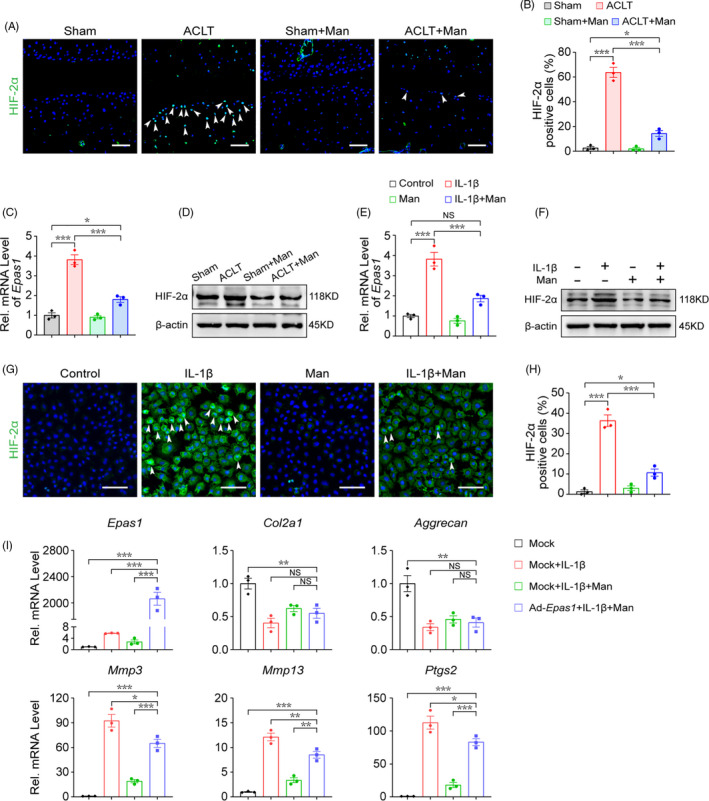
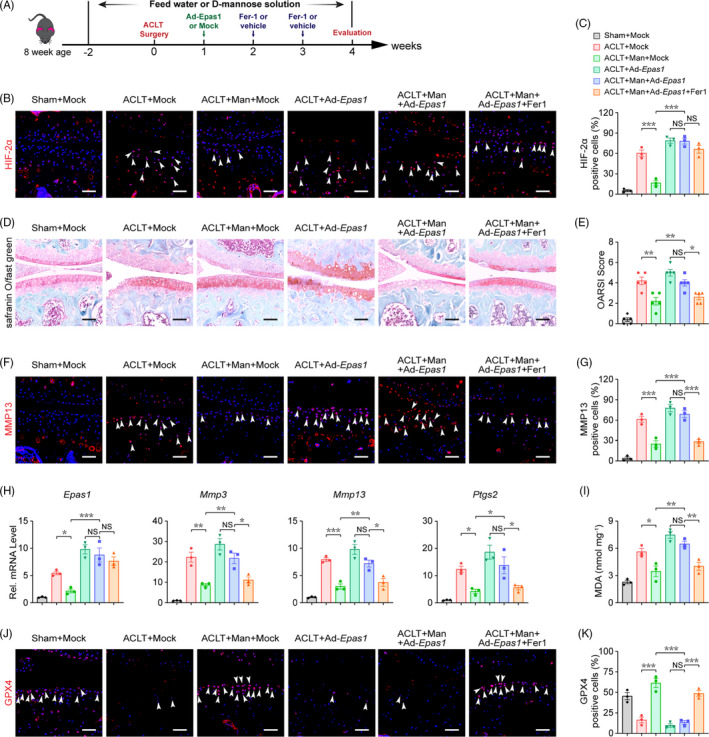
Materials and methods: In vivo anterior cruciate ligament transection (ACLT)-induced OA mouse model and an in vitro study of chondrocytes in an OA microenvironment induced by interleukin-1β (IL-1β) exposure were employed. Combined with Epas1 gene gain- and loss-of-function, histology, immunofluorescence, quantitative RT-PCR, Western blot, cell viability and flow cytometry experiments were performed to evaluate the chondroprotective effects of D-mannose in OA progression and the role of hypoxia-inducible factor 2 alpha (HIF-2 α) in D-mannose-induced ferroptosis resistance of chondrocytes.

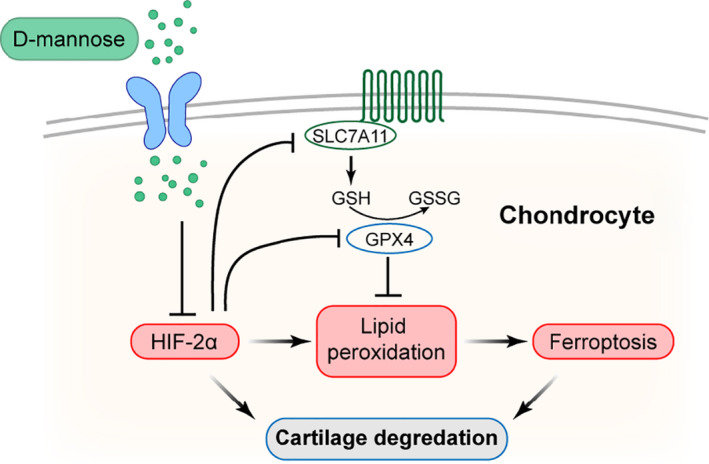
Results: D-mannose exerted a chondroprotective effect by attenuating the sensitivity of chondrocytes to ferroptosis and alleviated OA progression. HIF-2α was identified as a central mediator in D-mannose-induced ferroptosis resistance of chondrocytes. Furthermore, overexpression of HIF-2α in chondrocytes by Ad-Epas1 intra-articular injection abolished the chondroprotective effect of D-mannose during OA progression and eliminated the role of D-mannose as a ferroptosis suppressor.

Conclusions: D-mannose alleviates osteoarthritis progression by suppressing HIF-2α-mediated chondrocyte sensitivity to ferroptosis, indicating D-mannose to be a potential therapeutic strategy for ferroptosis-related diseases.


Conflict of interest statement

The authors declare no competing interests.

Figures

FIGURE 1
FIGURE 1
D‐mannose alleviates OA progression and cartilage degeneration in the mouse ACLT model. (A) Schematic model of the time course for establishment of the anterior cruciate ligament transection (ACLT) model of OA mouse treated with D‐mannose (Man) by administration in drinking water. (B) Representative safranin O/fast green staining of sham and ACLT‐induced OA mice treated with/without D‐mannose administration 4 or 8 weeks post‐surgery. Scale bars, 200 μm. (C and D) Osteoarthritis Research Society International (OARSI) score evaluated based on Safranin O/fast green staining (C) 4 or (D) 8 weeks post‐surgery. n = 7. (E and F) (E) Representative immunofluorescence staining of COL2A1 in knee joint 4 weeks post‐surgery and (F) quantification. Arrow heads indicated positive cells. n = 3. Scale bars, 100 μm. (G and F) (G) Representative immunofluorescence staining of MMP13 in knee joint 4 weeks post‐surgery and (H) quantification. Arrow heads indicated positive cells. n = 3. Scale bars, 100 μm. (I) Quantitative RT‐PCR analyses of the gene expression of knee joint cartilage tissues 4 weeks post‐surgery. n = 3. All quantified data are shown as mean ± SEM; NS, not significant, *p < 0.05, **p < 0.01, ***p < 0.001 by one‐way ANOVA followed by the Tukey‐Kramer test
FIGURE 2
FIGURE 2
D‐mannose suppresses IL‐1β‐induced catabolism of chondrocyte. (A and B) (A) Quantitative RT‐PCR of the gene expression and (B) Western blot analyses of MMP13 of chondrocytes under normoxia cultured conditions 24 h post indicated treatment. n = 3. (C and D) (C) Quantitative RT‐PCR of the gene expression and (D) Western blot analyses of MMP13 of chondrocytes under hypoxia cultured conditions 24 h post indicated treatment. n = 3. Man, D‐mannose. All quantified data are shown as mean ± SEM; NS, not significant, *p < 0.05, **p < 0.01, ***p < 0.001 by one‐way ANOVA followed by the Tukey‐Kramer test
FIGURE 3
FIGURE 3
D‐mannose protects osteoarthritic chondrocytes by attenuating sensitivity to ferroptosis. (A) Representative immunofluorescence staining of GPX4 in knee joint 4 weeks post‐surgery and (B) quantification. Arrow heads indicated positive cells. n = 3. Scale bars, 100 μm. (C) Chondrocyte's cell viability determined by CCK‐8 assay 24 and 48 h post indicated treatment. n = 4. (D) Lipid peroxidation was determined using the BODIPY 581/591 C11 reagent in chondrocytes 24 h post indicated treatment. n = 3. (E) MDA measurement 24 h post indicated treatment. n = 3. (F and G) (F) Quantitative RT‐PCR and (G) Western blotting analyses of the Gpx4 and Slc7a11 of chondrocytes 24h post indicated treatments. n = 3. (H) Measurement of GSH content 24 h post indicated treatment. n = 3. (I) Representative images of chondrocytes 24 h post indicated treatments visualized with MitoTracker Red staining. Dotted areas were magnified in the left bottom. Scale bars, 20 μm. (J) Representative images of chondrocytes 24 h post indicated treatments stained with Nile Red to detect lipid droplets (LDs). Dotted areas were magnified in the left bottom. Scale bars, 40 μm. (K) Quantification of relative LDs area, n = 3. (L) Quantitative RT‐PCR analyses of the Cpt1a gene expression of chondrocytes 24 h post indicated treatments. n = 3. (M) Chondrocytes cell viability determined by CCK‐8 assay 24 and 48 h post indicated treatment. n = 4. Man, D‐mannose. All quantified data are shown as mean ± SEM; NS, not significant, *p < 0.05, **p < 0.01, ***p < 0.001 by one‐way ANOVA followed by the Tukey‐Kramer test
FIGURE 4
FIGURE 4
D‐mannose alleviates cartilage degeneration by suppressing HIF‐2α. (A and B) (A) Representative immunofluorescence staining of HIF‐2α in knee joint 4 weeks post‐surgery and (B) quantification. Arrow heads indicated positive cells. n = 3. Scale bars, 100 μm. (C and D) (C) Quantitative RT‐PCR (D) Western blot analyses of Epas1 expression of knee joint cartilage tissue. n = 3. (E and F) (E) Quantitative RT‐PCR and (F) Western blot analyses of the Epas1 expression of chondrocytes 24 h post indicated treatments. n = 3. (G and H) (G) Representative immunofluorescence staining of HIF‐2α of chondrocytes 24 h post indicated treatments and (H) quantification. n = 3. Scale bars, 100 μm. (I) Quantitative RT‐PCR analyses of the anabolic and catabolic gene expression of chondrocytes 24 h post indicated treatments. n = 3. Man, D‐mannose. All quantified data are shown as mean ± SEM; NS, not significant, *p < 0.05, **p < 0.01, ***p < 0.001 by one‐way ANOVA followed by the Tukey‐Kramer test
FIGURE 5
FIGURE 5
D‐mannose decreases chondrocyte ferroptosis sensitivity via inhibiting HIF‐2α expression. (A) Chondrocytes cell viability determined by CCK‐8 assay 48 h post indicated treatment. n = 4. (B) MDA measurement 24 h post indicated treatment. n = 3. (C and D) (C) Quantitative RT‐PCR and (D) Western blotting analyses of the Gpx4 and Slc7a11 of chondrocytes 24 h post indicated treatments. n = 3. (E) Measurement of GSH content 24 h post indicated treatment. n = 3. (F) Representative images of chondrocytes 24 h post indicated treatments visualized with MitoTracker Red staining. Dotted areas were magnified in the left bottom. Scale bars, 20 μm. (G and H) (G) Representative images of chondrocytes 24 h post indicated treatments stained with Nile Red to detect LDs and (H) quantification. Dotted areas were magnified in the left bottom. n = 3. Scale bars, 40 μm. (I) Quantitative RT‐PCR analyses of the Cpt1a and Hilpda gene expression of chondrocytes 24 h post indicated treatments. n = 3. Man, D‐mannose. All quantified data are shown as mean ± SEM; NS, not significant, *p < 0.05, **p < 0.01, ***p < 0.001 by one‐way ANOVA followed by the Tukey‐Kramer test
FIGURE 6
FIGURE 6
D‐mannose‐induced downregulation of HIF‐2α inhibits OA progression through suppressing chondrocyte ferroptosis. (A) Schematic model of the time course for establishment of the anterior cruciate ligament transection (ACLT) model of OA mouse with/without D‐mannose administration and adenovirus/ferrostain‐1 (Fer‐1) injection. (B and C) (B) Representative immunofluorescence staining of HIF‐2α in knee joint 4 weeks post‐surgery and (C) quantification. Arrow heads indicated positive cells. n = 3. Scale bars, 100 μm. (D) Representative safranin O/fast green staining of sham and ACLT‐induced OA mice treated with/without D‐mannose administration and adenovirus/Fer‐1 injection 4 weeks post‐surgery. Scale bars, 200 μm. (E) Osteoarthritis Research Society International (OARSI) score evaluated based on Safranin O/fast green staining 4 weeks post‐surgery. n = 5. (F and G) (F) Representative immunofluorescence staining of MMP13 in knee joint 4 weeks post‐surgery and (G) quantification. Arrow heads indicated positive cells. n = 3. Scale bars, 100 μm. (H) Quantitative RT‐PCR analyses of the catabolic gene expression of knee joint cartilage tissue 4 weeks post‐surgery. n = 3. (I) MDA measurement of knee joint cartilage tissue. n = 3. (J) Representative immunofluorescence staining of GPX4 in knee joint 4 weeks post‐surgery and (K) quantification. Arrow heads indicated positive cells. n = 3. Scale bars, 100 μm. Man, D‐mannose. All quantified data are shown as mean ± SEM; NS, not significant, *p < 0.05, **p < 0.01, ***p < 0.001 by one‐way ANOVA followed by the Tukey‐Kramer test
FIGURE 7
FIGURE 7
Model of D‐mannose ameliorates osteoarthritis progression by inhibiting chondrocyte ferroptosis in a HIF‐2α‐dependent manner. D‐mannose inhibited chondrocyte ferroptosis by suppressing HIF‐2α during OA progression, leading to the prevention of cartilage degeneration

References

    1. Stockwell BR, Friedmann Angeli JP, Bayir H, et al. Ferroptosis: a regulated cell death nexus linking metabolism, redox biology, and disease. Cell. 2017;171:273‐285. - PMC - PubMed
    1. Galluzzi L, Vitale I, Aaronson SA, et al. Molecular mechanisms of cell death: recommendations of the Nomenclature Committee on Cell Death 2018. Cell Death Differ. 2018;25:486‐541. - PMC - PubMed
    1. Dixon SJ, Lemberg KM, Lamprecht MR, et al. Ferroptosis: an iron‐dependent form of nonapoptotic cell death. Cell. 2012;149:1060‐1072. - PMC - PubMed
    1. Xie Y, Hou W, Song X, et al. Ferroptosis: process and function. Cell Death Differ. 2016;23:369‐379. - PMC - PubMed
    1. Hunter DJ, Bierma‐Zeinstra S. Osteoarthritis. Lancet. 2019;393:1745‐1759. - PubMed

MeSH terms

Substances