

Pan-cancer evaluation of gene expression and somatic alteration data for cancer prognosis prediction
- PMID: 34563154
- PMCID: PMC8467202
- DOI: 10.1186/s12885-021-08796-3
Pan-cancer evaluation of gene expression and somatic alteration data for cancer prognosis prediction
Abstract
Background: Over the past decades, approaches for diagnosing and treating cancer have seen significant improvement. However, the variability of patient and tumor characteristics has limited progress on methods for prognosis prediction. The development of high-throughput omics technologies now provides multiple approaches for characterizing tumors. Although a large number of published studies have focused on integration of multi-omics data and use of pathway-level models for cancer prognosis prediction, there still exists a gap of knowledge regarding the prognostic landscape across multi-omics data for multiple cancer types using both gene-level and pathway-level predictors.
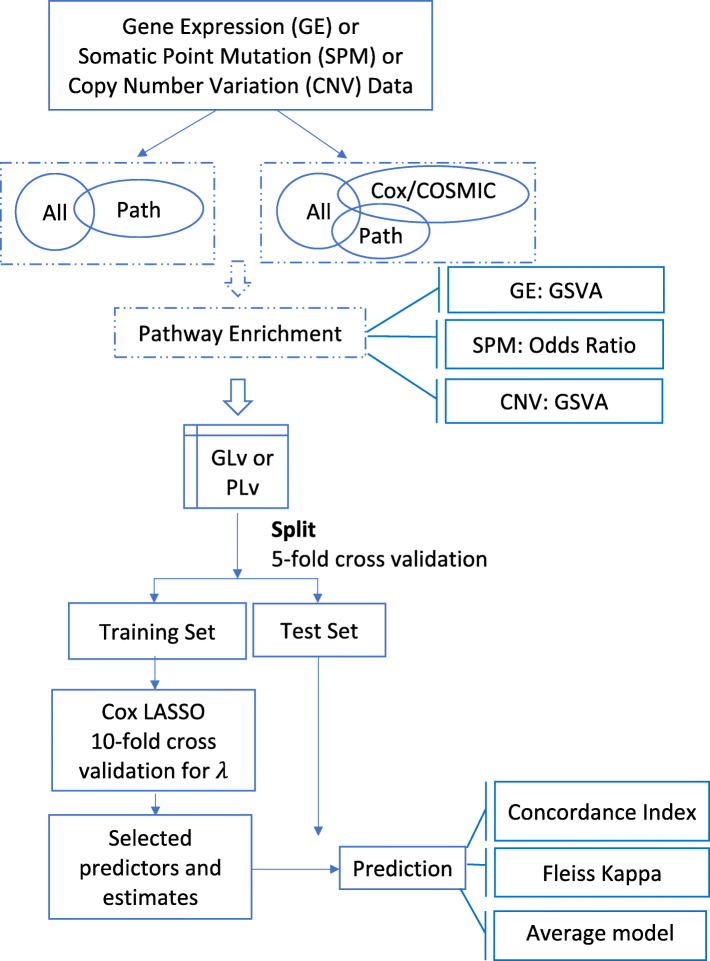
Methods: In this study, we systematically evaluated three often available types of omics data (gene expression, copy number variation and somatic point mutation) covering both DNA-level and RNA-level features. We evaluated the landscape of predictive performance of these three omics modalities for 33 cancer types in the TCGA using a Lasso or Group Lasso-penalized Cox model and either gene or pathway level predictors.
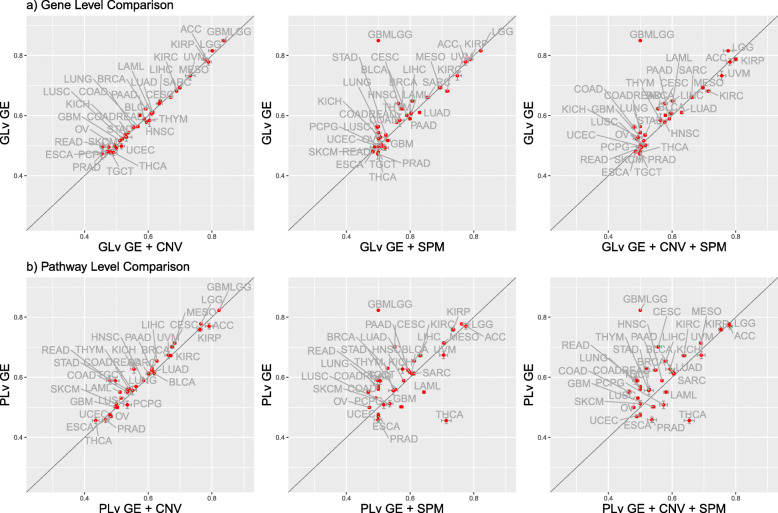
Results: We constructed the prognostic landscape using three types of omics data for 33 cancer types on both the gene and pathway levels. Based on this landscape, we found that predictive performance is cancer type dependent and we also highlighted the cancer types and omics modalities that support the most accurate prognostic models. In general, models estimated on gene expression data provide the best predictive performance on either gene or pathway level and adding copy number variation or somatic point mutation data to gene expression data does not improve predictive performance, with some exceptional cohorts including low grade glioma and thyroid cancer. In general, pathway-level models have better interpretative performance, higher stability and smaller model size across multiple cancer types and omics data types relative to gene-level models.
Conclusions: Based on this landscape and comprehensively comparison, models estimated on gene expression data provide the best predictive performance on either gene or pathway level. Pathway-level models have better interpretative performance, higher stability and smaller model size relative to gene-level models.
Keywords: Cancer prognosis prediction; L1 penalized regression model; Multi-omics data; Pathway analysis.
© 2021. The Author(s).
Conflict of interest statement
The authors declare that they have no competing interests.
Figures


References
-
- Gaspar L, Scott C, Rotman M, Asbell S, Phillips T, Wasserman T, McKenna WG, Byhardt R. Recursive partitioning analysis (RPA) of prognostic factors in three radiation therapy oncology group (RTOG) brain metastases trials. Int J Radiat Oncol Biol Phys. 1997;37(4):745–751. doi: 10.1016/S0360-3016(96)00619-0. - DOI - PubMed
-
- Sperduto PW, Berkey B, Gaspar LE, Mehta M, Curran W. A new prognostic index and comparison to three other indices for patients with brain metastases: an analysis of 1,960 patients in the RTOG database. Int J Radiat Oncol Biol Phys. 2008;70(2):510–514. doi: 10.1016/j.ijrobp.2007.06.074. - DOI - PubMed
MeSH terms
Grants and funding
LinkOut - more resources
Full Text Sources
Medical
Miscellaneous
