. 2022 Feb 2;30(2):798-815.
doi: 10.1016/j.ymthe.2021.09.023. Epub 2021 Sep 24.

Improved post-stroke spontaneous recovery by astrocytic extracellular vesicles

Affiliations

Improved post-stroke spontaneous recovery by astrocytic extracellular vesicles

Yessica Heras-Romero et al. Mol Ther. .

Abstract

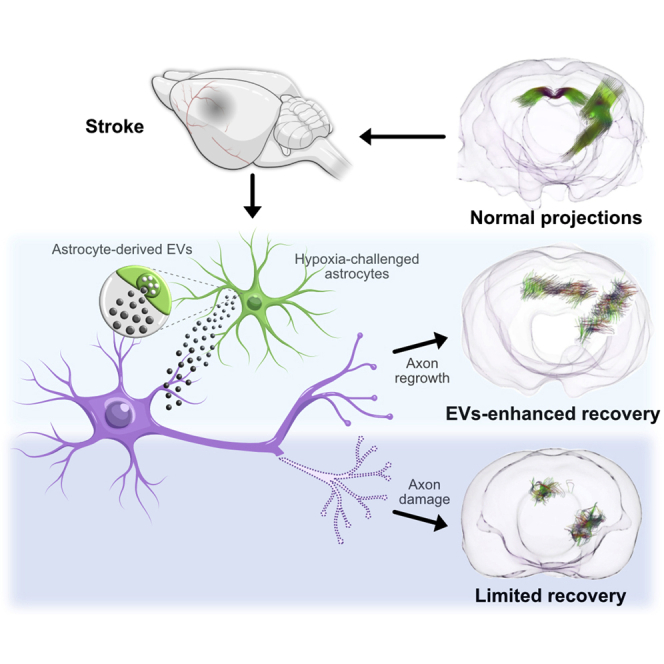
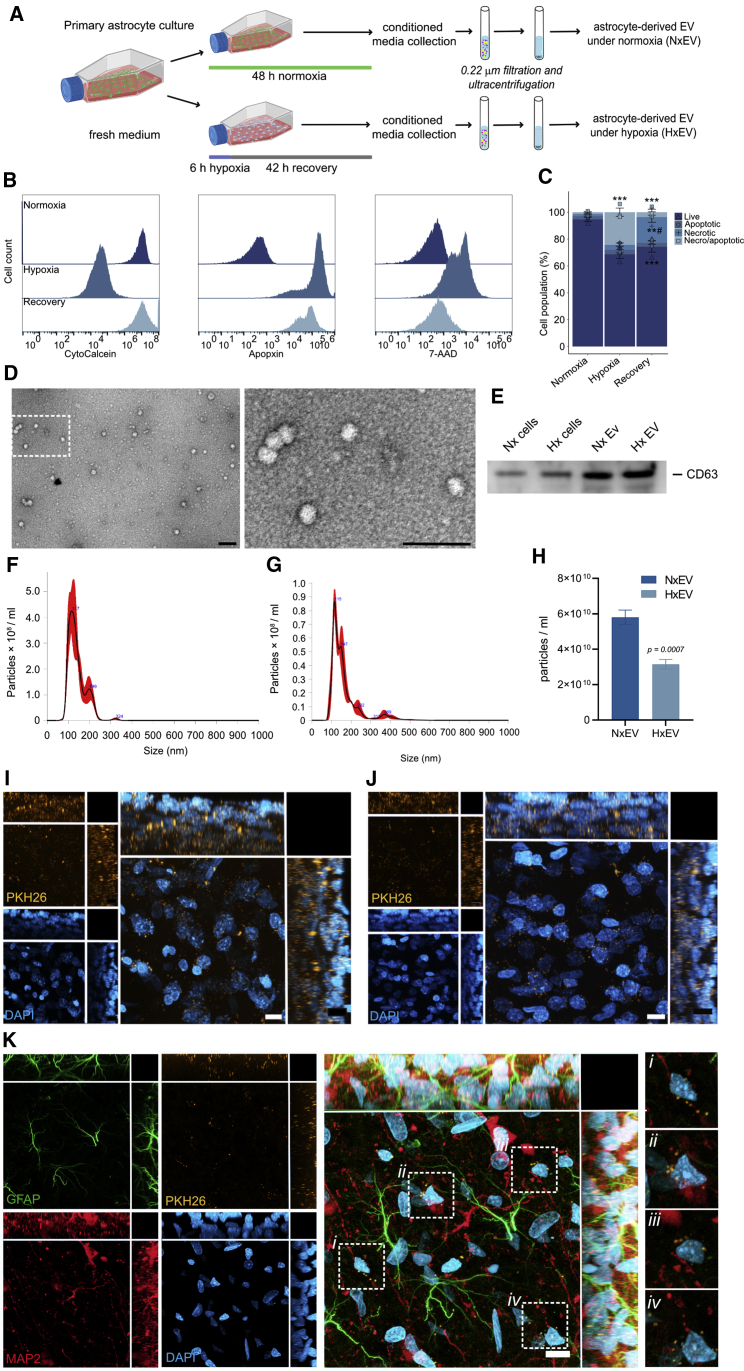
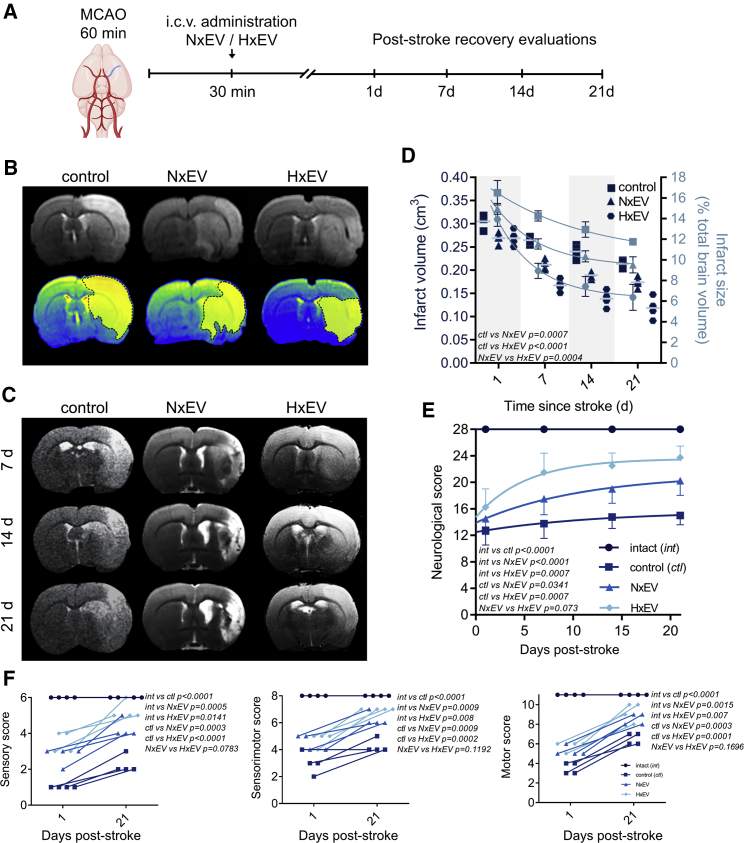
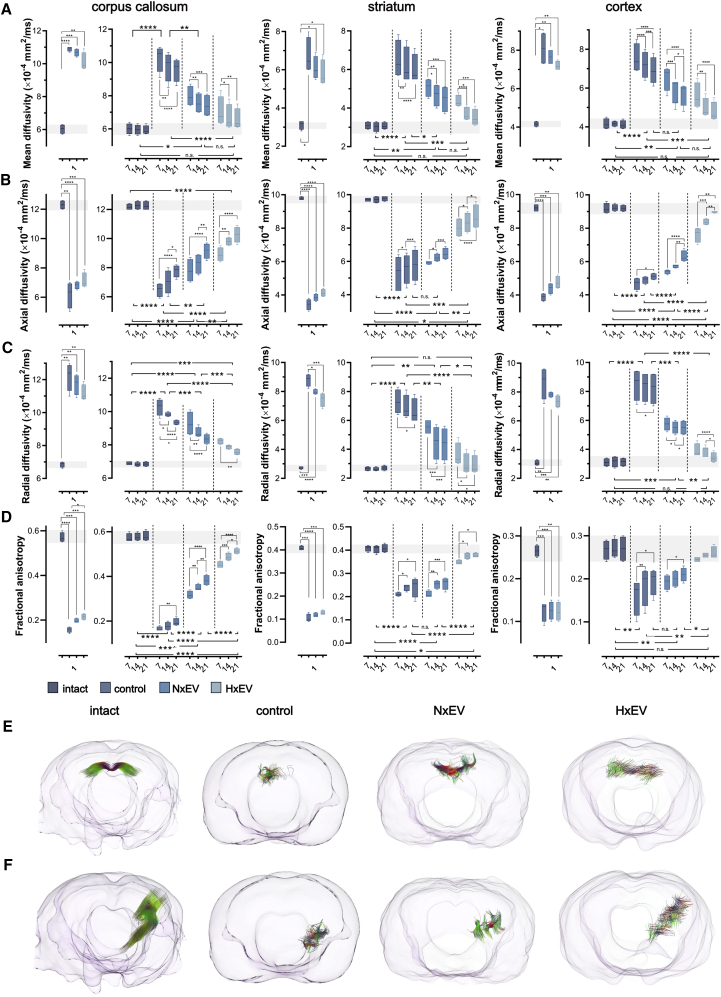
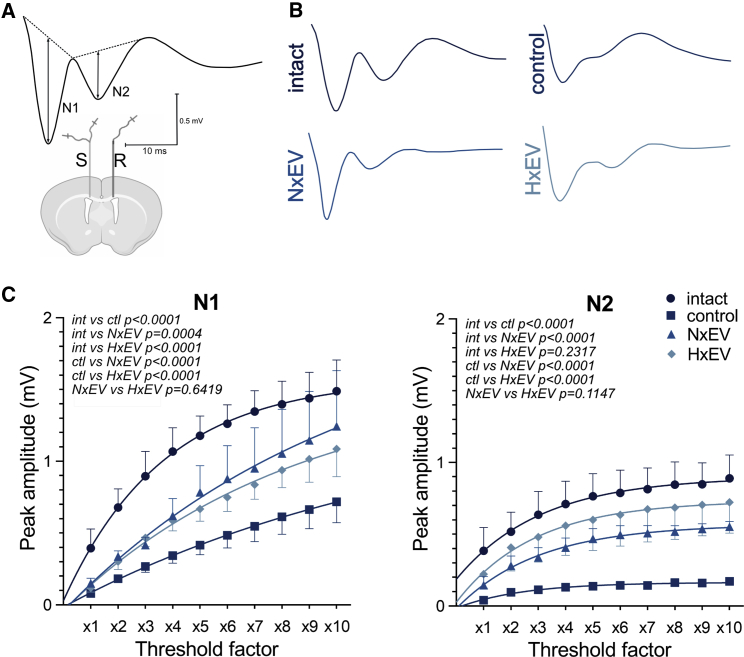
Spontaneous recovery after a stroke accounts for a significant part of the neurological recovery in patients. However limited, the spontaneous recovery is mechanistically driven by axonal restorative processes for which several molecular cues have been previously described. We report the acceleration of spontaneous recovery in a preclinical model of ischemia/reperfusion in rats via a single intracerebroventricular administration of extracellular vesicles released from primary cortical astrocytes. We used magnetic resonance imaging and confocal and multiphoton microscopy to correlate the structural remodeling of the corpus callosum and striatocortical circuits with neurological performance during 21 days. We also evaluated the functionality of the corpus callosum by repetitive recordings of compound action potentials to show that the recovery facilitated by astrocytic extracellular vesicles was both anatomical and functional. Our data provide compelling evidence that astrocytes can hasten the basal recovery that naturally occurs post-stroke through the release of cellular mediators contained in extracellular vesicles.

Keywords: astrocytes; axon growth; exosomes; extracellular vesicles; functional recovery; ischemia; middle cerebral artery occlusion; spontaneous recovery; stroke; tractography.


Conflict of interest statement

Declaration of interests The authors declare no competing interests.

Figures

None
Graphical abstract
Figure 1
Figure 1
Characterization of exosomes produced by astrocytes (A) Experimental design for collection of EVs. (B) Distribution of fluorescence intensity of markers for live (CytoCalcein), apoptotic (Apopxin), and necrotic (7-ADD) cells under normoxia, hypoxia, and recovery. (C) Distribution of live and dead (apoptotic, necrotic, and necrotic/apoptotic) cells under each experimental condition. Graph shows the mean ± SEM of three independent experiments, #p < 0.05 versus hypoxia; ∗∗p < 0.005, ∗∗∗p < 0.0005 versus normoxia. (D) Transmission electron microscopy micrographs of EVs isolated from astrocyte cultures for 24 h. Vesicles were visualized by negative staining with uranyl formate on copper/carbon-coated grids; scale bars, 100 nm. (E) Immunoblot showing the exosome canonical marker CD63 in protein lysates from EVs and astrocytes cultured under normoxia (Nx) and exposed to 6 h hypoxia and 42 h of recovery (Hx). (F and G) Size distribution of particles in suspensions by nanoparticle tracking analysis of EVs isolated under normoxia for 48 h (F) and after a 6-h hypoxic stimulus and 42-h recovery (G). (H) Graph shows the difference in the number of EVs released from astrocytes subjected to hypoxia (HxEV) and controls (NxEV) for 48 h. Data represent the mean ± standard deviation of three independent measurements. (I and J) Distribution of EVs stained with PKH26 (orange) injected i.c.v. into the brain of rats within the striatum (I) and motor cortex (J). (K) EVs internalized in neurons (MAP2; red) and astrocytes (GFAP; green) and preferentially localized to perinuclear (DAPI; blue) regions. Dotted squares demark regions where EVs localize; images on the left are magnifications of those regions. Images in (I), (J), and (K) are maximum projections of a z stack of 20 optical slices showing the orthogonal planes, and nuclei are stained with DAPI (blue); scale bars, 10 μm.
Figure 2
Figure 2
i.c.v. administration of EVs shed by cultured astrocytes reduces the infarct volume in rats subjected to MCAO (A) Time frame of the experimental design. (B) Determination of infarct volume by magnetic resonance imaging (MRI) 24 h after MCAO in rats treated with vehicle (control) and EVs derived from astrocytes grown under normoxic (NxEV) and hypoxic (HxEV) conditions. The figure shows (top) the coronal section of T2-weighted sequences at AP −0.5 from bregma, and (bottom) the infarcted area is shown in a yellow mask over a converted image that shows the regions of hyperdensity in a color scale. (C) Time course of MRI images of the different groups at 7, 14, and 21 days post-stroke. MRI shows the affected striatum and adjacent premotor, primary motor, and somatosensory cortices and reduced affected areas over time. (D) Quantification of the infarct volumes determined with whole-brain measurements and the percentage of brain volume affected by stroke. Data show the mean ± SEM of n = 4 animals per group. Two-way repeated-measures ANOVA followed by Tukey’s post hoc test. (E) Evolution of neurological performance, and thus the motor and sensory recovery over 21 days of rats in the indicated experimental groups. Data points are the mean ± SEM of four rats per group followed over time. Two-way repeated-measures ANOVA followed by Tukey’s post hoc test. (F) The neurological evaluation was composed of tests that assessed performance in sensory and motor tasks and the integration of both. The figures show the initial (24 h) and last assessments (21 d) of each rat in each evaluation category.
Figure 3
Figure 3
Administration of astrocyte-derived exosomes preserves the structural integrity of neuronal tracts (A–D) Mean diffusivity (A), axial diffusivity (B), radial diffusivity (C), and fractional anisotropy (D) were determined from diffusion tensor imaging (DTI) of the ipsilateral corpus callosum (left column), striatum (middle column), and motor cortex (right column) at 1, 7, 14, and 21 days post-stroke. Boxplots on day 1 show the alterations caused by the stroke in all four DTI parameters; no statistical differences exist between stroke-challenged animals treated with vehicle (control) and those that received EVs 30 min after the beginning of reperfusion. From day 7 onward, boxplots show the evolution of the recovery hastened by the administration of NxEV or HxEV. Boxplots show the minimum and maximum values within each group, the dispersion span from Q1 to Q3, and the mean; n = 4. The shaded horizontal bar in each plot marks the span of ±1 SD of the intact group baseline values. Statistical differences of the recovery trend are indicated among groups with two-way repeated-measures ANOVA followed by Tukey’s post hoc test, and changes over time within each group are also indicated with two-way ANOVA followed by Tukey’s post hoc test. ∗p < 0.05, ∗∗p < 0.01, ∗∗∗p < 0.001, ∗∗∗∗p < 0.0001. (E and F) Fiber tractography produced from DTI of the corpus callosum (E) and a striatocortical tract of the ipsilesional hemisphere (F) of a representative rat of each experimental group 21 days after stroke. Colors in the tracts indicate the orientation of the fiber: transverse fibers (red), anteroposterior fibers (green), and craniocaudal fibers (blue).
Figure 4
Figure 4
The administration of astrocyte-derived exosomes promotes the recovery of the neuronal processes’ integrity affected by stroke Representative micrographs of 40-μm-thick immunostained sections with MAP2 (red) and TUJ1 (green) of each experimental group. Images show the evolution of the recovery of the processes in the affected motor cortex and dorsal striatum at 7, 14, and 21 days post-stroke. Microphotographs are z stack confocal projections of 10–15 optical slices. Scale bars, 50 μm.
Figure 5
Figure 5
Astrocyte-derived exosomes promote axonal regrowth and the reorganization of cortical innervation maps in the somatosensory cortex (A) Schematic representation of the administration of the fluorescent colorant Dil at 21 days post-stroke and diffusion through axonal transport during 7 days. (B) Schematic indication of the localization of polar plots shown in (C) over the cortical territories of the motor and somatosensory cortex of the rat, indicated by the localization of the barrel cortex (see Figure S8). Polar plots of the striatal innervation to the cortex in a representative rat of each group. Each two-photon-captured stack’s maximum projection was converted to the pixels’ Cartesian coordinates meeting the threshold set (percentile 90–95 of positive signal). Origin (0,0) was set to the first branch split of the M4 segment in the MCA’s superior trunk. Notice the stroke impact of the somatosensory cortex and the reorganization of the cortical maps produced by EVs.
Figure 6
Figure 6
Administration of astrocyte-derived exosomes augments compound action potential recovery of stroke-challenged rats (A) Schematic representation of electrode placement showing the stimulated (S) and recorded (R) sites in a coronal plane. CAP waveforms display early (N1) and late (N2) negative peaks generated by myelinated and unmyelinated axons, respectively. Dashed lines on CAPs explain the measurements of peak amplitudes from their projected bases. (B) Representative CAPs evoked at the maximum stimulus level under each experimental condition. (C) Plots for N1 and N2 I/O curves for intact, control, NxEV, and HxEV groups.
Figure 7
Figure 7
Meta-analysis of astrocytic EV proteomes (A) Venn diagram of the three databases used for the meta-analysis., , (B) Biological process (BP) Gene Ontology (GO) analysis of proteins related to neuronal, axonal, and synaptic biological processes. (C) STRING analysis of the 39 proteins represented in the BP GO terms in (B), with a minimum interaction score of 0.900 and k-means clustering of 3.

References

    1. Virani S.S., Alonso A., Benjamin E.J., Bittencourt M.S., Callaway C.W., Carson A.P., Chamberlain A.M., Chang A.R., Cheng S., Delling F.N., et al. American Heart Association Council on Epidemiology and Prevention Statistics Committee and Stroke Statistics Subcommittee Heart Disease and Stroke Statistics—2020 update: A report from the American Heart Association. Circulation. 2020;141:e139–e596. - PubMed
    1. Ouriques Martins S.C., Sacks C., Hacke W., Brainin M., de Assis Figueiredo F., Marques Pontes-Neto O., Lavados Germain P.M., Marinho M.F., Hoppe Wiegering A., Vaca McGhie D., et al. Priorities to reduce the burden of stroke in Latin American countries. Lancet Neurol. 2019;18:674–683. - PubMed
    1. Arauz A., Marquez-Romero J.M., Barboza M.A., Serrano F., Artigas C., Murillo-Bonilla L.M., Cantú-Brito C., Ruiz-Sandoval J.L., Barinagarrementeria F. Mexican-National Institute of Neurology and Neurosurgery-Stroke Registry: Results of a 25-year hospital-based study. Front. Neurol. 2018;9:207. - PMC - PubMed
    1. Rathore S.S., Hinn A.R., Cooper L.S., Tyroler H.A., Rosamond W.D. Characterization of incident stroke signs and symptoms: findings from the atherosclerosis risk in communities study. Stroke. 2002;33:2718–2721. - PubMed
    1. Cassidy J.M., Cramer S.C. Spontaneous and therapeutic-induced mechanisms of functional recovery after stroke. Transl. Stroke Res. 2017;8:33–46. - PMC - PubMed

Publication types