

Effective Recycling Solutions for the Production of High-Quality PET Flakes Based on Hyperspectral Imaging and Variable Selection
- PMID: 34564107
- PMCID: PMC8471278
- DOI: 10.3390/jimaging7090181
Effective Recycling Solutions for the Production of High-Quality PET Flakes Based on Hyperspectral Imaging and Variable Selection
Abstract
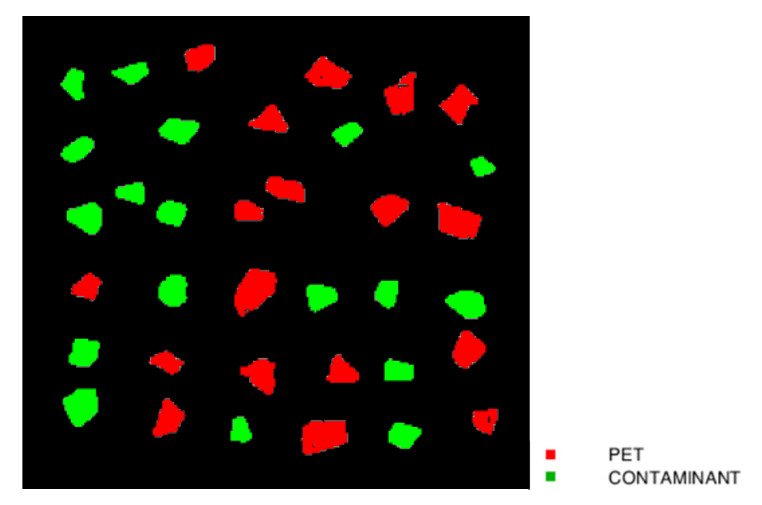
In this study, effective solutions for polyethylene terephthalate (PET) recycling based on hyperspectral imaging (HSI) coupled with variable selection method, were developed and optimized. Hyperspectral images of post-consumer plastic flakes, composed by PET and small quantities of other polymers, considered as contaminants, were acquired in the short-wave infrared range (SWIR: 1000-2500 nm). Different combinations of preprocessing sets coupled with a variable selection method, called competitive adaptive reweighted sampling (CARS), were applied to reduce the number of spectral bands useful to detect the contaminants in the PET flow stream. Prediction models based on partial least squares-discriminant analysis (PLS-DA) for each preprocessing set, combined with CARS, were built and compared to evaluate their efficiency results. The best performance result was obtained by a PLS-DA model using multiplicative scatter correction + derivative + mean center preprocessing set and selecting only 14 wavelengths out of 240. Sensitivity and specificity values in calibration, cross-validation and prediction phases ranged from 0.986 to 0.998. HSI combined with CARS method can represent a valid tool for identification of plastic contaminants in a PET flakes stream increasing the processing speed as requested by sensor-based sorting devices working at industrial level.
Keywords: PET; SWIR; circular economy; hyperspectral imaging; plastic recycling; sensor-based sorting; variable selection.
Conflict of interest statement
The authors declare no conflict of interest.
Figures


References
-
- Vilaplana F., Karlsson S. Quality concepts for the improved use of recycled polymeric materials: A review. Macromol. Mater. Eng. 2008;293:274–297. doi: 10.1002/mame.200700393. - DOI
-
- Plastics Europe The Circular Economy for Plastics—A European overview. 2019. [(accessed on 23 June 2021)]. Available online: https://www.plasticseurope.org/it/resources/publications/1899-circular-e....
-
- Schroeder P., Anggraeni K., Weber U. The Relevance of Circular Economy Practices to the Sustainable Development Goals. J. Ind. Ecol. 2019;23:77–95. doi: 10.1111/jiec.12732. - DOI
-
- Ellen MacArthur Foundation The New Plastics Economy: Rethinking the Future of Plastics. Report Produced by World Economic Forum and Ellen MacArthur Foundation. 2016. [(accessed on 23 June 2021)]. Available online: https://www.ellenmacarthurfoundation.org/publications/the-new-plastics-e....
LinkOut - more resources
Full Text Sources
