. 2021 Sep 10;7(9):183.
doi: 10.3390/jimaging7090183.

Revealing Hidden Features in Multilayered Artworks by Means of an Epi-Illumination Photoacoustic Imaging System

Affiliations

Revealing Hidden Features in Multilayered Artworks by Means of an Epi-Illumination Photoacoustic Imaging System

George J Tserevelakis et al. J Imaging. .

Abstract

Photoacoustic imaging is a novel, rapidly expanding technique, which has recently found several applications in artwork diagnostics, including the uncovering of hidden layers in paintings and multilayered documents, as well as the thickness measurement of optically turbid paint layers with high accuracy. However, thus far, all the presented photoacoustic-based imaging technologies dedicated to such measurements have been strictly limited to thin objects due to the detection of signals in transmission geometry. Unavoidably, this issue restricts seriously the applicability of the imaging method, hindering investigations over a wide range of cultural heritage objects with diverse geometrical and structural features. Here, we present an epi-illumination photoacoustic apparatus for diagnosis in heritage science, which integrates laser excitation and respective signal detection on one side, aiming to provide universal information in objects of arbitrary thickness and shape. To evaluate the capabilities of the developed system, we imaged thickly painted mock-ups, in an attempt to reveal hidden graphite layers covered by various optically turbid paints, and compared the measurements with standard near-infrared (NIR) imaging. The obtained results prove that photoacoustic signals reveal underlying sketches with up to 8 times improved contrast, thus paving the way for more relevant applications in the field.

Keywords: artwork; cultural heritage; diagnostics; imaging; photoacoustic; underdrawings.


Conflict of interest statement

The authors declare no conflict of interest.

Figures
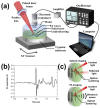
Figure 1
Figure 1
(a) Three-dimensional scheme of the reflection-mode photoacoustic (PA) imaging apparatus; (b) typical PA signal recorded in the time domain; (c) principle of optical and PA imaging for the detection of hidden underdrawings.
Figure 2
Figure 2
Images (a) of a mock-up covered with a paint layer containing a mixture of titanium white, gypsum, and ultramarine blue pigments, (b) of an underlying pencil sketch prior to the application of the paint; (c) maximum amplitude projection (MAP) PA reconstruction of the hidden underdrawing; (d) respective near-infrared (NIR) image recorded at 1100 nm. Scale bar corresponds to 1 cm.
Figure 3
Figure 3
Images (a) of a mock-up covered by a titanium white paint layer, (b) of the underlying pencil sketch prior to overpainting; (c) MAP PA reconstruction of the hidden letter “R”; (d) respective NIR image recorded at 1100 nm. Analog results are presented for minium (eh), minium plus titanium white (il), as well as ultramarine blue plus titanium white paint layers (mp). All scale bars are equal to 5 mm.
Figure 4
Figure 4
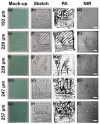
Images (a) of a mock-up covered by a mixture of chromium green and titanium white paint layer, (b) of the underlying pencil sketch prior to overpainting; (c) MAP PA reconstruction of the hidden sketch; (d) respective NIR image recorded at 1100 nm. Similar results are presented for mock-ups covered by paint layers of identical composition but with a gradually increasing average thickness, as presented on the left side of the panel (et). All scale bars are equal to 5 mm.
Figure 5
Figure 5
Plot of imaging contrast values for PA (black circles) and NIR (black squares) techniques as a function of the average paint layer’s thickness. Error bars represent the standard error of the mean out of five measurements. Red and blue lines show the linear fitting of the respective data points.

References

    1. Yao J., Wang L.V. Photoacoustic microscopy. Laser Photon. Rev. 2013;7:758–778. doi: 10.1002/lpor.201200060. - DOI - PMC - PubMed
    1. Tserevelakis G.J., Tsagkaraki M., Zacharakis G. Hybrid photoacoustic and optical imaging of pigments in vegetative tissues. J. Microsc. 2016;263:300–306. doi: 10.1111/jmi.12396. - DOI - PubMed
    1. Wang L.V., Wu H.-I. Biomedical Optics: Principles and Imaging. John Wiley and Sons; Hoboken, NJ, USA: 2012. pp. 283–293.
    1. Yao J., Wang L.V. Sensitivity of photoacoustic microscopy. Photoacoustics. 2014;2:87–101. doi: 10.1016/j.pacs.2014.04.002. - DOI - PMC - PubMed
    1. Hui J., Li R., Phillips E.H., Goergen C.J., Sturek M., Cheng J.-X. Bond-selective photoacoustic imaging by converting molecular vibration into acoustic waves. Photoacoustics. 2016;4:11–21. doi: 10.1016/j.pacs.2016.01.002. - DOI - PMC - PubMed

LinkOut - more resources