. 2021 Sep 15;5(3):41.
doi: 10.3390/vision5030041.

High-Accuracy Gaze Estimation for Interpolation-Based Eye-Tracking Methods

Affiliations

High-Accuracy Gaze Estimation for Interpolation-Based Eye-Tracking Methods

Fabricio Batista Narcizo et al. Vision (Basel). .

Abstract

This study investigates the influence of the eye-camera location associated with the accuracy and precision of interpolation-based eye-tracking methods. Several factors can negatively influence gaze estimation methods when building a commercial or off-the-shelf eye tracker device, including the eye-camera location in uncalibrated setups. Our experiments show that the eye-camera location combined with the non-coplanarity of the eye plane deforms the eye feature distribution when the eye-camera is far from the eye's optical axis. This paper proposes geometric transformation methods to reshape the eye feature distribution based on the virtual alignment of the eye-camera in the center of the eye's optical axis. The data analysis uses eye-tracking data from a simulated environment and an experiment with 83 volunteer participants (55 males and 28 females). We evaluate the improvements achieved with the proposed methods using Gaussian analysis, which defines a range for high-accuracy gaze estimation between -0.5∘ and 0.5∘. Compared to traditional polynomial-based and homography-based gaze estimation methods, the proposed methods increase the number of gaze estimations in the high-accuracy range.

Keywords: eye tracker; eye-tracking; gaze-mapping calibration; high-accuracy gaze estimation; uncalibrated setup.


Conflict of interest statement

The authors declare no conflict of interest.

Figures

Figure 1
Figure 1
This geometric relationship shows schematic representations of the eye, eye-camera, and screen in a remote setup. Gullstrand–Le Grand Eye Model represents a simplified mathematical model for the human eye as (i) a set of two spheres with distinct size to describe the eyeball, and corneal surface; (ii) the rotation of the eye around a fixed point (Oe); and (iii) the optical axis that passes through the eyeball center (Oe), cornea center (Oc), and pupil center (Pc), and coincides with the calibration target t2. The line that joins the eyeball center and the center of the screen corresponds to the screen axis. The eye-camera is under the screen and aligned horizontally with the center of the screen, and its axis joins the eyeball center and the camera center.
Figure 2
Figure 2
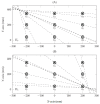
The eye-camera location changes the shape and coordinates of a nonlinear eye feature distribution. The crosses represent a set of 16×16 simulated pupil centers from a remote eye tracker. In these simulations, the eye-camera location (in millimeters) related to the world coordinate system (i.e., the bottom-center of the screen) were: (A) (250,400,0); and (B) (250,0,0).
Figure 3
Figure 3
The eye-camera aligned with the eyes’s optical axis and moving in depth. The crosses represent a set of 16×16 simulated pupil centers from a remote eye tracker. In these simulations, the eye-camera location (in millimeters) related to the world coordinate system (i.e., the bottom-center of the screen) were: (A) (0,350,0); and (B) (0,350,550).
Figure 4
Figure 4
The epipolar geometry describes the eye-camera location in an eye tracker setup. The dots represent a set of 3×3 simulated targets of the gaze-mapping calibration. The epipolar lines pass through each calibration target and intercept at a common point, representing the eye-camera location related to the screen. In these simulations, the 3D eye-camera locations were (A) (250,400,0) and (B) (250,0,0).
Figure 5
Figure 5
The epipolar geometry between the normalized space Πn and the viewed space Πs. After normalizing the eye-tracking data using a second-order polynomial, the epipole represents the eye-camera location in relation to Πs which is very close to the actual center of the viewed plane.
Figure 6
Figure 6
This geometric relationship shows the horizontal eyeball rotation in relation to the eye plane Πe. The image plane Πi represents the captured eye image. The eyeball rotates around a fixed point Oe, and the maximal angle of rotation is 35 degrees in both right and left directions. The larger the angle β, the higher the error Δe between the pupil center Pc and the eye plane Πe.
Figure 7
Figure 7
The eye feature distribution on the normalized space Πn presents a positive radial distortion (i.e., barrel distortion) available in most camera lenses. The grids represent a set of 16×16 simulated pupil centers from a remote eye tracker with the eye-camera placed at (0,350,0). (A) shows the pupil center distribution over the influence of barrel effect, and (B) presents the result of the proposed eye feature distribution undistortion method.
Figure 8
Figure 8
Accuracy as a function of the eye-camera location. The eye-camera has moved to 21 different locations (fixed steps) between the pre-defined ranges, i.e., x-axis (from −200 mm to 200 mm), on y-axis (from 50 mm to 350 mm), and z-axis (0 mm to 400 mm). (A) the accuracy of the traditional homography gaze estimation method, and (B) the accuracy of the traditional second-order polynomial gaze estimation method.
Figure 9
Figure 9
This heatmap illustrates the eye-camera location’s influence on the traditional homography-based gaze estimation method’s accuracy. The eye-camera has moved in a grid of 21×21×21 positions (i.e., 9.261 settings). Each element in this heatmap represents the gaze error average of 21 camera displacements along the z-axis. When the optical axis, screen axis, and camera axis are aligned (X=0 mm and Y=200 mm), the gaze error is 0.49.
Figure 10
Figure 10
A three-dimensional overview of the eye-camera location’s influence on the homography-based gaze estimation methods. Each dot represents an eye-camera location in the three-dimensional space, and each scatter plot represents a set of 9261 eye-camera locations. (A) shows the gaze errors achieved by the traditional homography-based method, which presents the highest gaze error (2.56) in the simulated study at location X=200 mm, Y=350 mm, and Z=400 mm, (B) illustrates the improvements achieved with the eye-camera location compensation method, and (C) presents the results of the eye feature distribution undistortion method, which achieves the best gaze estimation accuracy (0.18) at location X=0 mm, Y=200 mm and Z=[0 mm ,400 mm].
Figure 11
Figure 11
The average gaze-error distribution of simulated eye-tracking data analysis. The bar plots show the improvements achieved with the proposed eye-camera location compensation (Hes+ and Pes+), and proposed eye feature distribution undistortion (Hes* and Pes*) over the traditional interpolation-based gaze estimation methods (Hes and Pes). The large error bar in the traditional homography-based method Hes is due to is sensitivity to the eye-camera location’s influence.
Figure 12
Figure 12
The histograms represent the gaze-error offset on the x-axis of all eye-tracking data collected during the simulated study. The areas delimited with northeast lines represent the high-accuracy gaze estimations, in which the (A) traditional homography gaze estimation method achieved 58%; (B) the homography gaze estimation method with the eye-camera location compensation achieved 64%; (C) the homography gaze estimation method with both camera location and distortion compensations achieved 98%; (D) traditional polynomial gaze estimation method achieved 64%; (E) polynomial gaze estimation method with the eye-camera location compensation achieved 63%; (F) polynomial gaze estimation method with both camera location and distortion compensations achieved 91%.
Figure 13
Figure 13
The histograms represent the gaze-error offset on the y-axis (without outliers) of the eye-tracking data collected during the user study. The areas delimited with northeast lines represent the high-accuracy gaze estimation, in which (A) traditional homography gaze estimation method achieved 32%; (B) homography gaze estimation method with the eye-camera location compensation achieved 50%; (C) homography gaze estimation method with both camera location and distortion compensations achieved 62%; (D) traditional polynomial gaze estimation method achieved 50%; (E) polynomial gaze estimation method with the eye-camera location compensation achieved 50%; (F) polynomial gaze estimation method with both camera location and distortion compensations achieved 63%.
Figure 14
Figure 14
An overview of user study results considering two distinct classes, the gaze estimation from the left and right eye. The three circles in each scatter plot represent the 68–95–99.7 rule of a normal distribution. This figure shows the gaze estimations from (A) a traditional homography gaze estimation method; (B) a homography gaze estimation method with the eye-camera location compensation; (C) a homography gaze estimation method with both camera location and distortion compensations; (D) a traditional second-order polynomial gaze estimation method; (E) a polynomial gaze estimation method with the eye-camera location compensation; (F) a polynomial gaze estimation method with both camera location and distortion compensations.

References

    1. Hansen D.W., Ji Q. In the Eye of the Beholder: A Survey of Models for Eyes and Gaze. IEEE Trans. Pattern Anal. Mach. Intell. 2010;32:478–500. doi: 10.1109/TPAMI.2009.30. - DOI - PubMed
    1. Tonsen M., Steil J., Sugano Y., Bulling A. InvisibleEye: Mobile Eye Tracking Using Multiple Low-Resolution Cameras and Learning-Based Gaze Estimation. Proc. ACM Interact. Mob. Wearable Ubiquitous Technol. 2017;1:106:1–106:21. doi: 10.1145/3130971. - DOI
    1. Larumbe A., Cabeza R., Villanueva A. Supervised Descent Method (SDM) Applied to Accurate Pupil Detection in off-the-Shelf Eye Tracking Systems; Proceedings of the 2018 Symposium on Eye Tracking Research & Applications (ETRA ’18); Warsaw, Poland. 14–17 June 2018; New York, NY, USA: ACM; 2018. - DOI
    1. Hansen D.W., Agustin J.S., Villanueva A. Homography normalization for robust gaze estimation in uncalibrated setups; Proceedings of the 2010 Symposium on Eye Tracking Research & Applications (ETRA ’10); Austin, TX, USA. 22–24 March 2010; New York, NY, USA: ACM; 2010. pp. 13–20. - DOI
    1. Hansen D.W., Roholm L., Ferreiros I.G. Robust Glint Detection through Homography Normalization; Proceedings of the 2014 Symposium on Eye Tracking Research & Applications (ETRA ’14); Safety Harbor, FL, USA. 26–28 March 2014; New York, NY, USA: ACM; 2014. pp. 91–94. - DOI

LinkOut - more resources