. 2021 Aug 31;11(9):586.
doi: 10.3390/metabo11090586.

Metabolic Profiling during Acute Myeloid Leukemia Progression Using Paired Clinical Bone Marrow Serum Samples

Affiliations

Metabolic Profiling during Acute Myeloid Leukemia Progression Using Paired Clinical Bone Marrow Serum Samples

Hyun Kyu Kim et al. Metabolites. .

Abstract

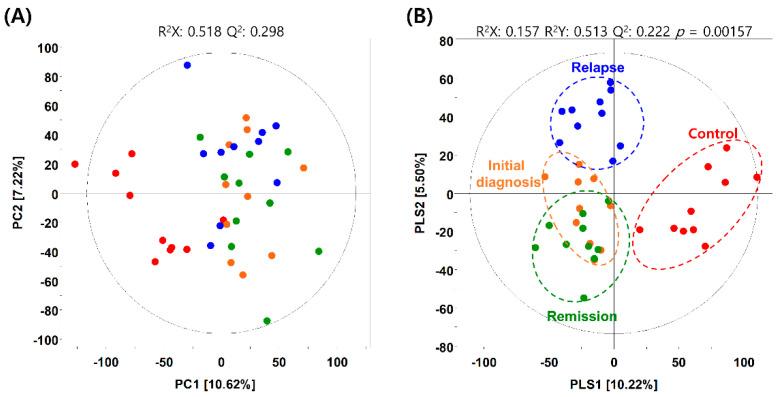
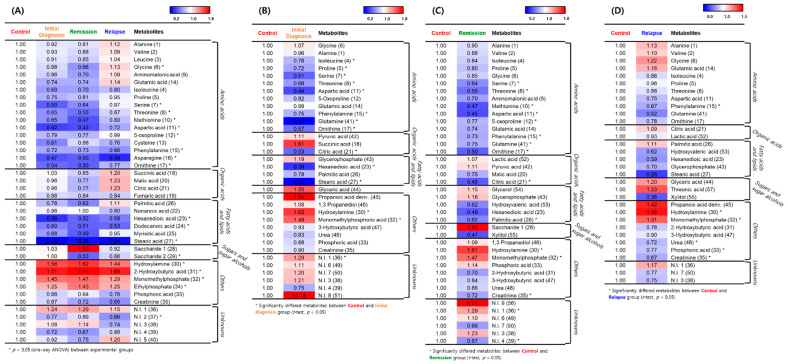
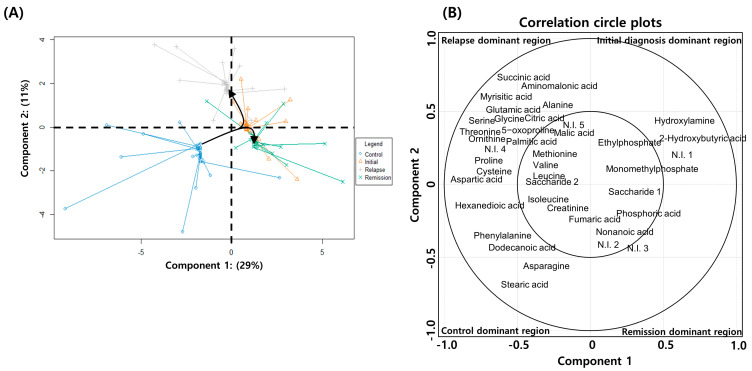
Cellular metabolic changes reflect the characteristics of patients with acute myeloid leukemia (AML) caused by genetic variations, which are important in establishing AML treatment. However, little is known about the metabolic profile of patients with genetic variation-induced AML. Furthermore, the metabolites differ with disease progression. Here, metabolites in the bone marrow serum of ten patients with AML and healthy individuals were analyzed using gas chromatography-mass spectrometry. Compared with that in healthy individuals, expression of most metabolites decreased in patients with AML; hydroxylamine, 2-hydroxybutyric acid, monomethylphosphate, and ethylphosphate expression was unusually increased in the patients. We further examined serial metabolite changes across the initial diagnosis, postremission, and relapse phases. Patients with relapse showed increased metabolite expression compared with those in the diagnostic phase, confirming that patients with AML had aggressively modified leukemic cells. However, a clear difference in metabolite distribution was not observed between the diagnosis and complete remission phases, suggesting that the metabolic microenvironment did not change significantly despite complete remission. Interestingly, metabolite profiles differed with genetic variations in leukemic cells. Our results, which were obtained using paired samples collected during AML progression, provide valuable insights for identifying vulnerable targets in the AML metabolome and developing new treatment strategies.

Keywords: acute myeloid leukemia; bone marrow serum; cell metabolism; metabolomics.


Conflict of interest statement

The authors declare no conflict of interest.

Figures

Figure 1
Figure 1
Metabolic differences between patients with acute myeloid leukemia (AML) and healthy individuals. (A) Principal component analysis (PCA) and (B) partial least squares–discriminant analysis (PLS-DA) score plots obtained using the dataset from gas chromatography–time of flight–mass spectrometry analysis of serum samples from healthy individuals (control) and patients with AML. Red dots, control group; orange dots, initial diagnosis group; green dots, remission group; blue dots, relapse group.
Figure 2
Figure 2
Representative heatmaps for the relative contents of significantly different metabolites between the healthy individuals and patients with acute myeloid leukemia (AML). (A) Differences between the control group and the initial diagnosis, remission, and relapse patient groups. (B) Differences between the control and initial diagnosis groups. (C) Differences between the control and remission groups. (D) Differences between the control and relapse groups. The colored squares (blue-to-red) represent fold changes normalized by the average content of each metabolite in the control group. The color scheme is as follows: lower limit value, blue; middle value (1.0), white; and upper limit value, red. * means that metabolites significantly differed between the control and patient group.
Figure 3
Figure 3
Spared partial least squares–discriminant analysis (sPLS–DA) of metabolite expression in patients with acute myeloid leukemia (AML) and healthy individuals. (A) sPLS–DA plot showing the combined distribution of metabolite expression in the initial diagnosis, remission, relapse, and healthy control groups. (B) Correlation circle plot displaying the correlation between the metabolite levels and disease progression. The metabolites in the inner circle of point are strongly correlated with the disease progression. The individual contribution of each metabolite to the progression of disease is represented at a distance away from the center in the correlation circle plots.
Figure 4
Figure 4
Differences in metabolite profiles based on genetic aberrations in acute myeloid leukemia. (A) Partial least squares–discriminant analysis (PLS–DA) score plots constructed using data from gas chromatography–time of flight–mass spectrometry analysis of the initial diagnosis patient subgroups. Green dots, RUNX1-RUNX1T1 group; light blue dots, Fms-like tyrosine kinase 3 (FLT3)-internal tandem duplication (ITD)/tyrosine kinase domain (TKD) group; and yellow dots, others group. (B) Heatmap analysis representing differential metabolites among the initial diagnosis subgroups with relative metabolite abundance. The relative level in the heatmap represents fold changes normalized to the average level of each metabolite. The color scheme is as follows: lower limit value (0.7), blue; middle value (1.0), white; and upper limit value (1.3), red.

References

    1. Cancer Genome Atlas Research Network. Ley T.J., Miller C., Ding L., Raphael B.J., Mungall A.J., Robertson A., Hoadley K., Triche T.J., Laird P.W., et al. Genomic and epigenomic landscapes of adult de novo acute myeloid leukemia. N. Engl. J. Med. 2013;368:2059–2074. doi: 10.1056/NEJMoa1301689. - DOI - PMC - PubMed
    1. Papaemmanuil E., Gerstung M., Bullinger L., Gaidzik V.I., Paschka P., Roberts N.D., Potter N.E., Heuser M., Thol F., Bolli N., et al. Genomic classification and prognosis in acute myeloid leukemia. N. Engl. J. Med. 2016;374:2209–2221. doi: 10.1056/NEJMoa1516192. - DOI - PMC - PubMed
    1. Druker B.J., Guilhot F., O’Brien S.G., Gathmann I., Kantarjian H., Gattermann N., Deininger M.W., Silver R.T., Goldman J.M., Stone R.M., et al. Five-year follow-up of patients receiving imatinib for chronic myeloid leukemia. N. Engl. J. Med. 2006;355:2408–2417. doi: 10.1056/NEJMoa062867. - DOI - PubMed
    1. Stone R.M., Mandrekar S.J., Sanford B.L., Laumann K., Geyer S., Bloomfield C.D., Thiede C., Prior T.W., Döhner K., Marcucci G., et al. Midostaurin plus chemotherapy for acute myeloid leukemia with a FLT3 mutation. N. Engl. J. Med. 2017;377:454–464. doi: 10.1056/NEJMoa1614359. - DOI - PMC - PubMed
    1. DiNardo C.D., Jonas B.A., Pullarkat V., Thirman M.J., Garcia J.S., Wei A.H., Konopleva M., Döhner H., Letai A., Fenaux P., et al. Azacitidine and Venetoclax in Previously Untreated Acute Myeloid Leukemia. N. Engl. J. Med. 2020;383:617–629. doi: 10.1056/NEJMoa2012971. - DOI - PubMed

LinkOut - more resources