. 2021 Sep 4;11(9):601.
doi: 10.3390/metabo11090601.

A Role for Inositol Pyrophosphates in the Metabolic Adaptations to Low Phosphate in Arabidopsis

Affiliations

A Role for Inositol Pyrophosphates in the Metabolic Adaptations to Low Phosphate in Arabidopsis

Eric S Land et al. Metabolites. .

Abstract

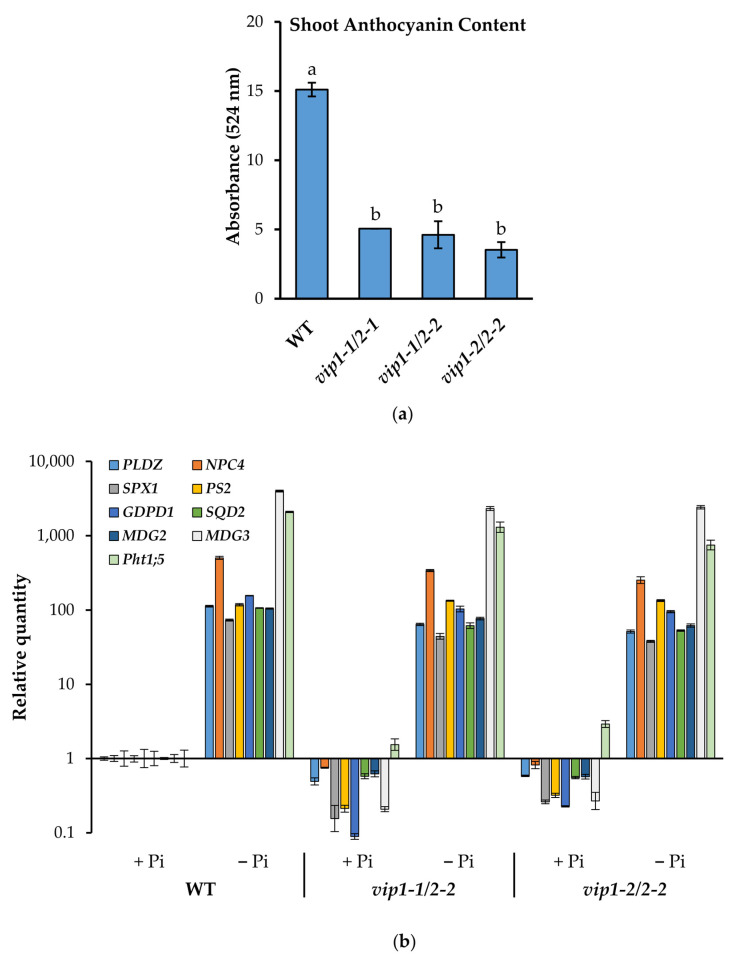
Phosphate is a major plant macronutrient and low phosphate availability severely limits global crop productivity. In Arabidopsis, a key regulator of the transcriptional response to low phosphate, phosphate starvation response 1 (PHR1), is modulated by a class of signaling molecules called inositol pyrophosphates (PP-InsPs). Two closely related diphosphoinositol pentakisphosphate enzymes (AtVIP1 and AtVIP2) are responsible for the synthesis and turnover of InsP8, the most implicated molecule. This study is focused on characterizing Arabidopsis vip1/vip2 double mutants and their response to low phosphate. We present evidence that both local and systemic responses to phosphate limitation are dampened in the vip1/vip2 mutants as compared to wild-type plants. Specifically, we demonstrate that under Pi-limiting conditions, the vip1/vip2 mutants have shorter root hairs and lateral roots, less accumulation of anthocyanin and less accumulation of sulfolipids and galactolipids. However, phosphate starvation response (PSR) gene expression is unaffected. Interestingly, many of these phenotypes are opposite to those exhibited by other mutants with defects in the PP-InsP synthesis pathway. Our results provide insight on the nexus between inositol phosphates and pyrophosphates involved in complex regulatory mechanisms underpinning phosphate homeostasis in plants.

Keywords: AtVIP1; AtVIP2; inositol pyrophosphates; lipid remodeling; phosphate homeostasis; phosphate starvation response.


Conflict of interest statement

The authors declare no conflict of interest.

Figures

Figure 1
Figure 1
Double vip mutant generation and morphometric analysis. (a) Gene structure of Arabidopsis AtVIP1 (AT3G01310) and AtVIP2 (AT5G15070). Exon coding regions are indicated in blue, untranslated regions are indicated in orange, and introns are indicated in gray. The position of the T-DNA insertions are indicated by the red arrows. Three independent homozygous double mutants (vip1-1/vip2-1, vip1-1/vip2-2, vip1-2/vip2-2) were generated by crossing. (b) AtVIP1 and AtVIP2 transcriptional abundances in 14-day-old seedlings relative to WT. Samples were assayed in triplicate by qRT-PCR using gene-specific primers and PP2A as an endogenous control. Error bars denote SD. (c) WT and vip double mutant seedlings were grown on 0.5× MS media for 10 days (scale bars indicate 0.5 cm). (d) Young seedlings were transplanted to soil and grown under short day conditions (8 h light) and rosette area was measured after 28 days (scale bars indicate 1 cm). (e) Primary root lengths. Data presented are the average ± SD of two independent experiments (n = 50/experiment). Different letters indicate statistically significant means (Tukey HSD, α = 0.05). (f) Rosette areas. Data presented are the average ± SD of a representative experiment (n = 12). Different letters indicate statistically significant means (Tukey HSD, α = 0.05).
Figure 2
Figure 2
Genes downregulated in shoot tissue of vip double mutants. Venn diagram shows overlap between genes downregulated in all three vip mutants compared to WT. A conserved subset of 20 genes were identified as being downregulated in all the vip double mutants.
Figure 3
Figure 3
Inorganic phosphate content was quantified in 18-day-old seedlings and in 49-day-old mature leaves of WT, vip double mutants, and ipk1. Data presented are the average ± SD of three independent bioreplicate experiments. Different letters indicate statistically significant means (Tukey HSD, α = 0.05).
Figure 4
Figure 4
Root system architecture (RSA) responses in vip mutants. (a) Close-up images of 14-day-old WT and vip1-2/vip2-2 primary roots from seedlings grown on phosphate-replete (+Pi) and phosphate-limiting (−Pi) MS media (scale bars indicate 250 µm). (b) Root hair length of seedlings grown on phosphate-limiting media. Data presented are the average ± SD of two replicate experiments, (n = 400–500 observations). (c) Lateral root count of seedlings grown on phosphate-limiting media. Data presented are the average ± SD of three bioreplicate experiments (n = 30 observations/bioreplicate). Different letters indicate statistically significant means (Tukey HSD, α = 0.05).
Figure 5
Figure 5
Shoot transcriptional responses to limiting Pi conditions. (a) Anthocyanin accumulation in 18-day-old WT and vip double mutant seedlings grown on phosphate-limiting media. Data presented are the average ± SD of two bioreplicate experiments assayed in technical duplicate. Different letters indicate statistically significant means (Tukey HSD, α = 0.05). (b) The transcriptional abundance of select PSR genes was queried relative to WT by qRT-PCR using gene-specific primers and PEX4 (which is not transcriptionally responsive to low Pi) as an endogenous control. Data shown are from a representative bioreplicate. Error bars indicate standard deviation.
Figure 6
Figure 6
Inositol phosphate profiles. Fourteen-day-old WT, vip1-2/vip2-2 and ipk1 seedlings were radiolabeled with 3H-myo-inositol for 5 days and InsP species were separated by HPLC and quantified by liquid scintillation counting. (ad) Normalized CPM elution profiles comparing WT to ipk1 (a,b) and vip1-2/vip2-2 (c,d). (eg) Normalized CPM from fractions comprising InsP6 (e), InsP7 (f), and InsP8 (g). Mean values of three replicate experiments are shown (n = 3) and error bars represent standard deviation. Significance of differences relative to WT were calculated by two tailed Student’s t-test.
Figure 7
Figure 7
Composition of major phospholipid and galactolipids under Pi-replete and limiting conditions. Lipids were extracted and analyzed from wild type (WT), vip1-2/2-2, and ipk1 in 18-day-old shoot tissue grown on 1 mM Pi (+Pi) and 10 µM Pi (−Pi) agar media. Individual lipid species are indicated by stacked bars. (a) Relative peak area of phosphatidylcholine (PC). (b) Relative peak area of phosphatidylglycerol (PG). (c) Relative peak area of digalactosyldiacylglycerol (DGDG). (d) Relative peak area of sulfoquinovosyldiacylglycerol (SQDG). (e) Relative peak area of triacylglycerol (TAG). Values are cube root-transformed relative peak area units and means of six biological replicate experiments assayed in technical triplicate. Letters (ae) indicate statistical groups according to post hoc Tukey HSD test (α = 0.05).

References

    1. Herrera-Estrella L., López-Arredondo D. Phosphorus: The underrated element for feeding the world. Trends Plant Sci. 2016;21:461–463. doi: 10.1016/j.tplants.2016.04.010. - DOI - PubMed
    1. Pretty J., Bharucha Z.P. Sustainable intensification in agricultural systems. Ann. Bot. 2014;114:1571–1596. doi: 10.1093/aob/mcu205. - DOI - PMC - PubMed
    1. Péret B., Clément M., Nussaume L., Desnos T. Root developmental adaptation to phosphate starvation: Better safe than sorry. Trends Plant Sci. 2011;16:442–450. doi: 10.1016/j.tplants.2011.05.006. - DOI - PubMed
    1. Bouain N., Doumas P., Rouached H. The Root System Response to Phosphate Deficiency in Arabidopsis. Curr. Genom. 2016;17:308–314. doi: 10.2174/1389202917666160331201812. - DOI - PMC - PubMed
    1. Péret B., Desnos T., Jost R., Kanno S., Berkowitz O., Nussaume L. Root architecture responses: In search of phosphate. Plant Physiol. 2014;166:1713–1723. doi: 10.1104/pp.114.244541. - DOI - PMC - PubMed