. 2021 Sep 18;13(9):669.
doi: 10.3390/toxins13090669.

Force Mapping Study of Actinoporin Effect in Membranes Presenting Phase Domains

Affiliations

Force Mapping Study of Actinoporin Effect in Membranes Presenting Phase Domains

Katia Cosentino et al. Toxins (Basel). .

Abstract

Equinatoxin II (EqtII) and Fragaceatoxin C (FraC) are pore-forming toxins (PFTs) from the actinoporin family that have enhanced membrane affinity in the presence of sphingomyelin (SM) and phase coexistence in the membrane. However, little is known about the effect of these proteins on the nanoscopic properties of membrane domains. Here, we used combined confocal microscopy and force mapping by atomic force microscopy to study the effect of EqtII and FraC on the organization of phase-separated phosphatidylcholine/SM/cholesterol membranes. To this aim, we developed a fast, high-throughput processing tool to correlate structural and nano-mechanical information from force mapping. We found that both proteins changed the lipid domain shape. Strikingly, they induced a reduction in the domain area and circularity, suggesting a decrease in the line tension due to a lipid phase height mismatch, which correlated with proteins binding to the domain interfaces. Moreover, force mapping suggested that the proteins affected the mechanical properties at the edge, but not in the bulk, of the domains. This effect could not be revealed by ensemble force spectroscopy measurements supporting the suitability of force mapping to study local membrane topographical and mechanical alterations by membranotropic proteins.

Keywords: atomic force microscopy; force spectroscopy; membrane phase domains; pore forming toxins.


Conflict of interest statement

The authors declare no conflict of interests.

Figures

Figure 1
Figure 1
Workflow of the Forcemap Analyser program. Detected force curves obtained by the force mapping tool of the AFM were processed by the Forcemap Analyser program to obtain a spatially reconstructed forcemap of the sample. For details see “Automatic force map analysis” in the Methods and Materials section.
Figure 2
Figure 2
Automatic force mapping analysis. (A) Representative AFM figure of a DOPC/SM/Chol 2:2:1 supported lipid bilayer (SLB). The brighter round areas represent Lo domains whose thickness exceeds the surrounding Ld phase (darker area). In the Figure, the principle of force mapping is illustrated: the imaged area is divided by a grid in small sub-areas. For each of these sub-areas, following the direction indicated by the green arrow, a force spectroscopy measurement is performed. (B) Representative force spectroscopy curves for Lo (gray) and Ld (red) phases measured in correspondence of the gray and red squares, respectively, in (A). The inset depicts the force and thickness values, as measured for each curve with our automatic force mapping tool. (C) The topographical picture of Figure A could be reproduced nicely by our software by spatially plotting the force values. (D) Dot plot of all corresponding force and distance values, coloured according to their affiliation with one cluster determined by the KMeans algorithm. (E) Map of the same 5 μm × 5 μm area with each spot colored according to its affiliation with one cluster determined by the KMeans algorithm.
Figure 3
Figure 3
Effect of actinoporins on the topology of Lo domains. (A) Representative image of a DOPC/SM/Chol 2:2:1 membrane system presenting lipid phase separation by confocal microscopy. SM/Chol Lo domains are visualized like black round spots surrounded by the Ld-phase enriched in DOPC, labeled with DiD-C18 (magenta). (B) The same sample as in (A) imaged by AFM. Domains are visualized like brighter spots. The representative cross-section corresponds to the green line in the respective AFM image and shows the height mismatch between the two phases. (CF) Confocal (C,E) and AFM (D,F) representative images of a DOPC/SM/Chol 2:2:1 system prepared from SUVs pre-incubated with EqtII (C,D) or FraC (E,F). Scale bar is 5 µm (A,C) and 2 µm (E). Images are representative of at least three independent experiments.
Figure 4
Figure 4
Characterization of Lo domains imaged by confocal microscopy in the presence of EqtII. (A) Confocal images of SLB from SUVs not incubated (left panels) or incubated (right panels) with EqtII. Confocal images have been treated with the particle analysis tool of Imagej that allows the estimation of the perimeter, area, and circularity of the domains. The scale bar is 5 µm. (B) Comparison of the perimeter, area, and circularity of the domains without (white bars) and with (black bars) the protein. Histograms are normalized for better comparison (the number of points varies between 600 and 6500 from at least two independent experiments).
Figure 5
Figure 5
Characterization of Lo domains in the presence of actinoporins by automatic force mapping analysis. (A) (Left) Representative AFM figure of the DOPC/SM/Chol 2:2:1 membrane system prepared from SUVs, presenting Lo domains (brighter areas) whose thickness exceeds the surrounding Ld phase (darker area). (Centre) Force-map reconstructed image by our software. (Right) Map of the same 5 μm × 5 μm area with each spot colored according to its affiliation with one cluster determined by the KMeans algorithm. (B) Same as in (A) for samples prepared from SUVs pre-incubated with FraC. (C) Same as in the left and central panels of (B) for samples prepared from SUVs pre-incubated with EqtII. All images are representative of at least three independent experiments. (D,E) Comparison of force (D) and thickness (E) values of SLBs without (light and dark yellow bars) and in the presence (light and dark gray bars) of the protein. Histograms are normalized for better comparison (the number of points varied from 220 to 450 from at least two independent experiments).
Figure 6
Figure 6
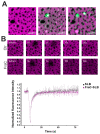
Confocal microscopy of DOPC/SM/Chol phases in the presence of FraC-488. (A) The Ld phase was stained with 0.1% DID (magenta) and FraCR126C was labelled with Alexa 488 (green). Picture taken immediately (left), 2 min (centre), and 15 min (right) after the addition of the protein. Scale bar is 5 µm. (B) Photobleaching experiments in the Ld phase without (black squares) and with (purple triangles) FraC. FraC does not alter the fluidity of the Ld phase. Dotted lines are for visual purposes only. Normalized fluorescence intensity over time is represented as the average ± SD over three (SLB) and six (FraC-SLB) repetitions.

References

    1. Aroian R., van der Goot F.G. Pore-forming toxins and cellular non-immune defenses (CNIDs) Curr. Opin. Microbiol. 2007;10:57–61. doi: 10.1016/j.mib.2006.12.008. - DOI - PubMed
    1. Ros U., García-Sáez A.J. More Than a Pore: The Interplay of Pore-Forming Proteins and Lipid Membranes. J. Membr. Biol. 2015;248:545–561. doi: 10.1007/s00232-015-9820-y. - DOI - PubMed
    1. Cosentino K., Ros U., García-Sáez A.J. Assembling the puzzle: Oligomerization of α-pore forming proteins in membranes. Biochim. Biophys. Acta (BBA) Biomembr. 2016;1858:457–466. doi: 10.1016/j.bbamem.2015.09.013. - DOI - PMC - PubMed
    1. Anderluh G., Maček P. Cytolytic peptide and protein toxins from sea anemones (Anthozoa: Actiniaria) Toxicon. 2002;40:111–124. doi: 10.1016/S0041-0101(01)00191-X. - DOI - PubMed
    1. Mancheño J.M., Martín-Benito J., Martinez-Ripoll M., Gavilanes J.G., Hermoso A.J. Crystal and Electron Microscopy Structures of Sticholysin II Actinoporin Reveal Insights into the Mechanism of Membrane Pore Formation. Structure. 2003;11:1319–1328. doi: 10.1016/j.str.2003.09.019. - DOI - PubMed

Publication types

MeSH terms

LinkOut - more resources