. 2021 Sep 25;83(4):42.
doi: 10.1007/s00285-021-01669-0.

Assessment of event-triggered policies of nonpharmaceutical interventions based on epidemiological indicators

Affiliations

Assessment of event-triggered policies of nonpharmaceutical interventions based on epidemiological indicators

Carla Castillo-Laborde et al. J Math Biol. .

Abstract

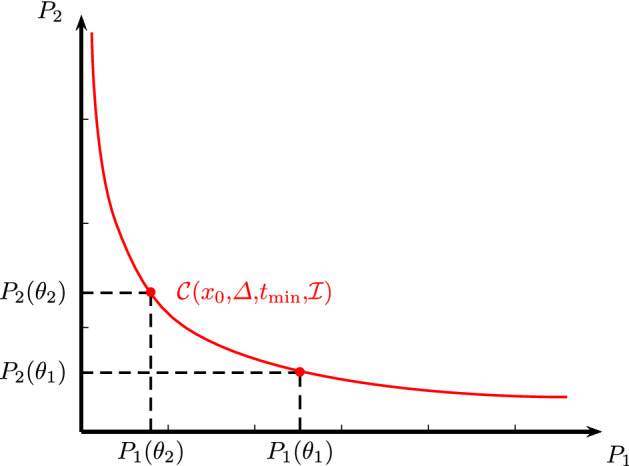
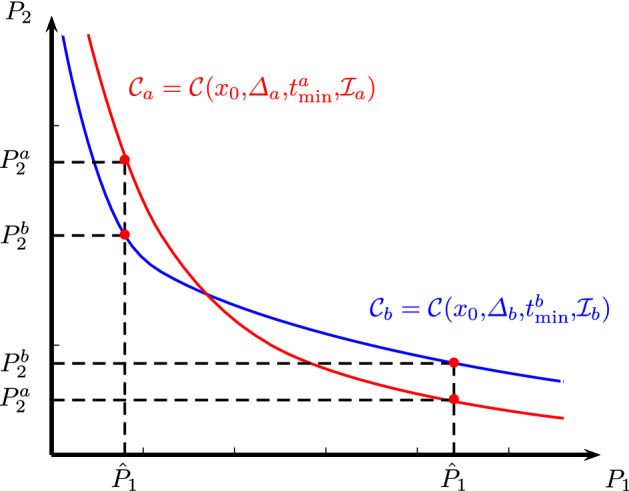
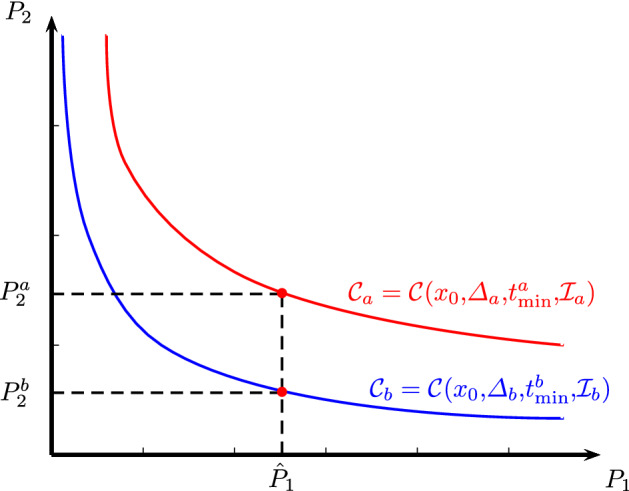
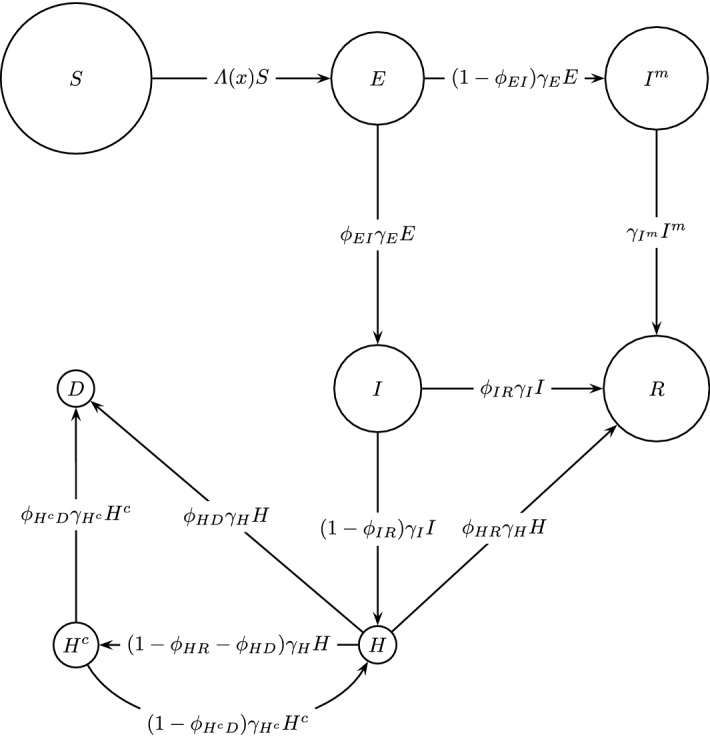
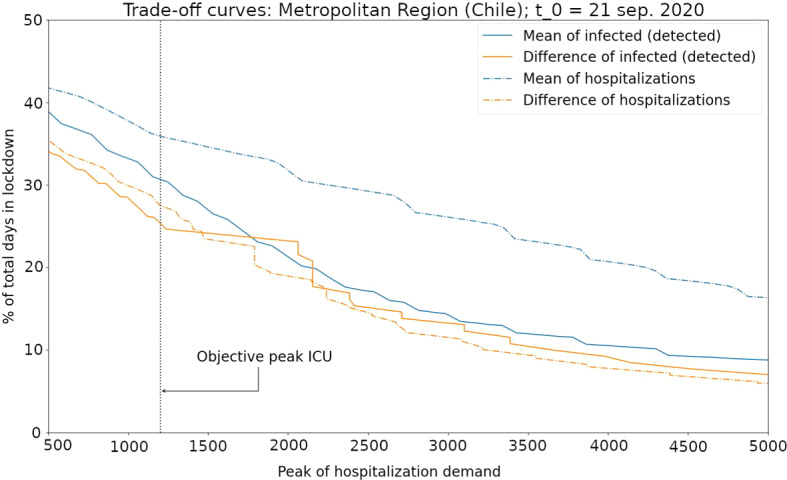
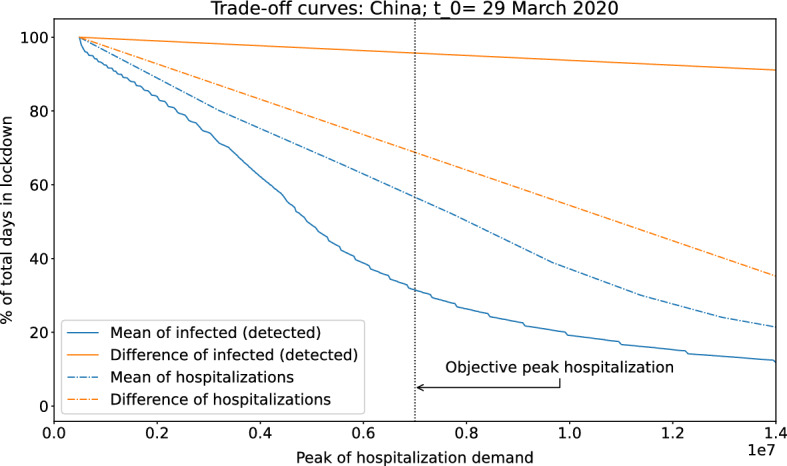
Nonpharmaceutical interventions (NPI) such as banning public events or instituting lockdowns have been widely applied around the world to control the current COVID-19 pandemic. Typically, this type of intervention is imposed when an epidemiological indicator in a given population exceeds a certain threshold. Then, the nonpharmaceutical intervention is lifted when the levels of the indicator used have decreased sufficiently. What is the best indicator to use? In this paper, we propose a mathematical framework to try to answer this question. More specifically, the proposed framework permits to assess and compare different event-triggered controls based on epidemiological indicators. Our methodology consists of considering some outcomes that are consequences of the nonpharmaceutical interventions that a decision maker aims to make as low as possible. The peak demand for intensive care units (ICU) and the total number of days in lockdown are examples of such outcomes. If an epidemiological indicator is used to trigger the interventions, there is naturally a trade-off between the outcomes that can be seen as a curve parameterized by the trigger threshold to be used. The computation of these curves for a group of indicators then allows the selection of the best indicator the curve of which dominates the curves of the other indicators. This methodology is illustrated with indicators in the context of COVID-19 using deterministic compartmental models in discrete-time, although the framework can be adapted for a larger class of models.

Keywords: COVID-19; Control epidemics; Event-triggered control; Trade-off.


Conflict of interest statement

The authors declare that they have no conflict of interest.

Figures

Fig. 1
Fig. 1
Illustration of a trade-off curve C(x0,Δ,tmin,I) parametrized by thresholds θ when the number of outcomes is m=2
Fig. 2
Fig. 2
Illustration of the trade-off curves Ca and Cb corresponding to event-triggered feedbacks based on indicators Ia and Ib, when the number of outcomes m=2 and there is no domination
Fig. 3
Fig. 3
Illustration of trade-off curves Ca and Cb corresponding to event-triggered feedbacks based on indicators Ia and Ib, when the number of outcomes is m=2 and one curve dominates the other
Fig. 4
Fig. 4
Structure of the mathematical model for the COVID-19 dynamics in an isolated city (Metropolitan Region, Chile). Each circle represents a specific group. Susceptible individuals (S), and different disease states: exposed (E), mild infected (Im), infected (I), recovered (R), hospitalized (H), hospitalized in ICU beds (Hc), and dead (D)
Fig. 5
Fig. 5
Trade-off curves for the case study of the spread of COVID-19 in Metropolitan Region, Chile. The considered indicators are: number of hospitalized patients in ICU beds (observation (O1)) considering the mean (indicator (a), blue dashed curve) and the mean of difference (indicator (b), orange dashed curve) and the number of active cases (observation (O2)) considering the mean (indicator (a), blue continuous curve) and the mean of difference (indicator (b), orange continuous curve). The curve above the other three curves (indicator (a) using observation (O1), in blue dashed curve) suggests that this indicator is the worst for triggering decisions about NPI (implement/release). For the targeted objective (to have a ICU peak demand at most 1200 beds) the best indicator is the curve crossing at the minimum level (percentage of days in lockdown) the vertical line representengin the target
Fig. 6
Fig. 6
Trade-off curve for our case-study based on the spread of COVID-19 in China. Four indicators are considered: number of hospitalized people (observation (O~1)) considering the mean (indicator (a), blue dashed curve) and the mean of difference (indicator (b), orange dashed curve) and the number of active cases (observation (O~2)) considering the mean (indicator (a), blue continuous curve) and the mean of difference (indicator (b), orange continuous curve). The curve below the other three curves (indicator (a) using observation (O~2), in blue continuous curve) suggests that this indicator is the best for triggering decisions about NPI (implement/release) because for any targeted objective (to have a maximal hospital demand) the percentage of days in lockdown using this indicator is lower

References

    1. Aba Oud MA, Ali A, Alrabaiah H, Ullah S, Khan MA, Islam S (2021) A fractional order mathematical model for COVID-19 dynamics with quarantine, isolation, and environmental viral load. Adv Differ Equ 19. 10.1186/s13662-021-03265-4 (Paper No. 106) - PMC - PubMed
    1. Aguilera X, Araos R. Ferreccio C, Otaiza F, Valdivia G, Valenzuela MT, Vial P, O’Ryan M (2020) Consejo Asesor COVID-19 Chile. https://drive.google.com/file/d/1cX3CPnv_3prZGKZF9eTLQsnPInfuw6sE/view (29 Junio 2020)
    1. Aguilera X, Mundt AP, Araos R, Weitzel T (2021) The story behind Chile’s rapid rollout of COVID-19 vaccination. Travel Med Infect Dis - PMC - PubMed
    1. Alvarez F, Argente D, Lippi F (2020) A simple planning problem for COVID-19 lockdown. Tech rep. 10.2139/ssrn.3569911
    1. Alvi MM, Sivasankaran S, Singh M. Pharmacological and non-pharmacological efforts at prevention, mitigation, and treatment for COVID-19. J Drug Target. 2020;28(7–8):742–754. doi: 10.1080/1061186X.2020.1793990. - DOI - PubMed

Publication types